. 2022 Sep 26;4(1):100145.
doi: 10.1016/j.xhgg.2022.100145. eCollection 2023 Jan 12.

Large 22q13.3 deletions perturb peripheral transcriptomic and metabolomic profiles in Phelan-McDermid syndrome

Collaborators, Affiliations

Large 22q13.3 deletions perturb peripheral transcriptomic and metabolomic profiles in Phelan-McDermid syndrome

Michael S Breen et al. HGG Adv. .

Abstract

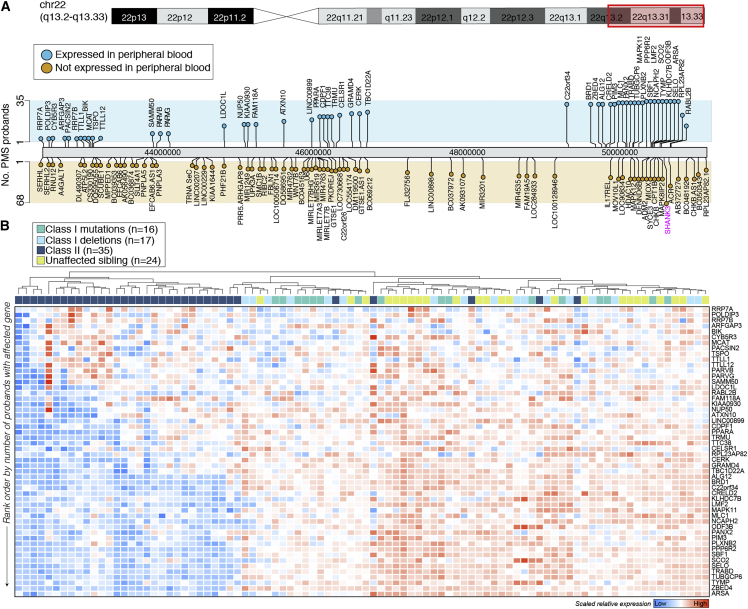
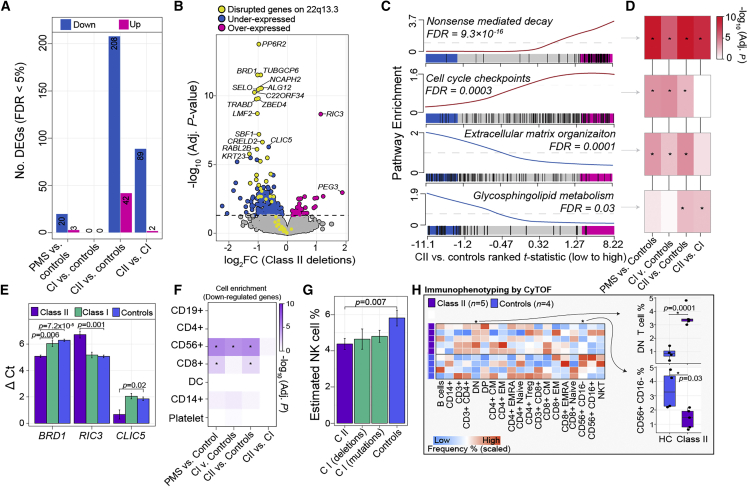
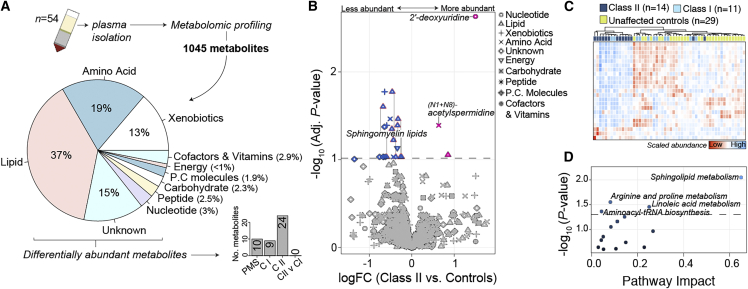
Phelan-McDermid syndrome (PMS) is a rare neurodevelopmental disorder caused at least in part by haploinsufficiency of the SHANK3 gene, due to sequence variants in SHANK3 or subtelomeric 22q13.3 deletions. Phenotypic differences have been reported between PMS participants carrying small "class I" mutations and large "class II" mutations; however, the molecular perturbations underlying these divergent phenotypes remain obscure. Using peripheral blood transcriptome and serum metabolome profiling, we examined the molecular perturbations in the peripheral circulation associated with a full spectrum of PMS genotypes spanning class I (n = 37) and class II mutations (n = 39). Transcriptomic data revealed 52 genes with blood expression profiles that tightly scale with 22q.13.3 deletion size. Furthermore, we uncover 208 underexpressed genes in PMS participants with class II mutations, which were unchanged in class I mutations. These genes were not linked to 22q13.3 and were strongly enriched for glycosphingolipid metabolism, NCAM1 interactions, and cytotoxic natural killer (NK) immune cell signatures. In silico predictions estimated a reduction in CD56+ CD16- NK cell proportions in class II mutations, which was validated by mass cytometry time of flight. Global metabolomics profiling identified 24 metabolites that were significantly altered in PMS participants with class II mutations and confirmed a general reduction in sphingolipid metabolism. Collectively, these results provide new evidence linking PMS participants carrying class II mutations with decreased expression of cytotoxic cell signatures, reduced relative proportions of NK cells, and lower sphingolipid metabolism. These findings highlight alternative avenues for therapeutic development and offer new mechanistic insights supporting genotype-to-phenotype associations in PMS.

Keywords: SHANK3; autism spectrum disorder; immunogenetics; immunophenotyping; multi-omics; rare disorders.


Conflict of interest statement

A.K. receives research support from AMO Pharma and consults to Acadia, Alkermes, Neuren, and GW Pharma. He serves on scientific advisory boards for Ovid Therapeutics, Jaguar Therapeutics, and Ritrova Therapeutics. M.S. reports grant support from Novartis, Biogen, Astellas, Aeovian, Bridgebio, and Aucta. He has served on scientific advisory boards for Novartis, Roche, Regenxbio, and Alkermes. The remaining authors declare that they have no competing interests.

Figures

Figure 1
Figure 1
The landscape of class I and class II mutations in PMS (A) Lollipop plot of genes affected by class I mutations and class II mutations across the terminal end of the long arm of chromosome 22 (22q13.3) in the 68 PMS probands included in the study. Genes are displayed as either expressed (blue; n = 52 genes) in peripheral blood or not (orange; n = 76 genes) and ranked by the number of probands harboring the affected gene (y axis). SHANK3 is highlighted in pink. (B) Unsupervised hierarchal clustering and heatmap (blue, low; red, high) depiction of the 52 genes on 22q13.3 that are expressed in peripheral blood affected by class I and class II mutations. Note that class I mutations are parsed into two groups: sequence variants (n = 16; green) and deletions (n = 17; light blue). Clustering distinguishes probands with class II mutations from those with class I mutations and unaffected controls. Genes were rank ordered by the number of PMS participants with the affected gene (y axis; rare to more frequent).
Figure 2
Figure 2
Altered peripheral blood gene expression profiles in class II mutations (A) The total number of differentially expressed genes (DEGs) (y axis) for each comparison (x axis). Each analysis adjusted for sex and age as covariates. (B) Volcano plot of class II DEGs relative to unaffected controls depicting log2 fold change (log2FC; x axis) and –log10 FDR adjusted p value (y axis). The horizontal line indicates FDR < 5%. Genes in yellow are the 52 genes expressed in blood that are affected by large class II mutations in PMS. Genes in blue are all other downregulated genes and those in pink are all other upregulated genes. (C) Four representative pathway enrichment scores (y axis) of class II DEGs according to ranked t statistics, high (pink) to low (blue) (x axis). All enrichment results can be found in Table S2. (D) The resulting FDR adjusted p value enrichment for all differential comparisons reveals shared and unique gene set enrichment among class II and class I mutations. (E) qRT-PCR validation of three target genes across four technical replicates (used to generate standard error bars) per group: BRD1 (a downregulated gene on chr 22); RIC3 (an upregulated gene on chr 11); and CLIC5 (a downregulated gene on chr 6). A Student’s t test was used to test delta CT values significant differences. (F) CAMERA cell-type enrichment of underexpressed DEGs (x axis) according to seven immune cell types (y axis) reveals strong enrichment of CD56+ genes. (G) CIBERSORTx cell-type predictions reveal a significant reduction in the frequency CD56+ cells among class II mutations. Standard error bars summarize variability across each respective group. (H) CyTOF validates estimated cell-type proportions on a subset of controls and participants with class II mutations. Scaled frequencies across all participants for major and minor immune cell populations are presented in heatmap form (right). Boxplots of the two immune populations with significant differences (p < 0.05, linear model) associated with class II mutations (left).
Figure 3
Figure 3
Plasma metabolomic profiling and alterations in participants with class II mutations (A) Top inset: plasma was collected from 54 participants and subjected to unbiased metabolomic profiling, which generated 1,045 high-confidence metabolites for subsequent analysis. The majority of detected metabolites classified as lipids (37%), amino acids (19%), xenobiotics (13%), unknown (15%), or six other less frequent categories. Bottom inset: differential abundance of metabolites was tested and the number of significant metabolites for each comparison are displayed. (B) Volcano plot of class II differentially abundant metabolites (DAMs) relative to unaffected controls depicting log fold change (logFC) (x axis) and –log10 FDR adjusted p value. The dotted horizontal line indicates a cut-off of FDR < 0.1. Metabolites are uniquely shaped according to ten super pathway categories and colored by more (red) or less (blue) abundant in participants with class II mutations. Ten sphingomyelin metabolites are outlined in pink borders. (C) Unsupervised clustering of 24 metabolites significantly altered by class II mutations correctly classify 85% (n = 12) of class II mutations from the remaining samples. Heatmap depicts high (red) and low (blue) relative scaled abundance for each metabolite. (D) Pathway analysis of metabolites altered in class II mutations reveals significant pathway enrichment (y axis; –log10 p value) for spingolipid metabolism and three other metabolism pathways relative to pathway impact (x axis). Pathway impact is a combination of the centrality and pathway enrichment results computed by adding the importance measures of each of matched metabolite and dividing by the sum of the importance measures of all metabolites in each pathway.

References

    1. Betancur C., Buxbaum J.D. SHANK3 haploinsufficiency: a "common" but underdiagnosed highly penetrant monogenic cause of autism spectrum disorders. Mol. Autism. 2013;4:17. - PMC - PubMed
    1. Leblond C.S., Nava C., Polge A., Gauthier J., Huguet G., Lumbroso S., Giuliano F., Stordeur C., Depienne C., Mouzat K., et al. Meta-analysis of SHANK mutations in autism spectrum disorders: a gradient of severity in cognitive impairments. PLoS Genet. 2014;10:e1004580. - PMC - PubMed
    1. Boccuto L., Lauri M., Sarasua S.M., Skinner C.D., Buccella D., Dwivedi A., Orteschi D., Collins J.S., Zollino M., Visconti P., et al. Prevalence of SHANK3 variants in patients with different subtypes of autism spectrum disorders. Eur. J. Hum. Genet. 2013;21:310–316. - PMC - PubMed
    1. De Rubeis S., Siper P.M., Durkin A., Weissman J., Muratet F., Halpern D., Trelles M.D.P., Frank Y., Lozano R., Wang A.T., et al. Delineation of the genetic and clinical spectrum of Phelan-McDermid syndrome caused by SHANK3 point mutations. Mol. Autism. 2018;9:31. - PMC - PubMed
    1. Mitz A.R., Philyaw T.J., Boccuto L., Shcheglovitov A., Sarasua S.M., Kaufmann W.E., Thurm A. Identification of 22q13 genes most likely to contribute to Phelan McDermid syndrome. Eur. J. Hum. Genet. 2018;26:293–302. - PMC - PubMed

Publication types

Supplementary concepts