. 2022 Sep 25;12(16):6865-6882.
doi: 10.7150/thno.76619. eCollection 2022.

Identifying the E2F3-MEX3A-KLF4 signaling axis that sustains cancer cells in undifferentiated and proliferative state

Affiliations

Identifying the E2F3-MEX3A-KLF4 signaling axis that sustains cancer cells in undifferentiated and proliferative state

Xu Yang et al. Theranostics. .

Abstract

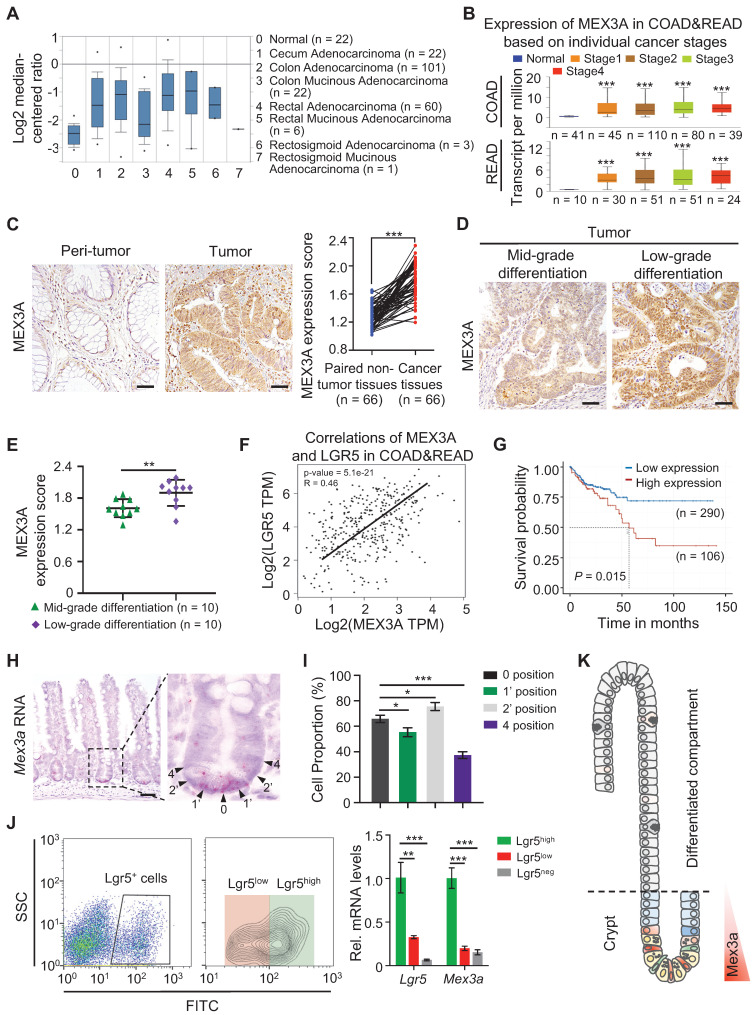
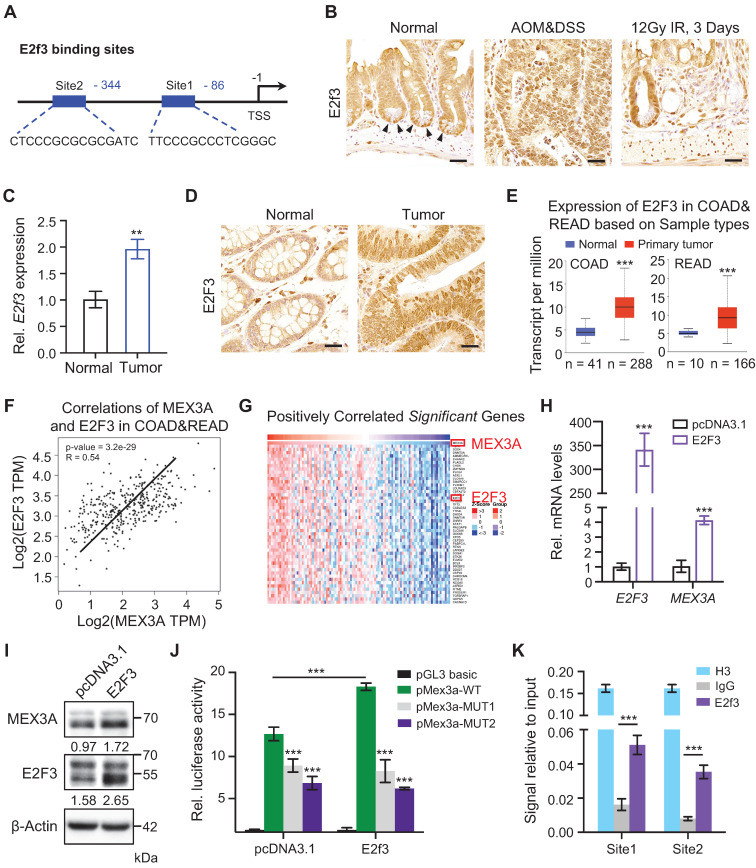
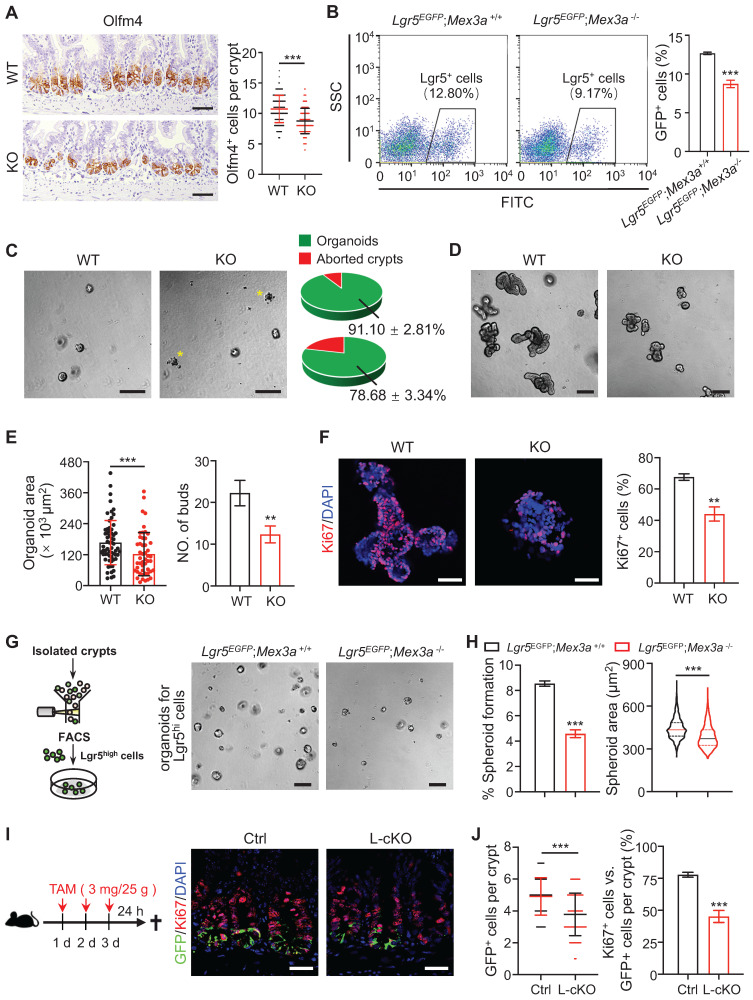
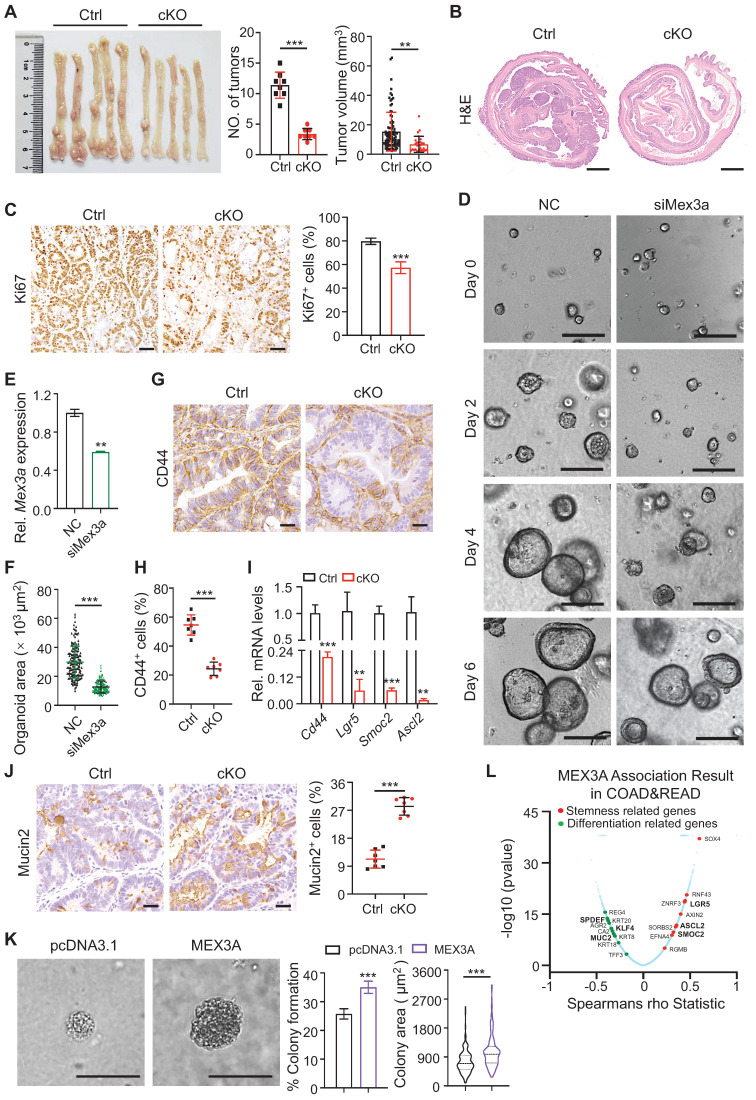
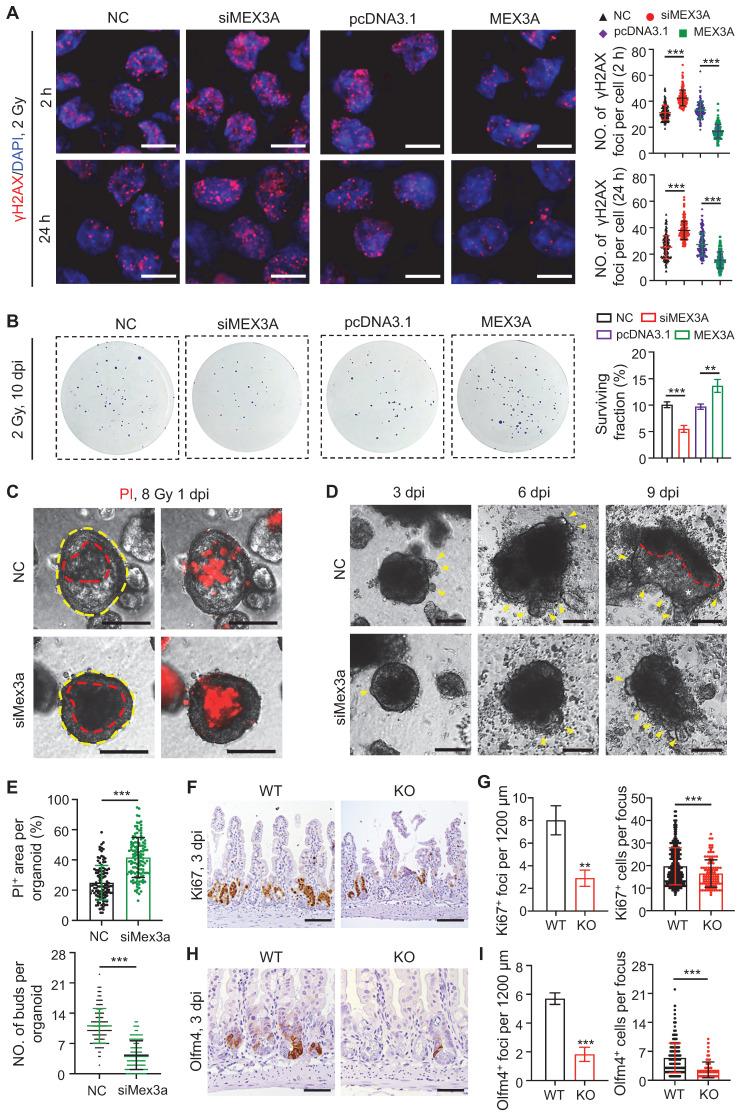
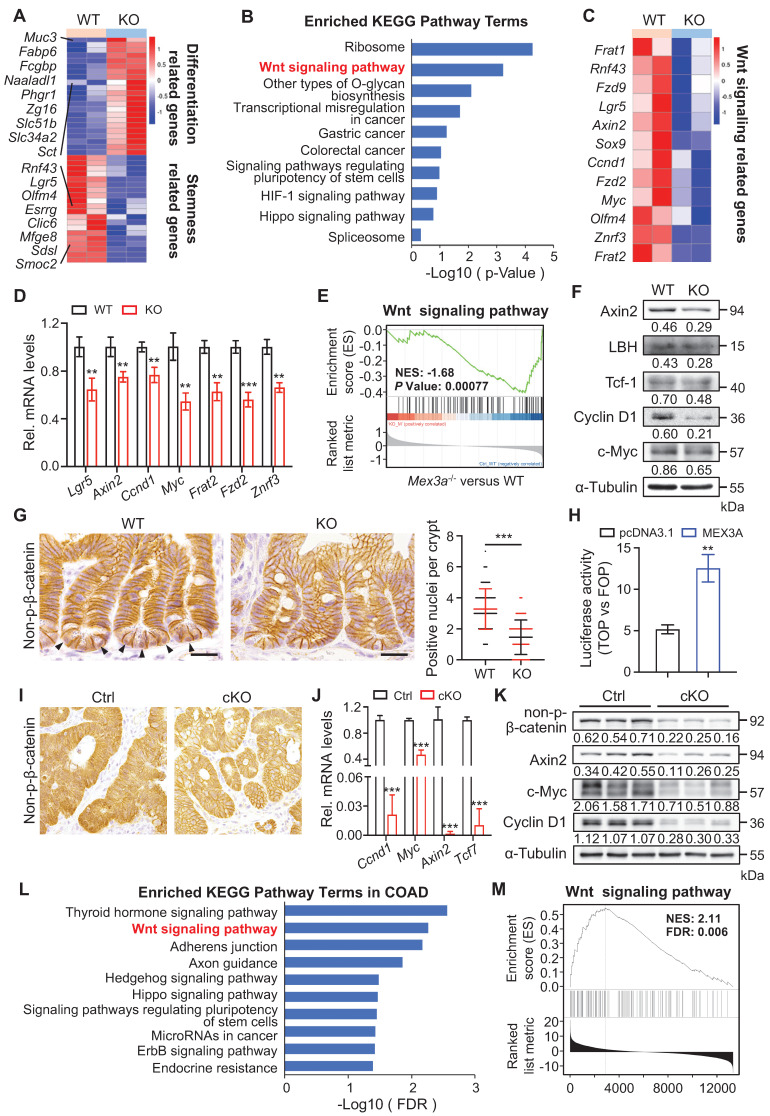
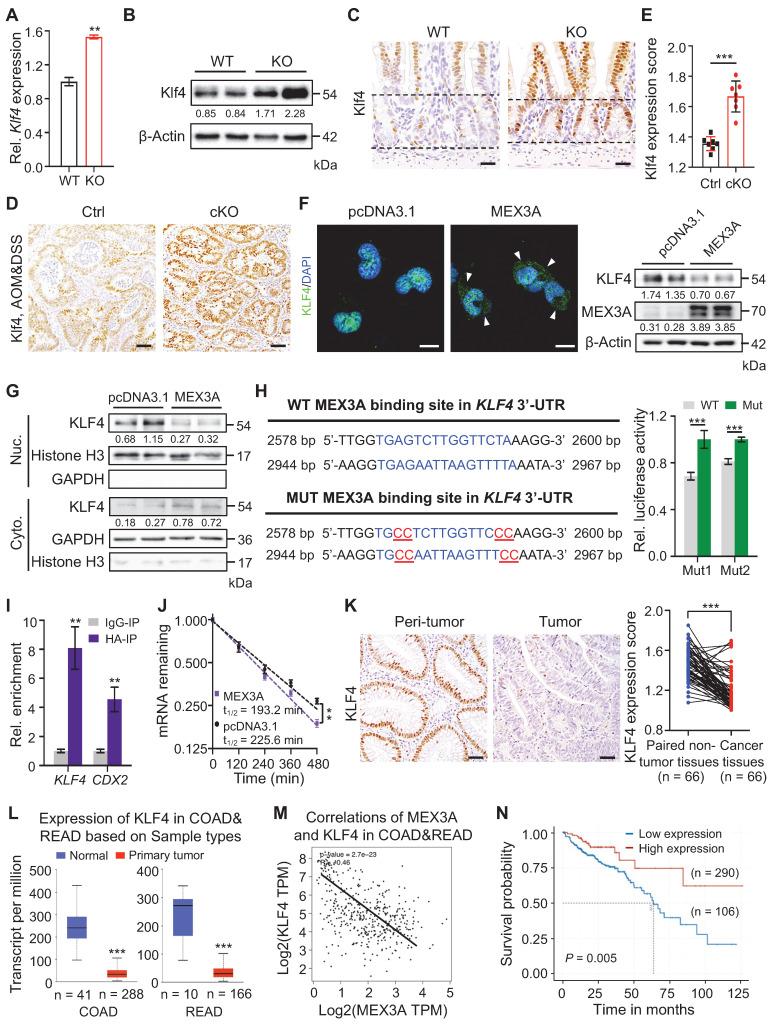
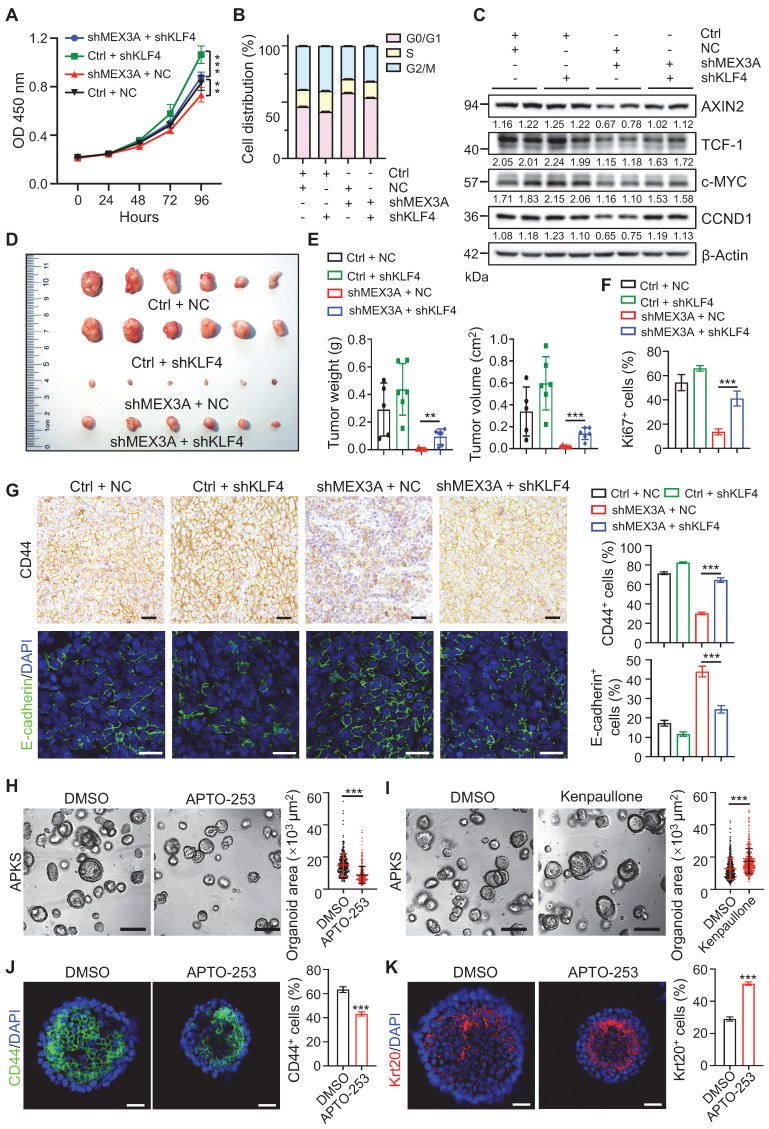
Rationale: Dysregulation of signaling that governs self-renewal and differentiation of intestinal stem cells (ISCs) is a major cause of colorectal cancer (CRC) initiation and progression. Methods: qRT-PCR, western blotting, in situ hybridization, immunohistochemistry and immunofluorescence assays were used to detect the expression levels of MEX3A, KLF4 and E2F3 in CRC tissues. The biological functions of MEX3A were studied using Mex3a knockout (KO) and intestinal epithelium specific conditional knockout (cKO) mice, AOM-DSS mouse colorectal tumor model, Apc floxed mouse tumor model and intestinal and tumor organoids. Transcriptomic RNA sequencing (RNA-seq), RNA crosslinking immunoprecipitation (CLIP) and luciferase reporter assays were performed to explore the molecular mechanisms of MEX3A. Results: RNA-binding protein MEX3A, a specific ISC marker gene, becomes ectopically upregulated upon CRC and its levels negatively correlate with patient survival prognosis. MEX3A functions as an oncoprotein that retains cancer cells in undifferentiated and proliferative status and it enhances their radioresistance to DNA damage. Mechanistically, a rate limiting factor of cellular proliferation E2F3 induces MEX3A, which in turn activates WNT pathway by directly suppressing expression of its pro-differentiation transcription factor KLF4. Knockdown of MEX3A with siRNA or addition of KLF4 agonist significantly suppressed tumor growth both by increasing differentiation status of cancer cells and by suppressing their proliferation. Conclusions: It identifies E2F3-MEX3A-KLF4 axis as an essential coordinator of cancer stem cell self-renewal and differentiation, representing a potent new druggable target for cancer differentiation therapy.

Keywords: Cancer stemness; Colorectal cancer; KLF4; MEX3A; Radio-resistance.


Conflict of interest statement

Competing Interests: The authors have declared that no competing interest exists.

Figures

Figure 1
Figure 1
MEX3A is ectopically overexpressed in CRC. A, Analysis of TCGA database showing upregulation of MEX3A in different colorectal tumor types. n, number of patient samples per colorectal tumor type. B, MEX3A levels increase with cancer stages in CRC patients. n, number of patient samples per colorectal cancer stage. C, Representative immunohistochemical images of MEX3A in CRC tissue and its paired adjacent normal tissues based on the colorectal cancer tissue array. Scores of MEX3A expression levels were quantified. Scale bar: 50 μm. D, Immunohistochemistry for MEX3A in human CRC samples containing low-grade and mid-grade differentiation tumors. Scale bar: 50 μm. E, Scores of MEX3A expression levels were quantified in panel D. F, Spearman correlation analysis of MEX3A and LGR5 (P < 0.001; R = 0.46) in human CRC based on TCGA-COAD&READ database. G, Kaplan-Meier survival curve of 396 CRC patients. P = 0.015. H, In situ hybridization for Mex3a in intestinal crypts from 8-week-old mice. High-magnification of the outlined area is on the right. Arrowheads point to crypt cells at 0, 1', 2' and 4 position. Scale bar: 50 μm. I, Frequency of Mex3a+ cells at indicated positions of intestinal crypts is quantified based on 111 crypts from 3 mice. J, Representative flow cytometry images of Lgr5neg, Lgr5low and Lgr5high cells from intestinal crypts of Lgr5EGFP-CreERT2 mice and qRT-PCR analysis for Mex3a and Lgr5 in sorted Lgr5neg, Lgr5low and Lgr5high cells. n = 3 biological replicates. K, Schematic of Mex3a expression in the intestinal crypt-villus axis. Data are presented as the mean ± SD. *P < 0.05; **P < 0.01; ***P < 0.001.
Figure 2
Figure 2
E2f3 directly regulates Mex3a expression. A, Schematic diagram showing two potential E2f3 binding sites at Mex3a promoter. B, Immunohistochemical staining for E2f3 in normal mouse intestinal crypts, AOM-DSS mouse colon tumors and regenerative foci in mouse intestinal crypts 3 days after 12 Gy γ-radiation. Arrowheads point to E2f3+ cells at the base of intestinal crypts. Scale bar: 25 μm. C, qRT-PCR analysis of E2f3 in normal mouse colon tissues and AOM-DSS-induced mouse colon tumors. n = 3. D, Representative immunohistochemical images of E2F3 in human colorectal peritumor and tumor tissues from CRC patients. Scale bar: 25 μm. E, Box plots of E2F3 expression in normal colorectum tissues and colorectal tumor tissues based on TCGA data. n, number of patient samples. F, Spearman correlation analysis of MEX3A and E2F3 (P < 0.001; R = 0.54) in human CRC based on TCGA database. G, Heatmap of genes significantly positively correlated with MEX3A in human CRC tissues based on TCGA database. The parameters of color key indicate the Z-score. H, qRT-PCR for E2F3 and MEX3A in HCT116 cells treated with pcDNA3.1 empty vector or pcDNA3.1-E2F3 plasmids. n = 3. I, Western blotting for E2F3 and MEX3A in HCT116 cells treated with pcDNA3.1 empty vector or pcDNA3.1-E2F3 plasmids. β-Actin was used as loading control. J, Luciferase activity in lysates of CT26 cells transfected with luciferase reporter plasmids containing pGL3-basic empty vector, wild-type Mex3a promoter, or Mex3a promoter with mutations in E2f3 binding sites under normal and E2f3 overexpression conditions. n = 3. K, Chromatin immunoprecipitation assay was carried out on CT26 cells using antibodies against E2f3 and Histone H3. The antibody against Histone H3 was used as a positive control. IgG was used as a negative control. The enrichment of E2f3 binding to Mex3a promoter was quantified using qRT-PCR. n = 3 technical replicates. Data are presented as the mean ± SD. *P < 0.05; **P < 0.01; ***P < 0.001.
Figure 3
Figure 3
Deletion of Mex3a compromises stemness and proliferative capacity of ISCs. A, Immunochemistry for Olfm4 in intestinal crypts from wild-type (WT) and KO mice. Numbers of Olfm4+ cells per crypt were quantified. WT, n = 162 crypts from 3 mice; KO, n = 139 crypts from 3 mice. Scale bar: 50 μm. B, The frequency of Lgr5+ ISCs in intestinal crypts from Lgr5EGFP;Mex3a+/+ and Lgr5EGFP;Mex3a-/- mice, assayed by flow cytometry. n = 3. C, Representative gross images of organoids from WT and KO mice 24 hours after seeding. Growing and aborted organoids were quantified. Yellow asterisks indicate aborted organoid debris. n = 3. Scale bar: 200 μm. D-E, Intestinal organoid images from WT and KO mice cultured 5 days after passaging (D). Organoid area and number of buds were quantified (E). n = 3. Scale bar: 200 μm. F, Immunofluorescence for Ki67 in intestinal organoids cultured 3 days after seeding. Percentage of Ki67+ cells was quantified. n = 3. Scale bar: 50 μm. G, Schematic showing isolation and culture of Lgr5high single cells. Representative images of spheroids for sorted Lgr5high single cells from Lgr5EGFP;Mex3a+/+ and Lgr5EGFP;Mex3a-/- mice 4 days after seeding. Lgr5high single cells were seeded at the same initial density. n = 2 biologically independent experiments with 3 technical replicates each. Scale bar: 200 μm. H, Quantification of the percentage of growing spheroids and spheroid area in panel G. I, Schematic for deleting Mex3a in Lgr5+ cells using Lgr5EGFP-CreERT2;Mex3afl/fl mice (L-cKO). Intestinal tissues were harvested 24 hours after the last tamoxifen injection. Double immunofluorescence for GFP and Ki67 in ileum from control and L-cKO mice. Scale bar: 25 μm. J, Number of GFP+ cells per crypt and percentage of Ki67+GFP+ cells versus GFP+ cells per crypt in panel I were quantified. Control, n = 212 crypts, 3 mice; L-cKO, n = 210 crypts, 3 mice. Data are presented as the mean ± SD. *P < 0.05; **P < 0.01; ***P < 0.001.
Figure 4
Figure 4
Deletion of Mex3a suppresses tumor growth. A, Gross images of AOM-DSS mouse colon tumors from control (Ctrl) and Mex3a cKO mice. Number of tumors per mouse and tumor volume were quantified. Ctrl: n = 91 tumors from 8 mice. cKO: n = 27 tumors from 8 mice. B, Representative histological images of AOM-DSS colon tumors from Ctrl and cKO mice. n = 8. Scale bar: 2 mm. C, Immunohistochemistry for Ki67 in AOM-DSS colon tumors from Ctrl and cKO mice. Percentage of Ki67+ cells was quantified. n = 7. Scale bar: 50 μm. D, Growth of APKS mouse tumor organoids over time. The organoids were transfected with siRNA of Mex3a (siMex3a). n = 3. Scale bar: 200 μm. E, qRT-PCR analysis of Mex3a in mouse tumor organoids after transfection with siMex3a. n = 3. F, Quantification of the organoid area in panel D. G-H, Representative immunohistochemical images for CD44 in AOM-DSS tumors from Ctrl and cKO mice (G). Percentage of CD44+ cells was quantified (H). n = 7. Scale bar: 50 μm. I, qRT-PCR for cancer stem cell markers Cd44, Lgr5, Smoc2 and Ascl2 in AOM-DSS tumors from Ctrl and cKO mice. n = 3. J, Immunohistochemistry for Mucin2 in AOM-DSS tumors from Ctrl and cKO mice. Percentage of Mucin2+ cells was quantified. n = 7. Scale bar: 50 μm. K, Anchorage-independent growth of HCT116 cells transfected with pcDNA3.1 empty vector or pcDNA3.1-MEX3A plasmids. Colony-forming percentage and colony area were quantified. Colonies were grown for over 3 weeks. n = 3. Scale bar: 50 μm. L, Volcano plot of significantly correlated genes with MEX3A in COAD and READ. Stemness related genes are marked in red and differentiation related genes are marked in green. Data are presented as the mean ± SD. *P < 0.05; **P < 0.01; ***P < 0.001.
Figure 5
Figure 5
Silencing Mex3a sensitizes cancer cells to irradiation. A, Immunofluorescence for γH2AX in HCT116 transfected with siMex3a or pcDNA3.1-Mex3a plasmids 2 hours and 24 hours post 2 Gy γ-radiation. Numbers of γH2AX+ foci per cell were quantified. n = 3. Scale bar: 25 μm. B, Clonogenic assay of HCT116 cells transfected with siMex3a or pcDNA3.1-Mex3a plasmids following radiation. Surviving fractions were calculated. n = 3. C, PI staining of APKS mouse tumor organoids transfected with siMex3a 24 hours after 8 Gy γ-radiation. Red line indicates the area of cell death. n = 4. Scale bar: 200 μm. D, Representative gross images of mouse tumor organoids transfected with siMex3a at indicated timepoints post 8 Gy γ-radiation. Yellow arrowheads indicate newly generating organoid buds. Newly generating zones are indicated with white asterisks. n = 3. Scale bar: 200 μm. E, Quantification of PI+ area per organoid in panel C and numbers of buds per organoid in panel D. F, Immunohistochemistry for Ki67 in ileum from wild-type (WT) and KO mice 3 days postirradiation. Scale bar: 100 μm. G, Quantification of Ki67+ regenerative foci per 1200 μm and number of Ki67+ cells per regenerative focus in panel F. n = 3. H, Immunohistochemistry for Olfm4 in ileum from WT and KO mice 3 days postirradiation. Scale bar: 50 μm. I, Quantification of Olfm4+ foci per 1200 μm and numbers of Olfm4+ cells per focus in panel H. n = 3. Data are presented as the mean ± SD. *P < 0.05; **P < 0.01; ***P < 0.001.
Figure 6
Figure 6
Mex3a deletion suppresses WNT signaling activity. A, Heatmap depicting the expression profiles of stemness related genes and differentiation related genes in transcriptome profiles of wild-type (WT) and KO mice. B, KEGG pathway analysis of downregulated genes in transcriptome profiles from WT and KO mice. n = 4 biological replicates. C, Heatmap showing altered WNT-related genes in WT and KO mice. D, qRT-PCR analysis validates altered WNT-related genes in WT and KO mice. n = 3. E, Gene set enrichment analysis (GSEA) of WNT signaling pathway genes in transcriptome profiles of WT and KO mice. F, Western blotting for WNT target genes c-Myc, Cyclin D1, Tcf-1, LBH and Axin2 in intestinal crypts from WT and KO mice. α-Tubulin was used as a loading control. G, Representative immunohistochemical images of non-p-β-catenin in ileum from WT and KO mice. Arrowheads point to non-p-nuclei. Numbers of nuclear β-catenin+ cells per crypt were quantified. WT, n = 245 crypts from 3 mice; KO, n = 253 crypts from 3 mice. Scale bar: 25 μm. H, Luciferase activity of TOPflash versus FOPflash in HCT116 cells treated with pcDNA3.1 empty vector and MEX3A plasmids. n = 3. I, Immunohistochemistry for non-p-β-catenin in AOM-DSS colon tumors from control (Ctrl) and cKO mice. n = 7. Scale bar: 25 μm. J, qRT-PCR analysis of WNT target genes in AOM-DSS tumors from Ctrl and cKO mice. n = 3. K, Western blotting for Cyclin D1, c-Myc, Axin2 and non-p-β-catenin in AOM-DSS tumors from Ctrl and cKO mice. α-Tubulin was used as a loading control. L, KEGG pathway analysis of genes positively correlated with MEX3A in COAD. M, Gene set enrichment analysis of WNT signaling pathway in genes positively correlated with MEX3A in COAD. Data are presented as the mean ± SD. *P < 0.05; **P < 0.01; ***P < 0.001.
Figure 7
Figure 7
MEX3A directly suppresses KLF4 to activate WNT signaling. A-B, qRT-PCR (A, n = 3) and Western blotting (B) for Klf4 in ileum tissues from wild-type (WT) and KO mice. α-Tubulin was used as loading control. C, Representative immunohistochemical images of Klf4 in intestinal crypts from WT and KO. The dashed lines indicate villus-crypt junction and base of the crypt. n = 3. Scale bar: 25 μm. D-E, Immunohistochemistry for Klf4 in AOM-DSS colon tumors from control (Ctrl) and cKO mice (D). Scores of Klf4 expression levels were quantified (E). n = 3. Scale bar: 50 μm. F, Immunofluorescence for KLF4 and Western blotting for MEX3A and KLF4 in NCM460 cells treated with empty vector or MEX3A-overexpressing plasmids. Scale bar: 25 μm. β-Actin was used as a loading control. Arrowheads indicate KLF4 signal in cytoplasm. G, Western blotting for KLF4 in nuclear and cytoplasmic proteins isolated from NCM460 cells treated with empty vector or MEX3A-overexpressing plasmids. Histone H3 and GAPDH were used as positive control for nuclear and cytoplasmic proteins, respectively. H, Ratio of luciferase activity in MEX3A-overexpressing versus normal HEK293T cells transfected with luciferase reporter vector containing a KLF4 3'-UTR fragment with WT sequence or mutations (Mut1 or Mut2) in MEX3A binding sites. n = 3. I, Crosslinking-Immunoprecipitation (CLIP)-PCR assay for KLF4 and CDX2 upon the anti-HA (MEX3A-HA) antibody immunoprecipitates. n = 3 technical replicates. J, The KLF4 mRNA decays curve in HCT116 cells upon MEX3A overexpression. n = 3. K, Immunohistochemistry for KLF4 in human colorectal tumors and paired peritumor samples. Scores of KLF4 expression levels were quantified. Scale bar: 50 μm. L, Box plots of KLF4 expression in normal human colorectum and CRC tissues based on TCGA database. n, number of patient samples. M, Spearman correlation analysis of MEX3A and KLF4 (P < 0.001; R = - 0.46) in human CRC based on TCGA database. N, Kaplan-Meier survival curve of 396 CRC patients. P = 0.005. Data are presented as the mean ± SD. *P < 0.05; **P < 0.01; ***P < 0.001.
Figure 8
Figure 8
KLF4 mediates promoting effects of MEX3A on tumor growth and stemness. A, Growth curve of HCT116 cells transfected with shMEX3A and/or shKLF4 over time. n = 6. B, Cell cycle analysis with flow cytometry for HCT116 cells transfected with shMEX3A and/or shKLF4. n = 3. C, Western blotting for CCND1, c-MYC, TCF-1 and AXIN2 in HCT116 cells treated with shMEX3A and/or shKLF4. β-Actin was used as a loading control. D, Gross images of xenografted tumors 3 weeks after transplantation with shMEX3A-and/or shKLF4-transfected HCT116 cells. E, Quantification for tumor weight and volume shown in panel D. n = 6. F, Quantification of percentages of Ki67+ cells in xenografted tumors shown in Figure S12H. n = 6. G, Immunostaining for CD44 and E-cadherin in xenografted tumors from HCT116 cells transfected with shMEX3A and/or shKLF4. The percentages of CD44+ cells and E-cadherin+ cells were quantified. n = 6. Scale bar: 50 μm. H-I, Growth of mouse tumor organoids after KLF4 activation (H) or inhibition (I). Organoids were grown for 48 hours and then treated with KLF4 agonist APTO-253 or KLF4 antagonist Kenpaullone for 72 hours. DMSO was used as solvent control. Organoid area was quantified. n = 3 technical replicates. Scale bar: 200 μm. J-K, Immunofluorescence for CD44 (J) and Krt20 (K) in mouse tumor organoids upon Klf4 activation. The percentages of CD44+ cells and Krt20+ cells were quantified. n = 3. Scale bar: 25 μm. Data are presented as the mean ± SD. *P < 0.05; **P < 0.01; ***P < 0.001.

Similar articles

Cited by

References

    1. Sung H, Ferlay J, Siegel RL, Laversanne M, Soerjomataram I, Jemal A. et al. Global cancer statistics 2020: GLOBOCAN estimates of incidence and mortality worldwide for 36 cancers in 185 countries. CA Cancer J Clin. 2021;71:209–49. - PubMed
    1. Visvader JE, Lindeman GJ. Cancer stem cells in solid tumours: accumulating evidence and unresolved questions. Nat Rev Cancer. 2008;8:755–68. - PubMed
    1. van Es JH, Clevers H. Notch and Wnt inhibitors as potential new drugs for intestinal neoplastic disease. Trends Mol Med. 2005;11:496–502. - PubMed
    1. Barker N, Ridgway RA, van Es JH, van de Wetering M, Begthel H, van den Born M. et al. Crypt stem cells as the cells-of-origin of intestinal cancer. Nature. 2009;457:608–11. - PubMed
    1. Zhang Y, Que J. BMP signaling in development, stem cells, and diseases of the gastrointestinal tract. Annu Rev of Physiol. 2020;82:251–73. - PubMed

Publication types

MeSH terms