. 2022 Oct 3;12(16):6915-6930.
doi: 10.7150/thno.78171. eCollection 2022.

CUB Domain-Containing Protein 1 (CDCP1) is a rational target for the development of imaging tracers and antibody-drug conjugates for cancer detection and therapy

Affiliations

CUB Domain-Containing Protein 1 (CDCP1) is a rational target for the development of imaging tracers and antibody-drug conjugates for cancer detection and therapy

Tashbib Khan et al. Theranostics. .

Abstract

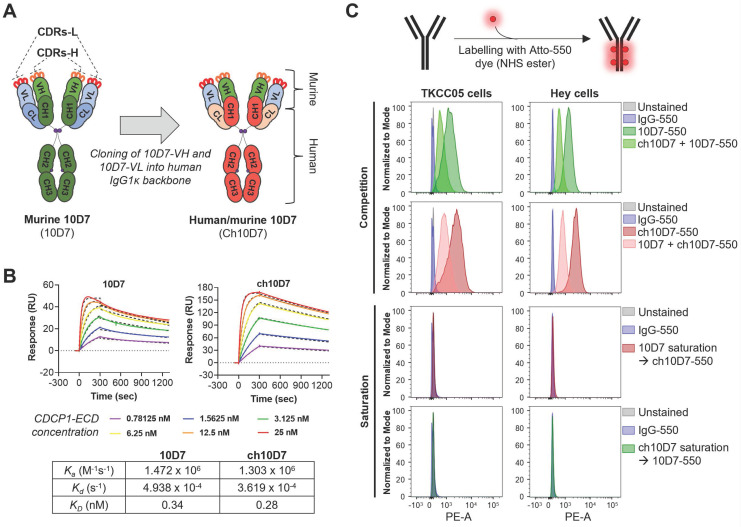
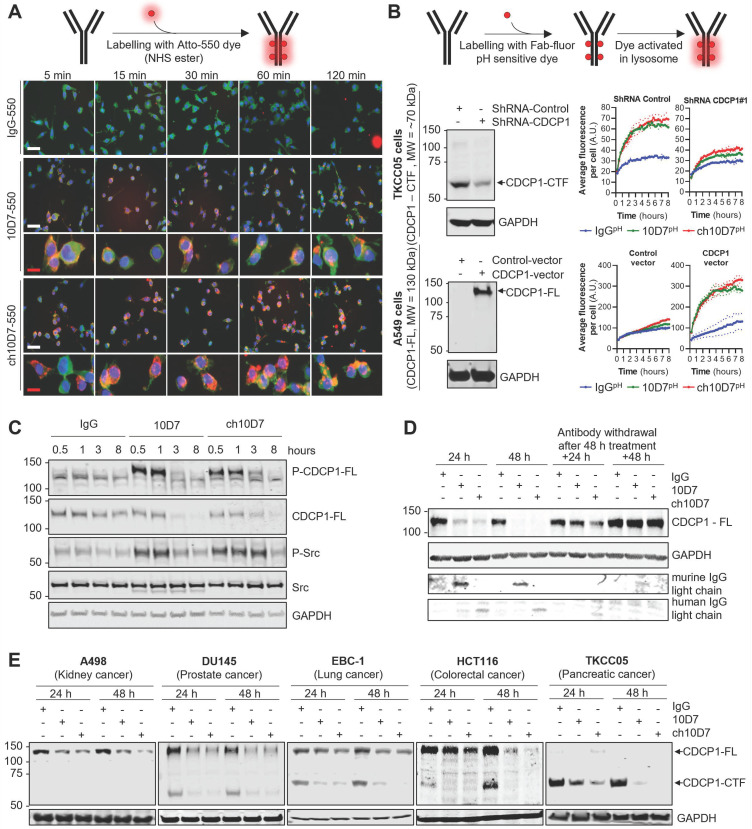
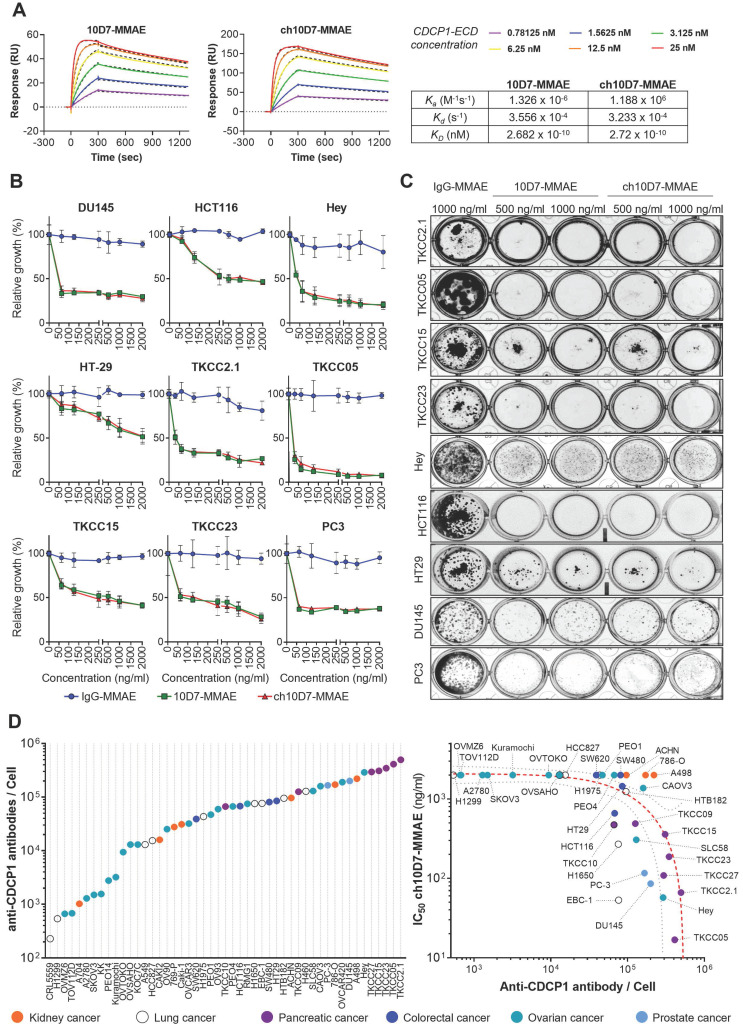
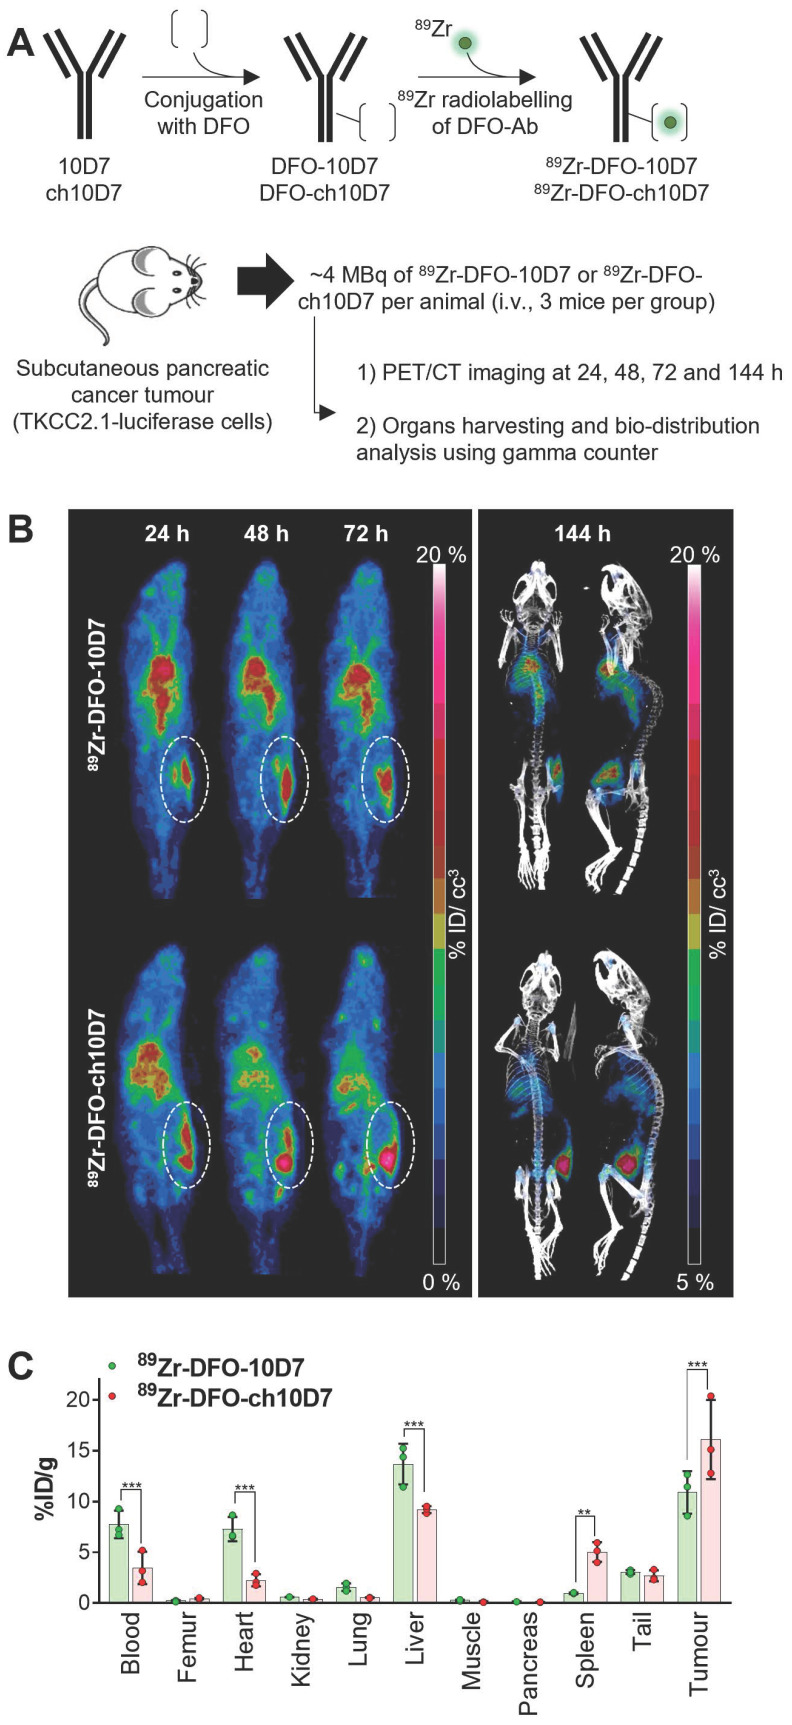
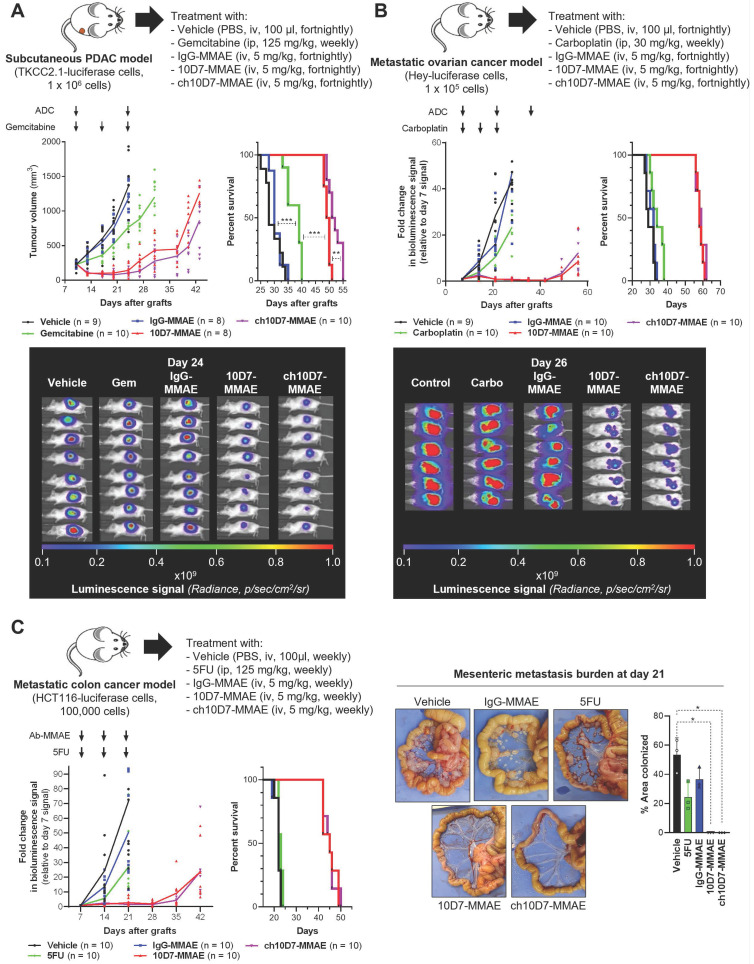
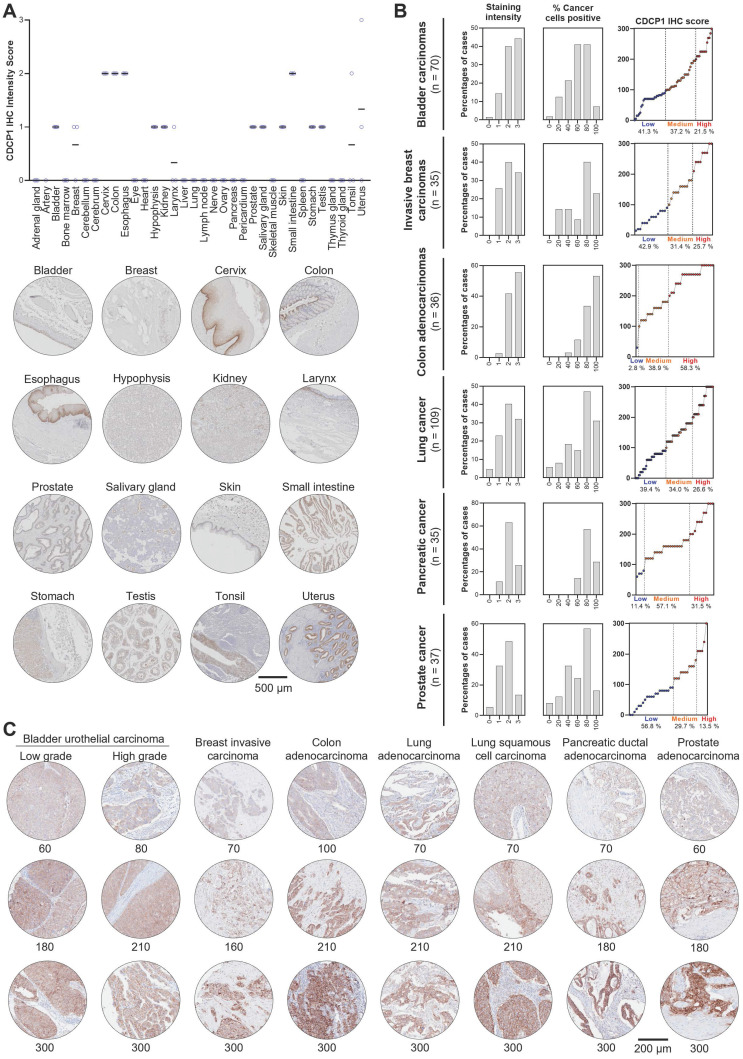
Rationale: An antibody-drug conjugate (ADC) is a targeted therapy consisting of a cytotoxic payload that is linked to an antibody which targets a protein enriched on malignant cells. Multiple ADCs are currently used clinically as anti-cancer agents significantly improving patient survival. Herein, we evaluated the rationale of targeting the cell surface oncoreceptor CUB domain-containing protein 1 (CDCP1) using ADCs and assessed the efficacy of CDCP1-directed ADCs against a range of malignant tumors. Methods: CDCP1 mRNA expression was evaluated using large transcriptomic datasets of normal/tumor samples for 23 types of cancer and 15 other normal organs, and CDCP1 protein expression was examined in 34 normal tissues, >300 samples from six types of cancer, and in 49 cancer cell lines. A recombinant human/mouse chimeric anti-CDCP1 antibody (ch10D7) was labelled with 89Zirconium or monomethyl auristatin E (MMAE) and tested in multiple pre-clinical cancer models including 36 cancer cell lines and three mouse xenograft models. Results: Analysis of CDCP1 expression indicates elevated CDCP1 expression in the majority of the cancers and restricted expression in normal human tissues. Antibody ch10D7 demonstrates a high affinity and specificity for CDCP1 inducing cell signalling via Src accompanied by rapid internalization of ch10D7/CDCP1 complexes in cancer cells. 89Zirconium-labelled ch10D7 accumulates in CDCP1 expressing cells enabling detection of pancreatic cancer xenografts in mice by PET imaging. Cytotoxicity of MMAE-labelled ch10D7 against kidney, colorectal, lung, ovarian, pancreatic and prostate cancer cells in vitro, correlates with the level of CDCP1 on the plasma membrane. ch10D7-MMAE displays robust anti-tumor effects against mouse xenograft models of pancreatic, colorectal and ovarian cancer. Conclusion: CDCP1 directed imaging agents will be useful for selecting cancer patients for personalized treatment with cytotoxin-loaded CDCP1 targeting agents including antibody-drug conjugates.

Keywords: CDCP1; antibody-drug conjugate; cancer; receptor; theranostics.


Conflict of interest statement

Competing Interests: Thomas Kryza, Simon Puttick, Yaowu He and John D. Hooper are inventors on a patent covering the use of antibody 10D7 used in this study. No potential conflicts of interest were disclosed by the other authors.

Figures

Figure 1
Figure 1
Generation of human/mouse chimeric anti-CDCP1 antibody ch10D7 from mouse monoclonal antibody 10D7. A. Schematic illustrating the generation of ch10D7 from murine 10D7. B. Comparative analysis of ch10D7 and 10D7 binding affinity to CDCP1-ECD by SPR. Top: SPR-derived sensograms of ch10D7 and 10D7 binding to various concentrations of recombinant CDCP1-ECD. Bottom: Table summarizing association (Ka), dissociation (Kd) and affinity (KD) constants of ch10D7 and 10D7 to CDCP1-ECD. C. Comparison of binding of ch10D7 and 10D7, fluorescently labelled with the dye Atto-550, to PDAC (TKCC05) and ovarian cancer (HEY) cells by flow cytometry. Top panel: Competition experiments in which cells were incubated with either one labelled antibody or the combination of one labelled antibody with the other unlabelled antibody (ratio 1:1). Bottom panel Saturation experiments in which CDCP1 binding sites for one labelled antibody were blocked with saturating amounts of the other unlabelled antibody (ratio 1:10). CDR, Complementarity-determining region; -L, Light; -H, Heavy; VL, Variable light; VH, Variable heavy; CH, Constant heavy; CL, Constant light.
Figure 2
Figure 2
Antibody ch10D7 induces transient activation of CDCP1 signalling and receptor internalisation and degradation. A. Top: Schematic illustrating the labelling of antibodies with Atto-550 fluorescent dye. Bottom: Time lapse images (5 -120min) of fluorescently labelled antibodies (5 µg/ml; IgG-, 10D7- or ch10D7-550, red) binding to PDAC TKCC05 cells. After the indicated periods, cells were fixed and counter stained with WGA-488 (membrane staining, green) and DAPI (DNA, blue). White scale bar = 200 µm; Red scale bar = 50 µm. B. Assessment of anti-CDCP1 antibody internalization in cancer cells lines that have different levels of CDCP1. Top panel: 10D7, ch10D7 or control IgG were labelled with a Fab fluor conjugated to a pH-sensitive fluorescent dye as depicted. Bottom panel: Internalization of antibodies was assessed in CDCP1 positive PDAC TKCC05 cells stably transduced with a control shRNA or a CDCP1 silencing shRNA (CDCP1-shRNA) and in CDCP1 negative lung cancer A549 cells stably transduced with a control vector or a CDCP1-encoding vector. Internalization was assessed by measurement of the accumulation of fluorescent signal per cell using an Incucyte S3 system after treatment of cells with the labelled antibody (5 µg/ml). For both cellular models, western blot analysis of CDCP1 level are shown on the left. C and D. Impact of anti-CDCP1 antibodies on CDCP1 in ovarian cancer cells. C. Western blot analysis, using antibodies against p-CDCP1-Y734, CDCP1, p-Src-Y416, Src and GAPDH, of lysates from HEY cells treated for up to 8 h with ch10D7, 10D7 or control IgG (5 µg/ml) . D. Western blot analysis, using antibodies against p-CDCP1-Y734, CDCP1, p-Src-Y416, Src and GAPDH, of lysates from HEY cells treated for 24h or 48 h with antibody 10D7, ch10D7 or control IgG (5 µg/ml) before antibody washout then further growth up to 48h in normal medium. E. Impact of anti-CDCP1 antibody on CDCP1 expression in five cancer cell lines. Western blot analysis of lysates from cell lines treated for 24 or 48 h with 10D7, ch10D7 or control IgG (5 µg/ml). Lysates were probed by western blot analysis for CDCP1 (antibody 4115) and GAPDH.
Figure 3
Figure 3
In vitro cytotoxicity of anti-CDCP1 ADCs: A. Comparative analysis of ch10D7-MMAE and 10D7-MMAE ADC binding affinity to CDCP1 ECD by SPR analysis. Top: SPR-derived sensograms of ch10D7-MMAE and 10D7-MMAE binding to various concentrations of recombinant CDCP1-ECD. Bottom: Table summarizing association (Ka), dissociation (Kd) and affinity (KD) constants of ch10D7-MMAE and 10D7-MMAE to CDCP1-ECD. B. Quantitative analysis of growth inhibition of cancer cells by ADCs. Cancer cells (4,000 cells/well) were treated for 6 h with the respective ADC (0 - 2000 ng/ml) then grown for a further 72 h in complete medium. Cell growth was quantified by absorbance measurements at 490 nm of wells incubated with the CellTiter AQueous One Solution Reagent. Data are presented as mean of relative cell growth (compared to untreated cells) +/- SD from three independent experiments. C. Qualitative analysis of the impact of ADCs on cancer cell colony formation. Cell lines were treated for 6 h with the respective ADC (500 - 1000 ng/ml) before plating at low density (500 cells/well) in complete medium and grown for a further 10 to 14 days when colonies were fixed using PFA and stained with crystal violet. Representative images of colonies are shown. D. Examination of correlation between cell surface CDCP1 and cell response to ADC ch10D7-MMAE. Left: The number of fluorescently labelled anti-CDCP1 antibodies bound per cell was evaluated by flow cytometry against a panel of 49 cancer cell lines using an anti-CDCP1 antibody conjugated with PE (CD318-PE). The number of fluorescently labelled anti-CDCP1 antibodies bound/cell was interpolated from a standard curve generated from known numbers of Quantibright beads. Results are expressed as median of antibodies/cell from at least 5,000 cells. Right: Correlation between the potency of ch10D7-MMAE ADC (represented by GI50 values for each cell line) versus the number of fluorescently labelled anti-CDCP1 antibodies bound/cell. MW, Molecular weight.
Figure 4
Figure 4
Anti-CDCP1 antibody ch10D7 accumulates in CDCP1 expressing cancer tissues in vivo. A. Schematic depicting generation of radiolabelled ch10D7-89Zr and 10D7-89Zr (top), and the experimental plan for the in vivo PDAC model (bottom). B. Representative PET-CT images of NSG mice carrying subcutaneous xenografts of PDAC TKCC2.1 cells. Left: PET imaging (ventral view maximum intensity projection) at 24, 48 and 72 h after antibody injection. Right: PET/CT imaging (ventral and lateral views maximum intensity projection) at 144 h after antibody injection. C. Quantitative distribution analysis of 89Zr-DFO-10D7 and ch10D7-89Zr 144 h post injection (n = 3) in normal tissues and xenografts. Statistical significance between different groups was performed using a two-way ANOVA test with *** p<0.001.
Figure 5
Figure 5
Efficacy of ADC ch10D7-MMAE in in vivo cancer models. Presented for each model: Top, Schematic of the experimental protocol including xenograft site, cancer cell line and treatment regimen; Bottom left: Graph of tumor burden versus time for each treatment group; Bottom right, Kaplan-Meier survival curve of mice in each treatment group. A. Preclinical model of PDAC involving subcutaneous xenografts in NSG mice of TKCC2.1 cells (1x10⁶/mouse; 8-10 mice/group). Once tumors reached 200 mm3 mice were randomized then treated with ADCs every two weeks (5mg/kg i.v.), weekly gemcitabine (125mg/kg i.p.) or vehicle control. B. Preclinical model of ovarian cancer involving intraperitoneal xenografts in NSG mice of luciferase labelled HEY cells (1x10⁵; 9-10 mice/group). One week after injection of cells mice were randomized then treated with ADCs every two weeks (5mg/kg i.v.), weekly carboplatin (30mg/kg i.p.) or vehicle control. C. Preclinical model of metastatic colorectal cancer involving intraperitoneal xenografts in NSG mice of luciferase labelled HCT116 cells (1x10⁵; 10 mice/group). One week after injection of cells mice were randomized then treated with ADCs every two weeks (5 mg/kg i.v.), weekly 5FU (125 mg/kg i.p.) or vehicle control. For subcutaneous xenografts, tumor burden was measured twice weekly using calipers, while tumor burden for intraperitoneal xenografts was measured by weekly bioluminescent imaging. Once mice in any group required euthanasia due to disease burden, treatments were stopped, and survival followed. Statistical significance of the survival analysis was assessed using Log-rank Gehran-Breslow Wilcoxon Chi2 test.
Figure 6
Figure 6
CDCP1 expression in normal and malignant human tissues. CDCP1 protein expression in normal human tissues and cancers determined by immunohistochemistry using antibody 4115. A. Top: Graph of immunohistochemistry staining intensity score (0 to 3). Black bar, mean staining intensity score; Circle, staining intensity score for each case. Bottom: Representative immunohistochemistry images of normal tissues for CDCP1 expression. For each tissue, the sample showing the highest staining intensity is shown. B. Graphs of scores for CDCP1 protein staining intensity (left) and percentage (%) cancer cell positive for CDCP1 protein (middle), and combined CDCP1 immunohistochemistry score (right) for six cancer types. C. Representative images of CDCP1 immunohistochemistry staining in various cancers for a range of immunohistochemistry scores.

References

    1. Fu Z, Li S, Han S, Shi C, Zhang Y. Antibody drug conjugate: the "biological missile" for targeted cancer therapy. Signal Transduct Target Ther. 2022;7:93. - PMC - PubMed
    1. Gambardella V, Tarazona N, Cejalvo JM, Lombardi P, Huerta M, Rosello S, Personalized Medicine: Recent Progress in Cancer Therapy. Cancers (Basel) 2020. 12. - PMC - PubMed
    1. Jeelani S, Reddy RC, Maheswaran T, Asokan GS, Dany A, Anand B. Theranostics: A treasured tailor for tomorrow. J Pharm Bioallied Sci. 2014;6:S6–8. - PMC - PubMed
    1. Malone ER, Oliva M, Sabatini PJB, Stockley TL, Siu LL. Molecular profiling for precision cancer therapies. Genome Med. 2020;12:8. - PMC - PubMed
    1. Arnold C. Theranostics could be big business in precision oncology. Nat Med. 2022;28:606–8. - PubMed

Publication types