. 2022 Jan;1(1):85-100.
doi: 10.1038/s44161-021-00009-1. Epub 2022 Jan 12.

A mechanistic framework for cardiometabolic and coronary artery diseases

Affiliations

A mechanistic framework for cardiometabolic and coronary artery diseases

Simon Koplev et al. Nat Cardiovasc Res. 2022 Jan.

Abstract

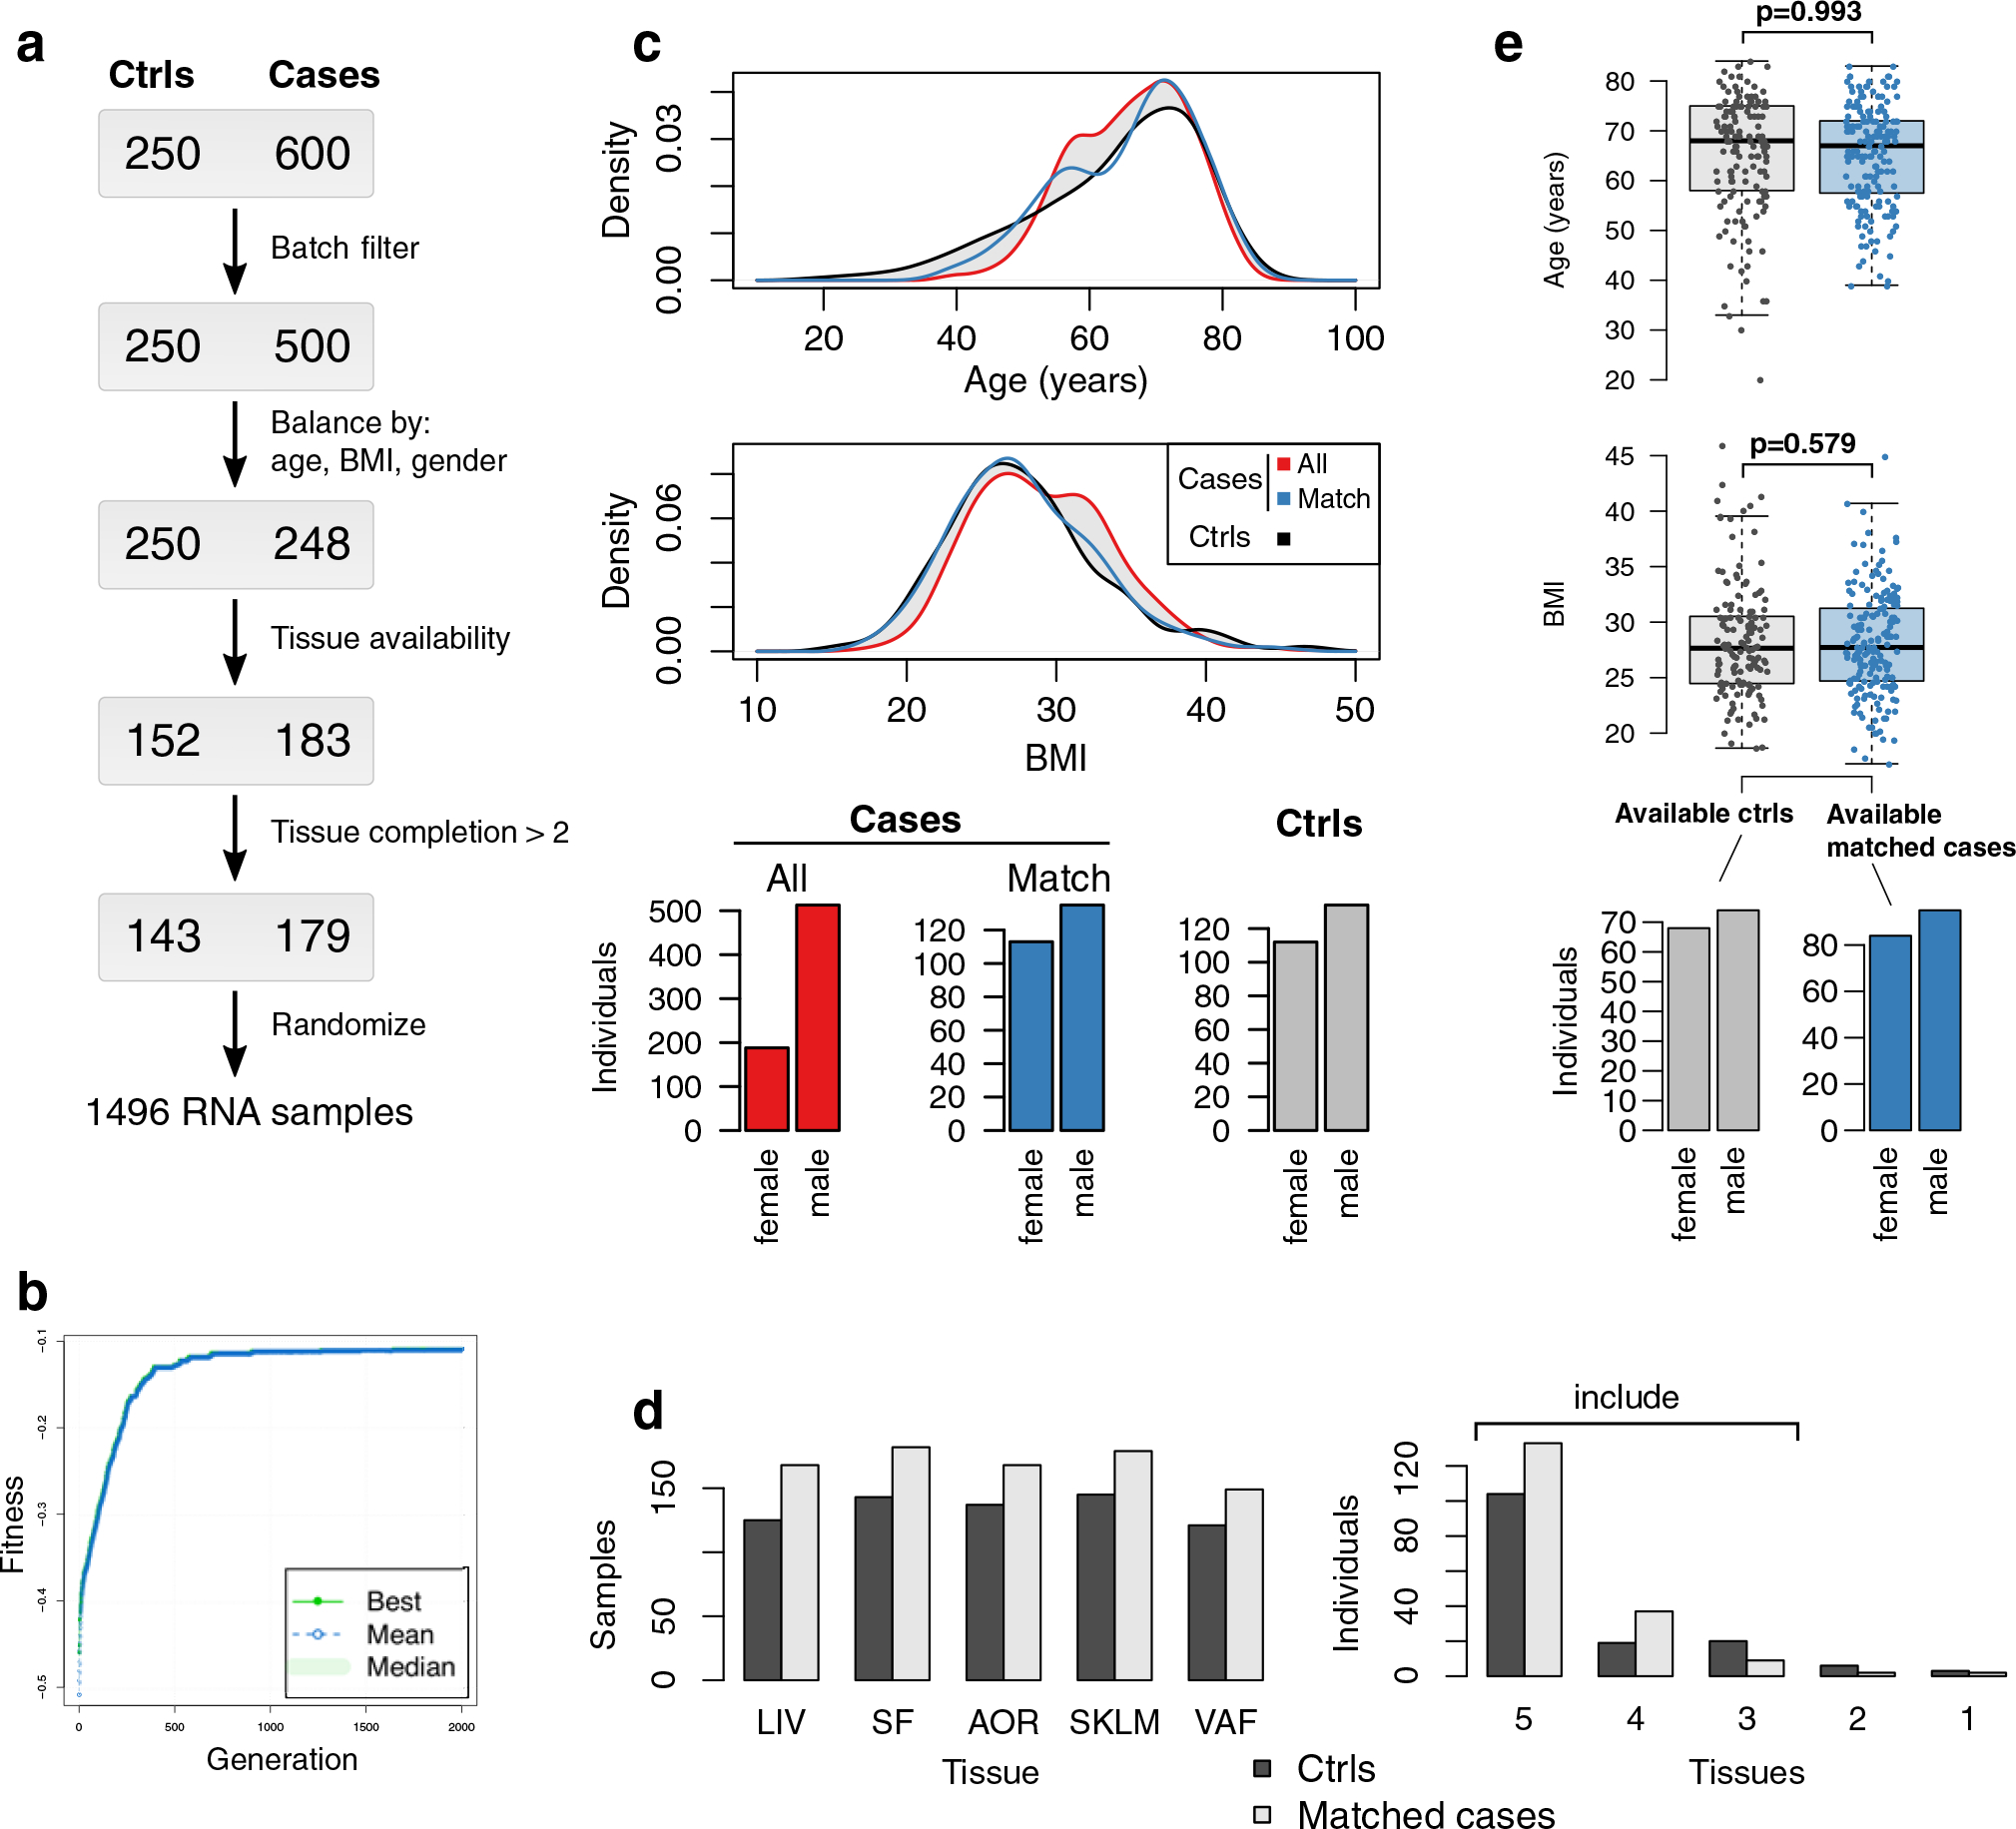
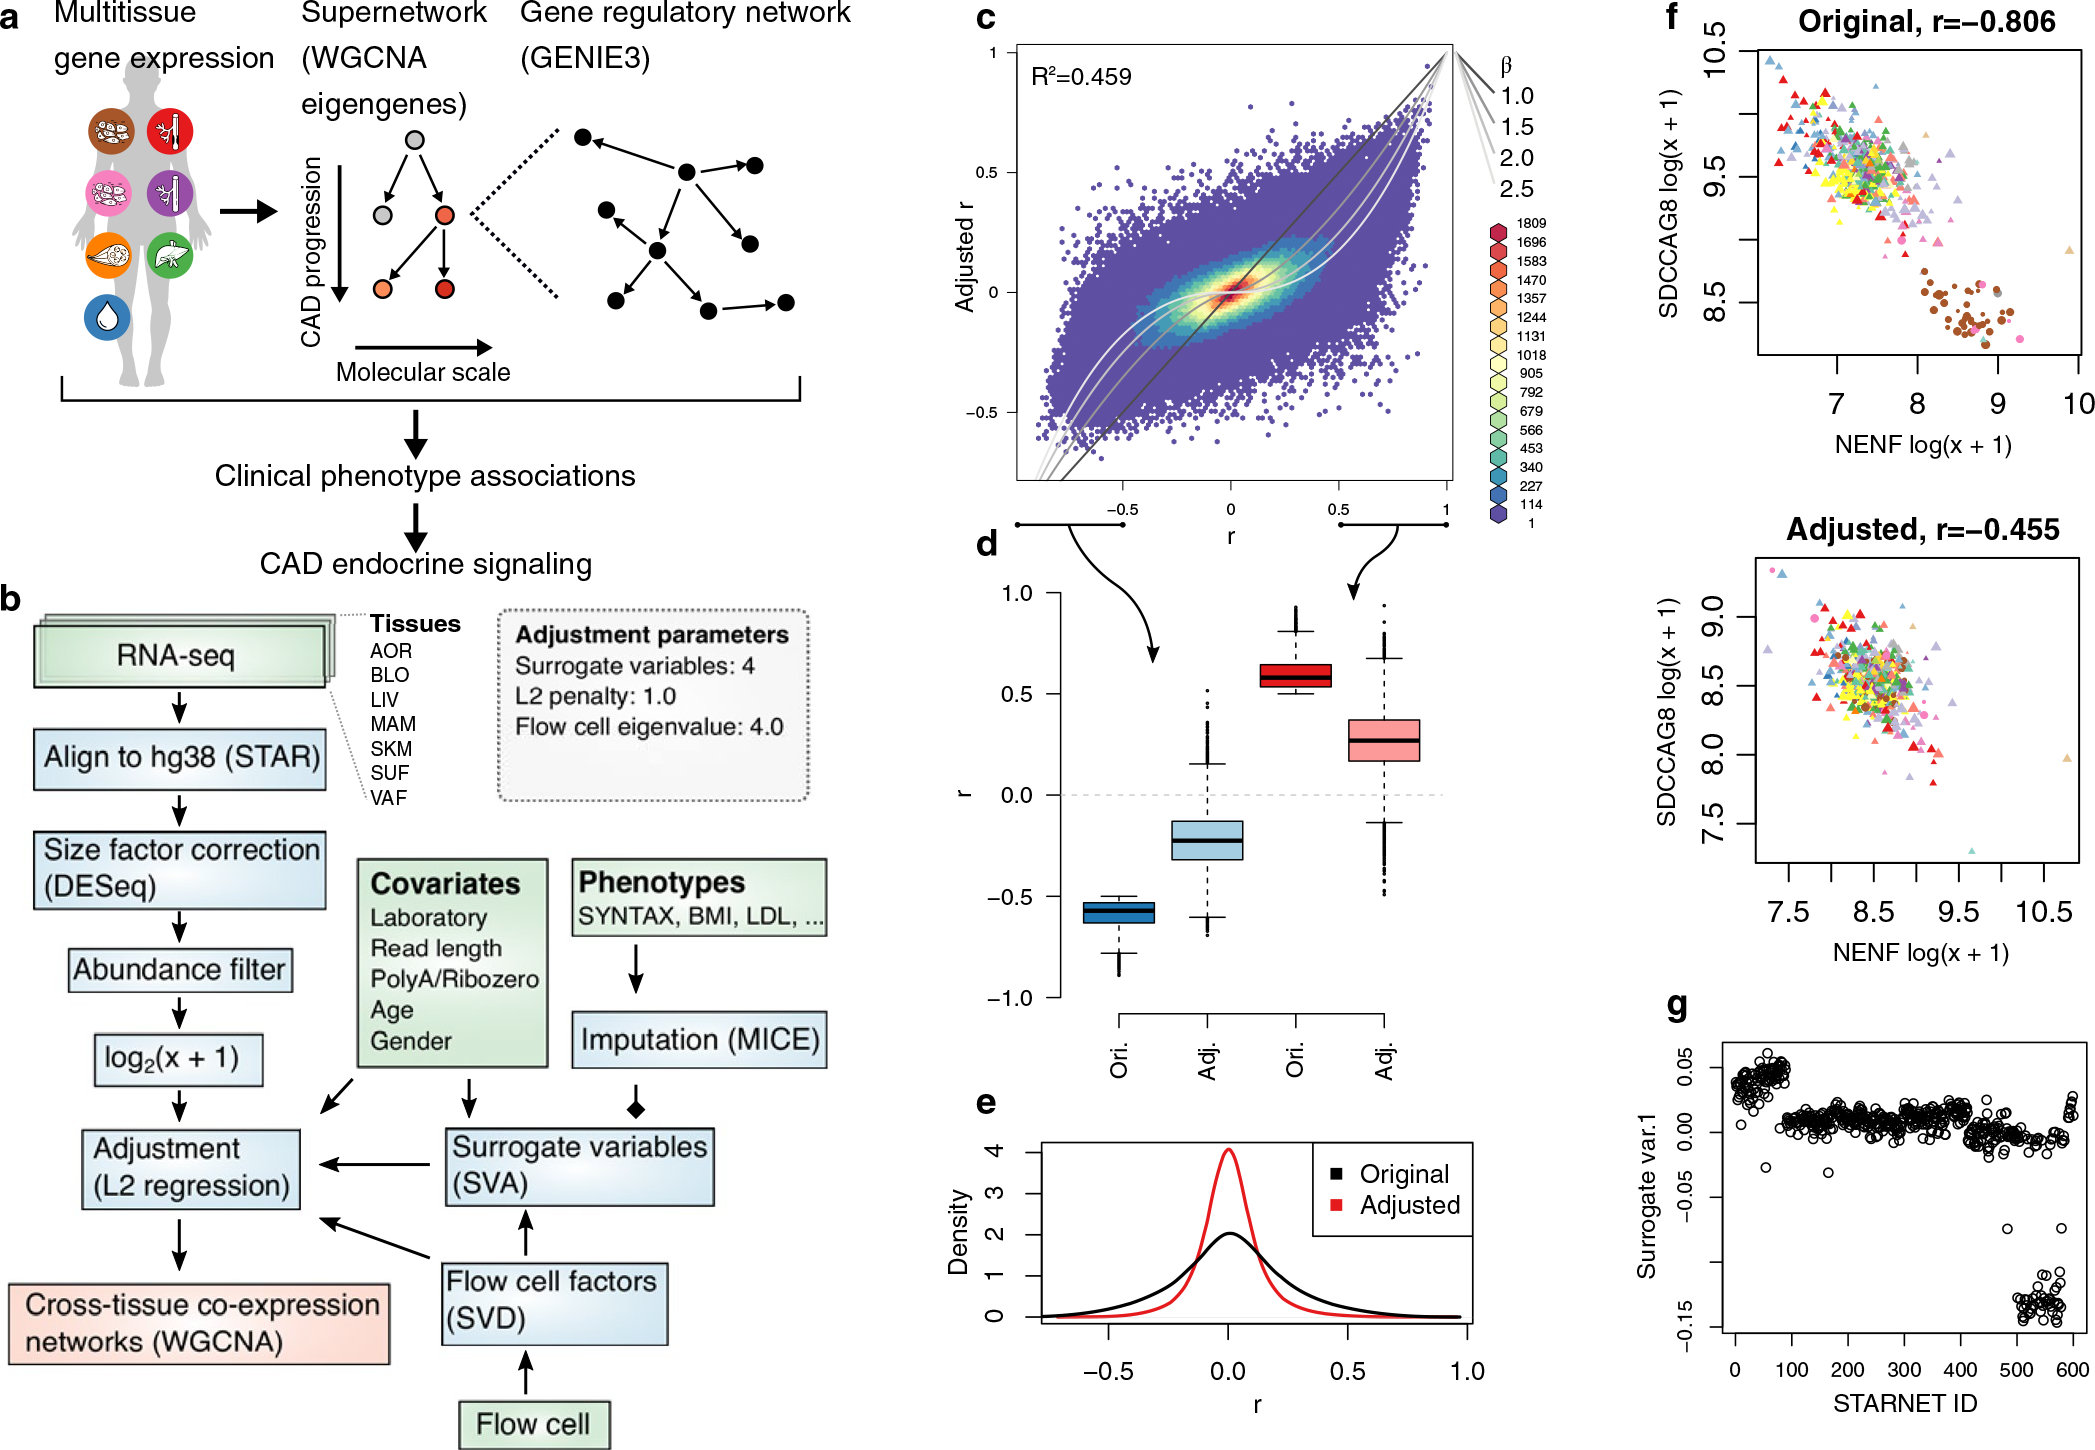
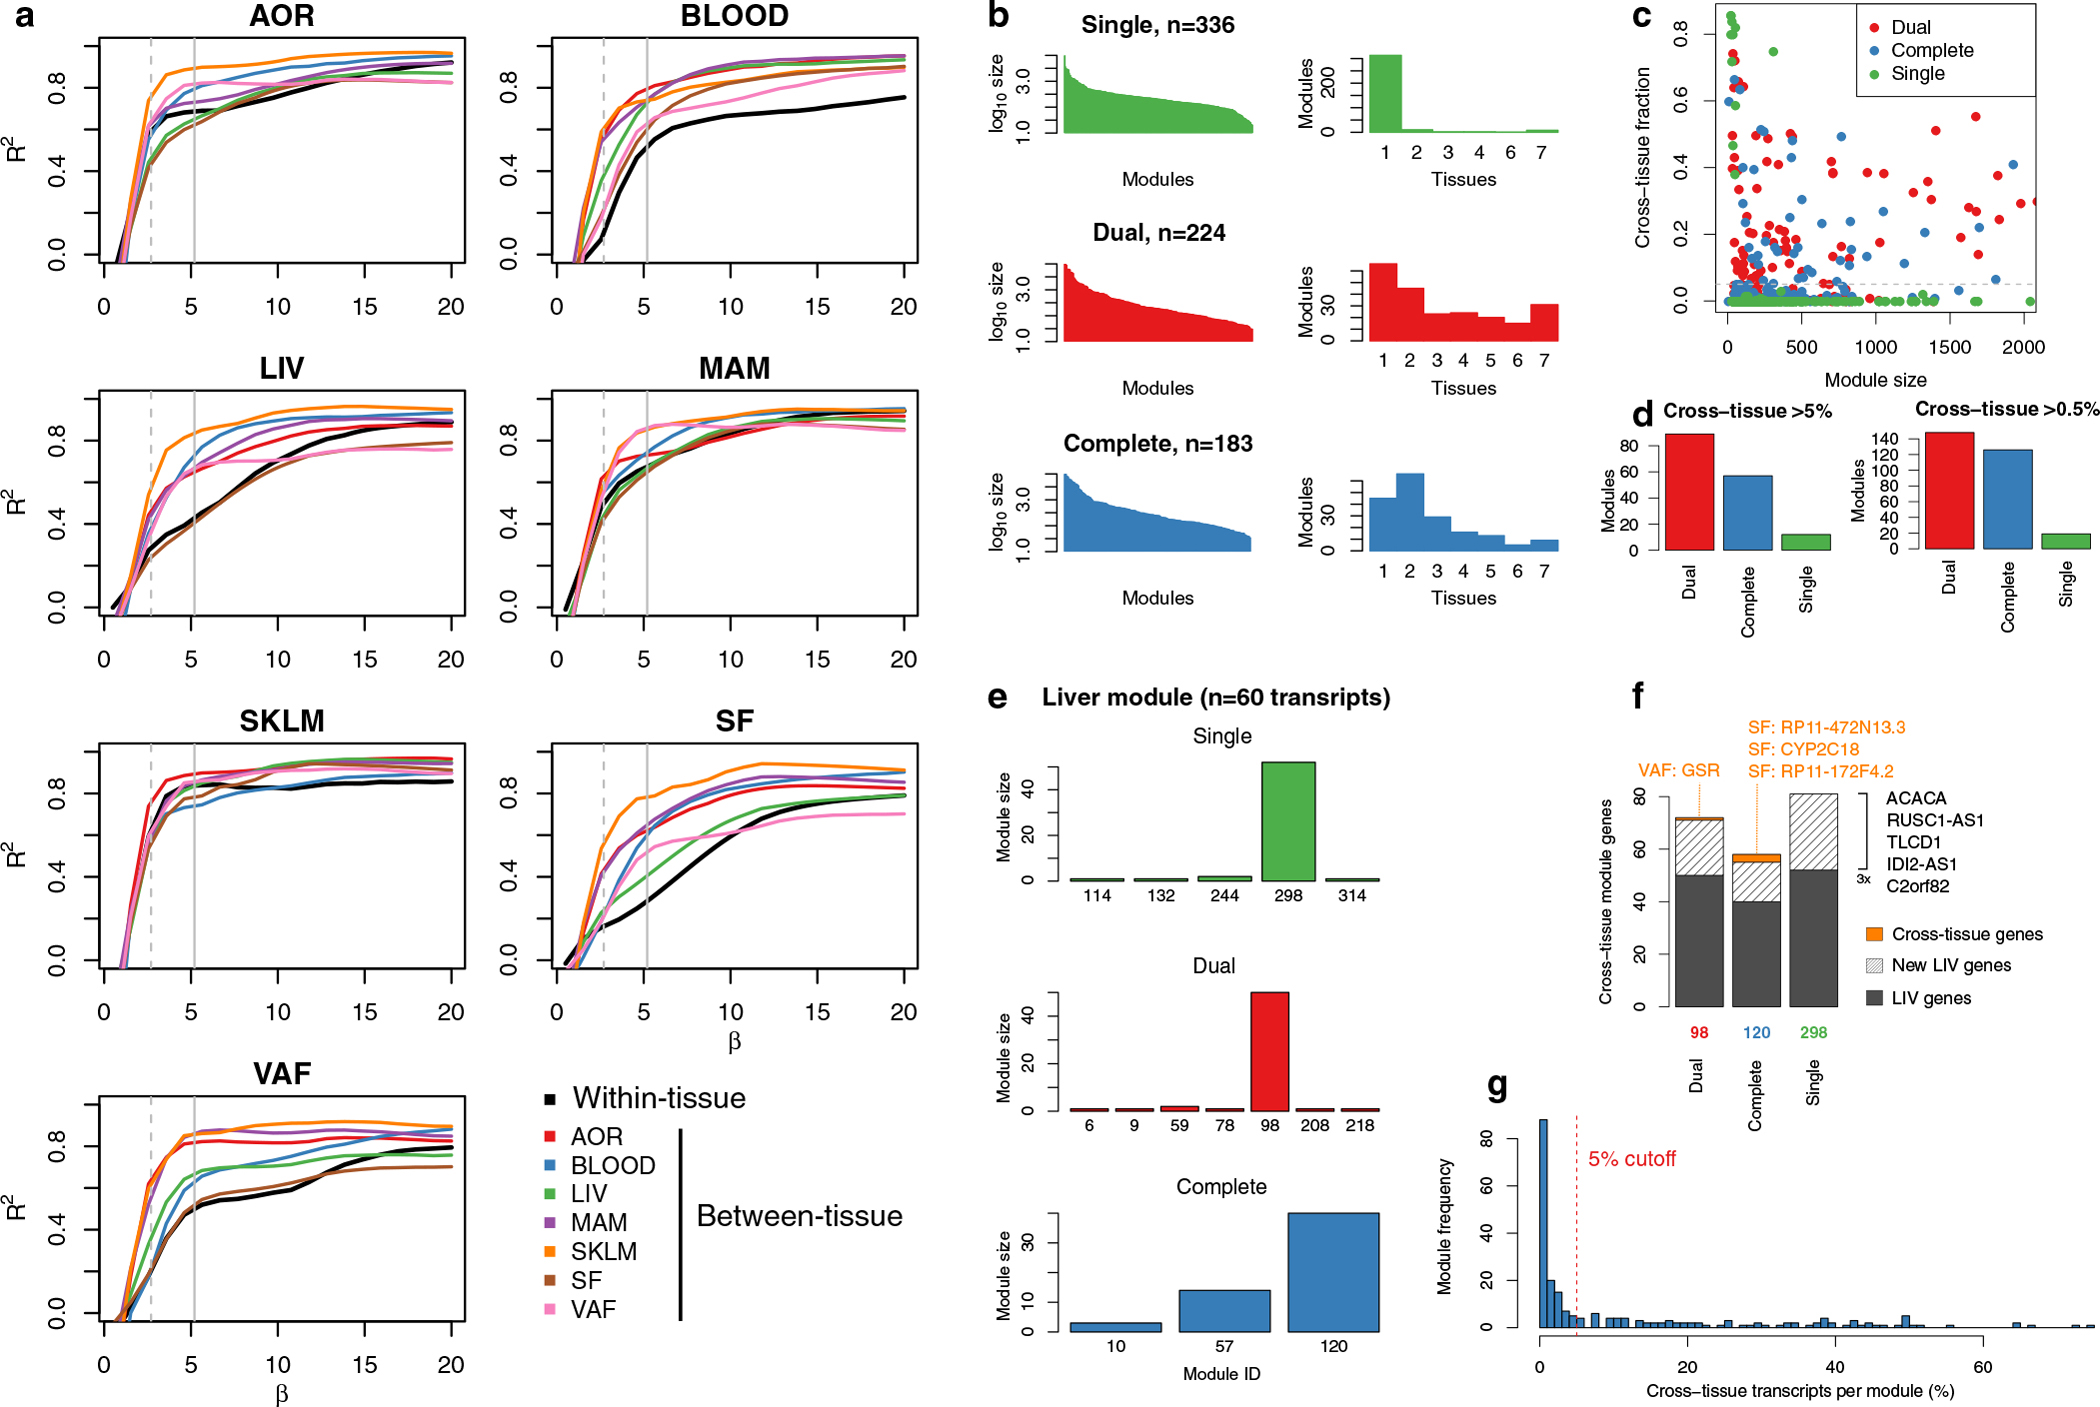
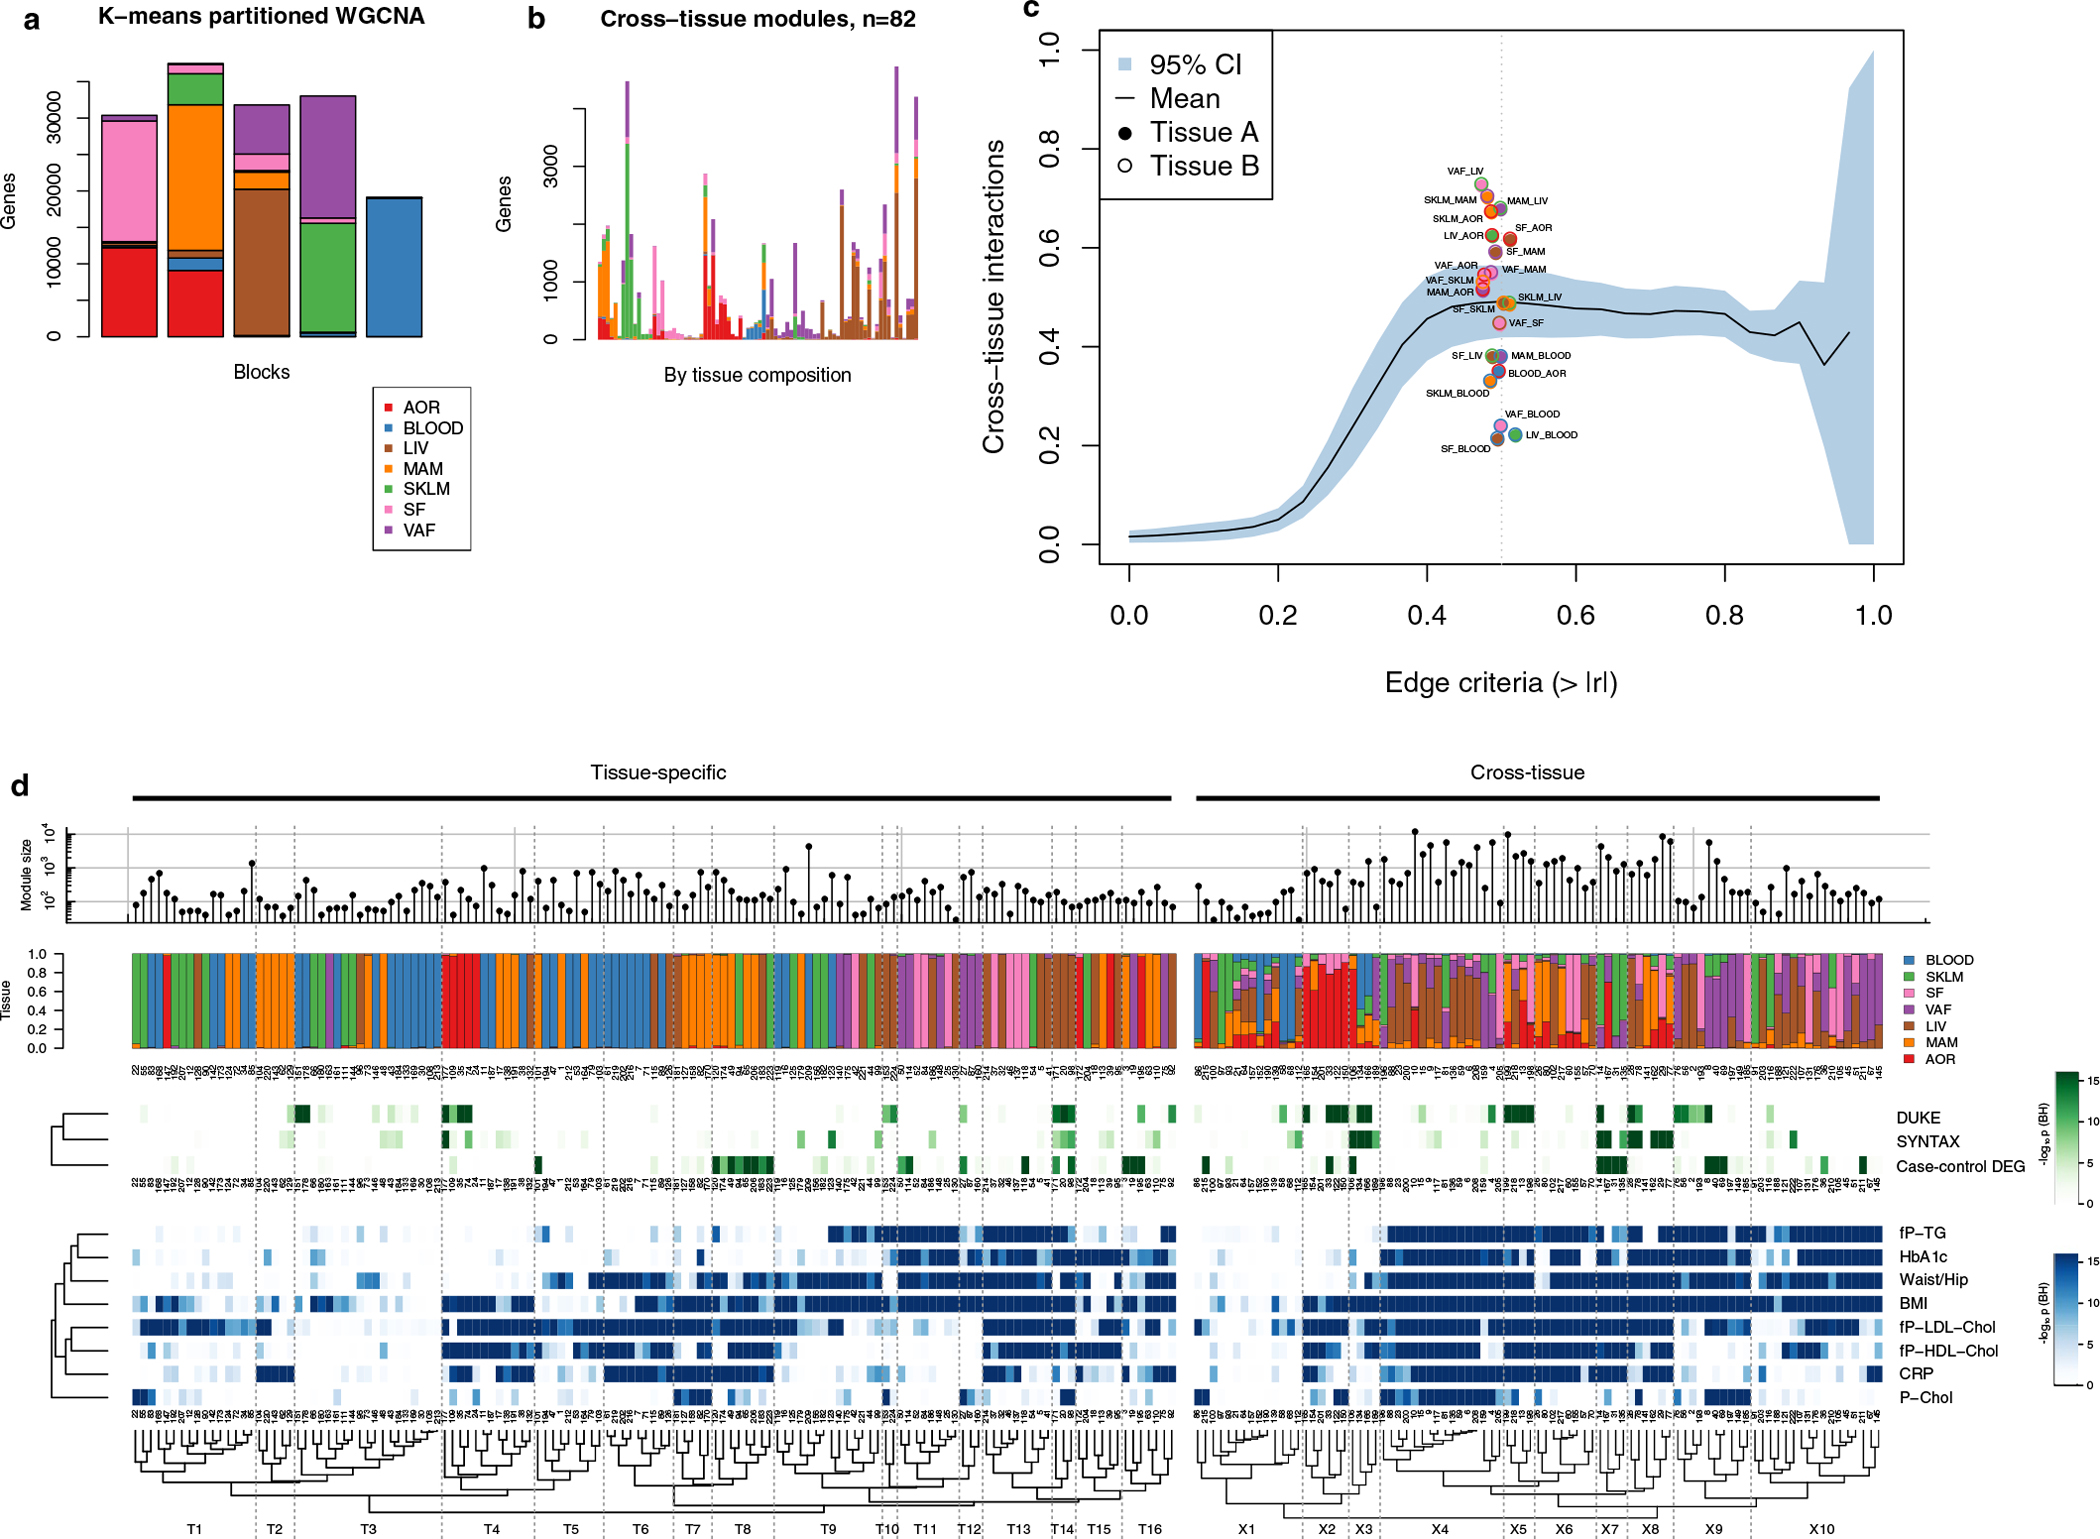
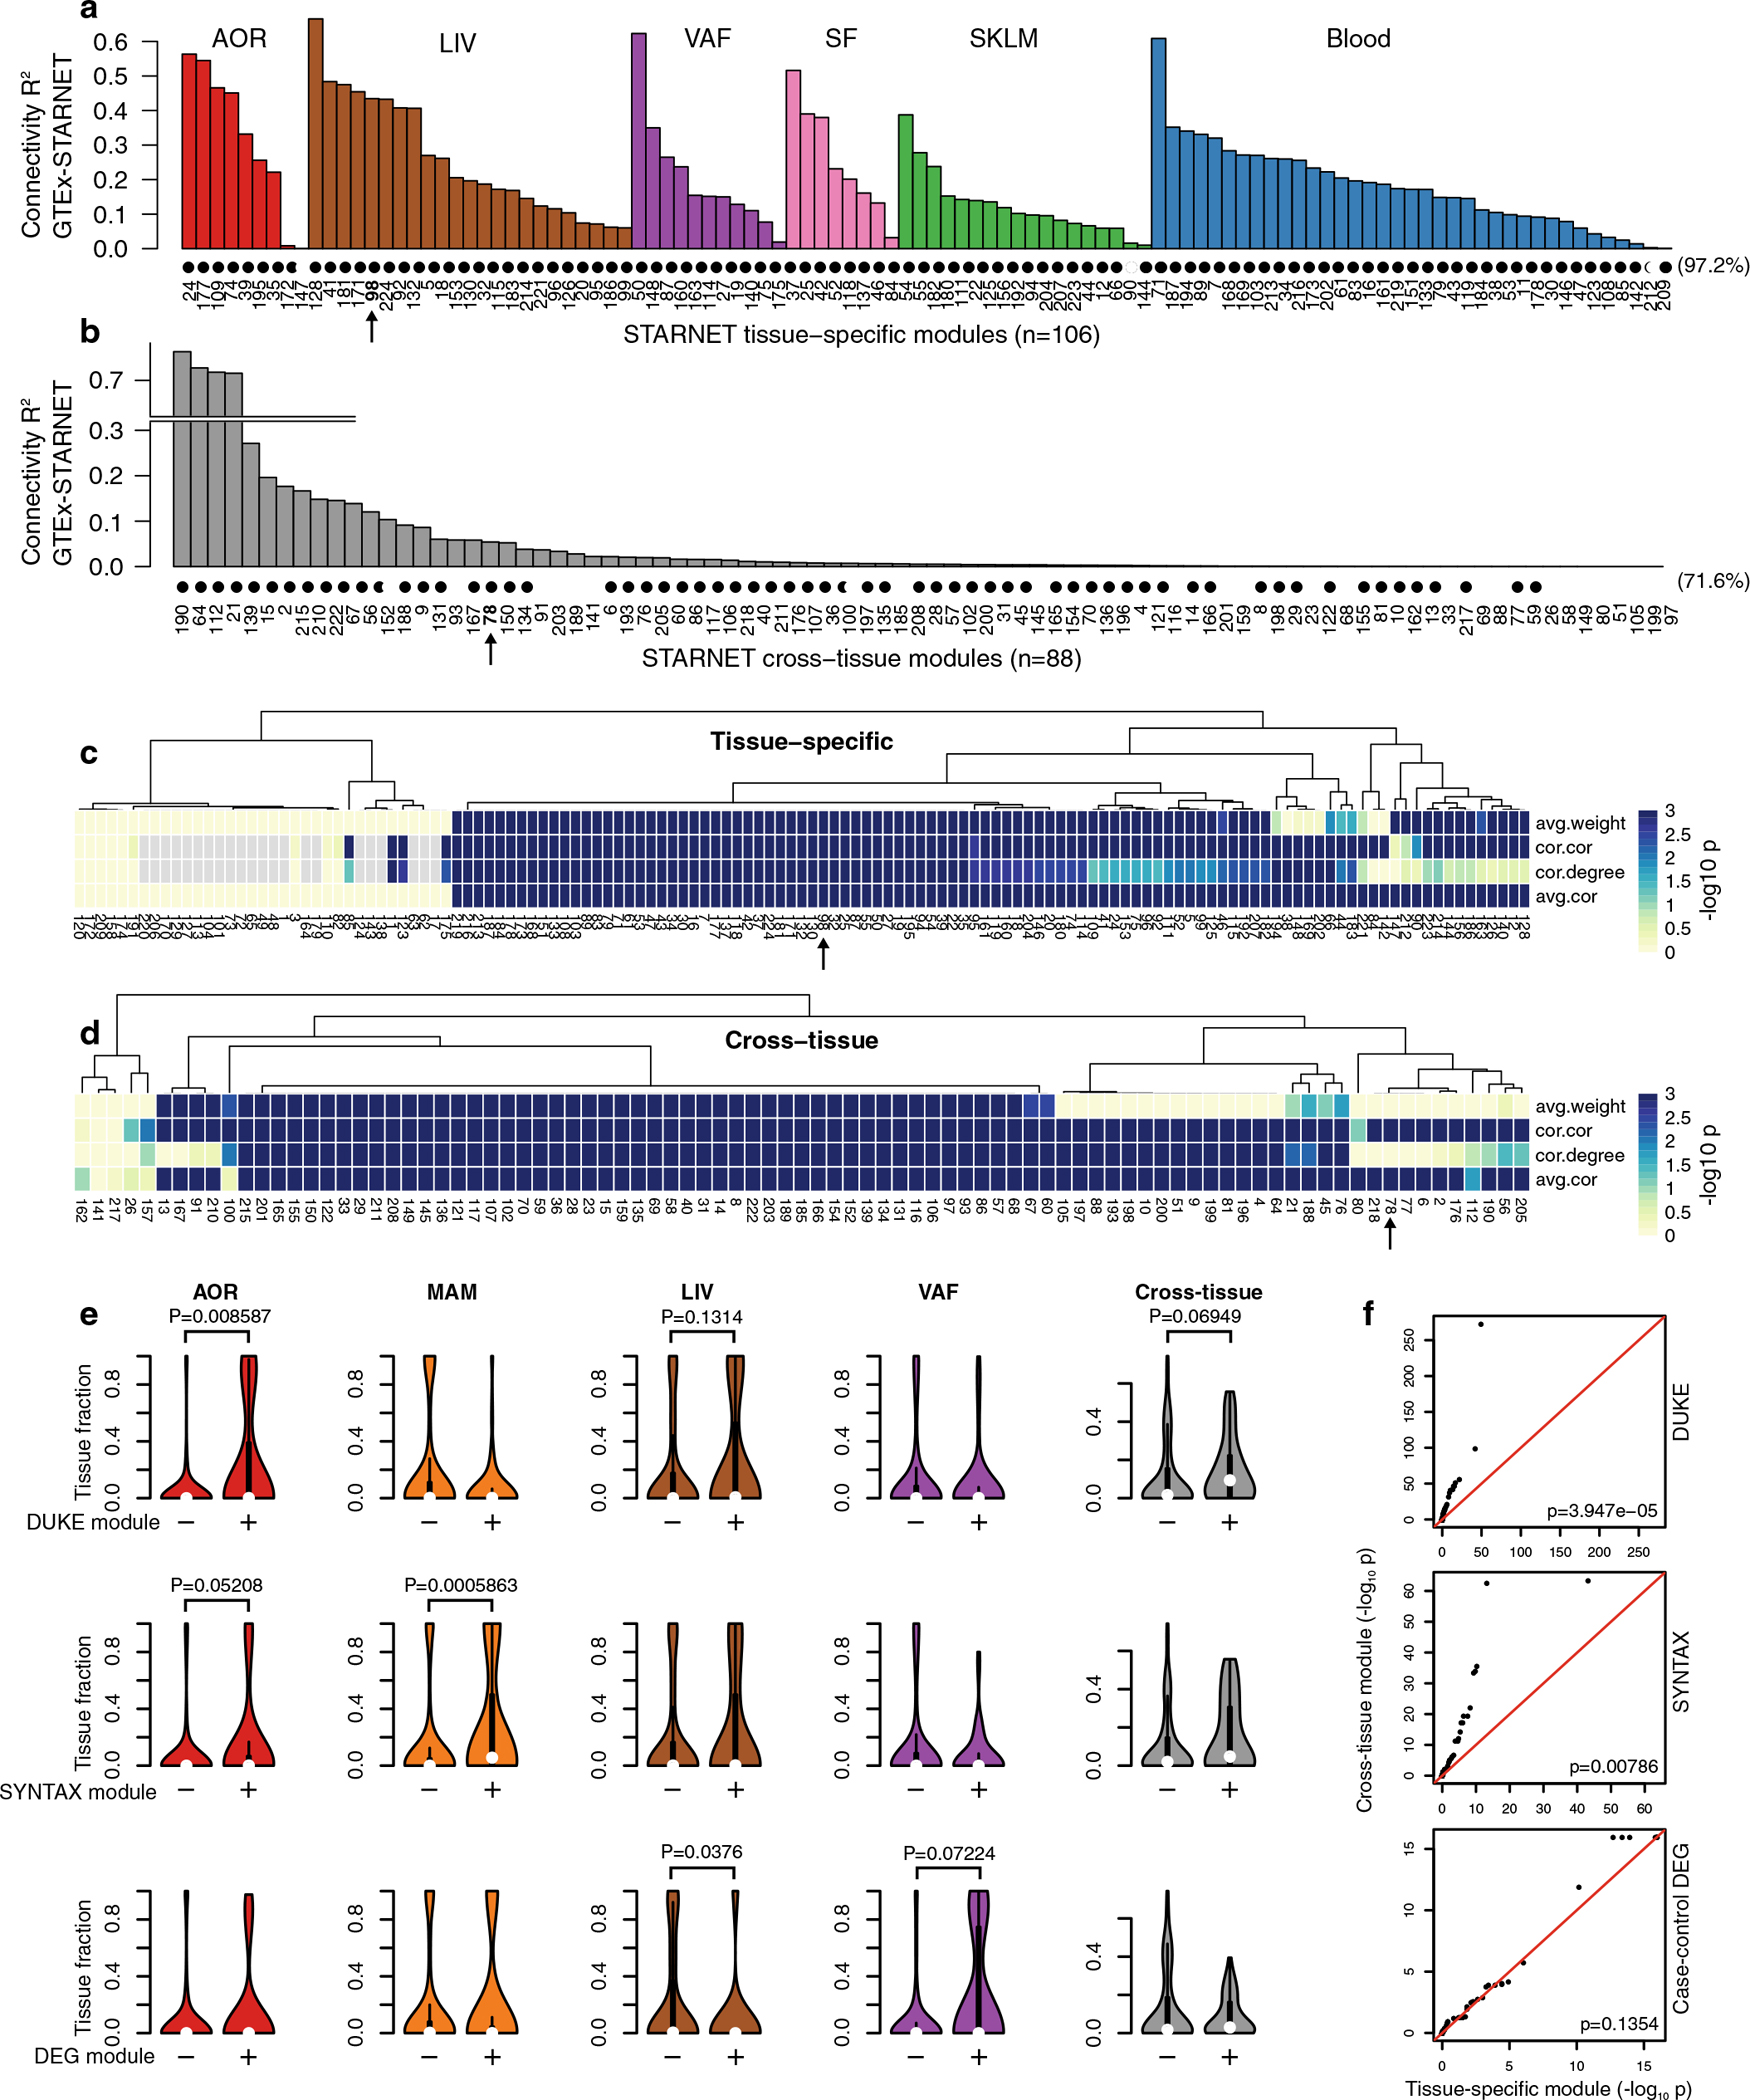
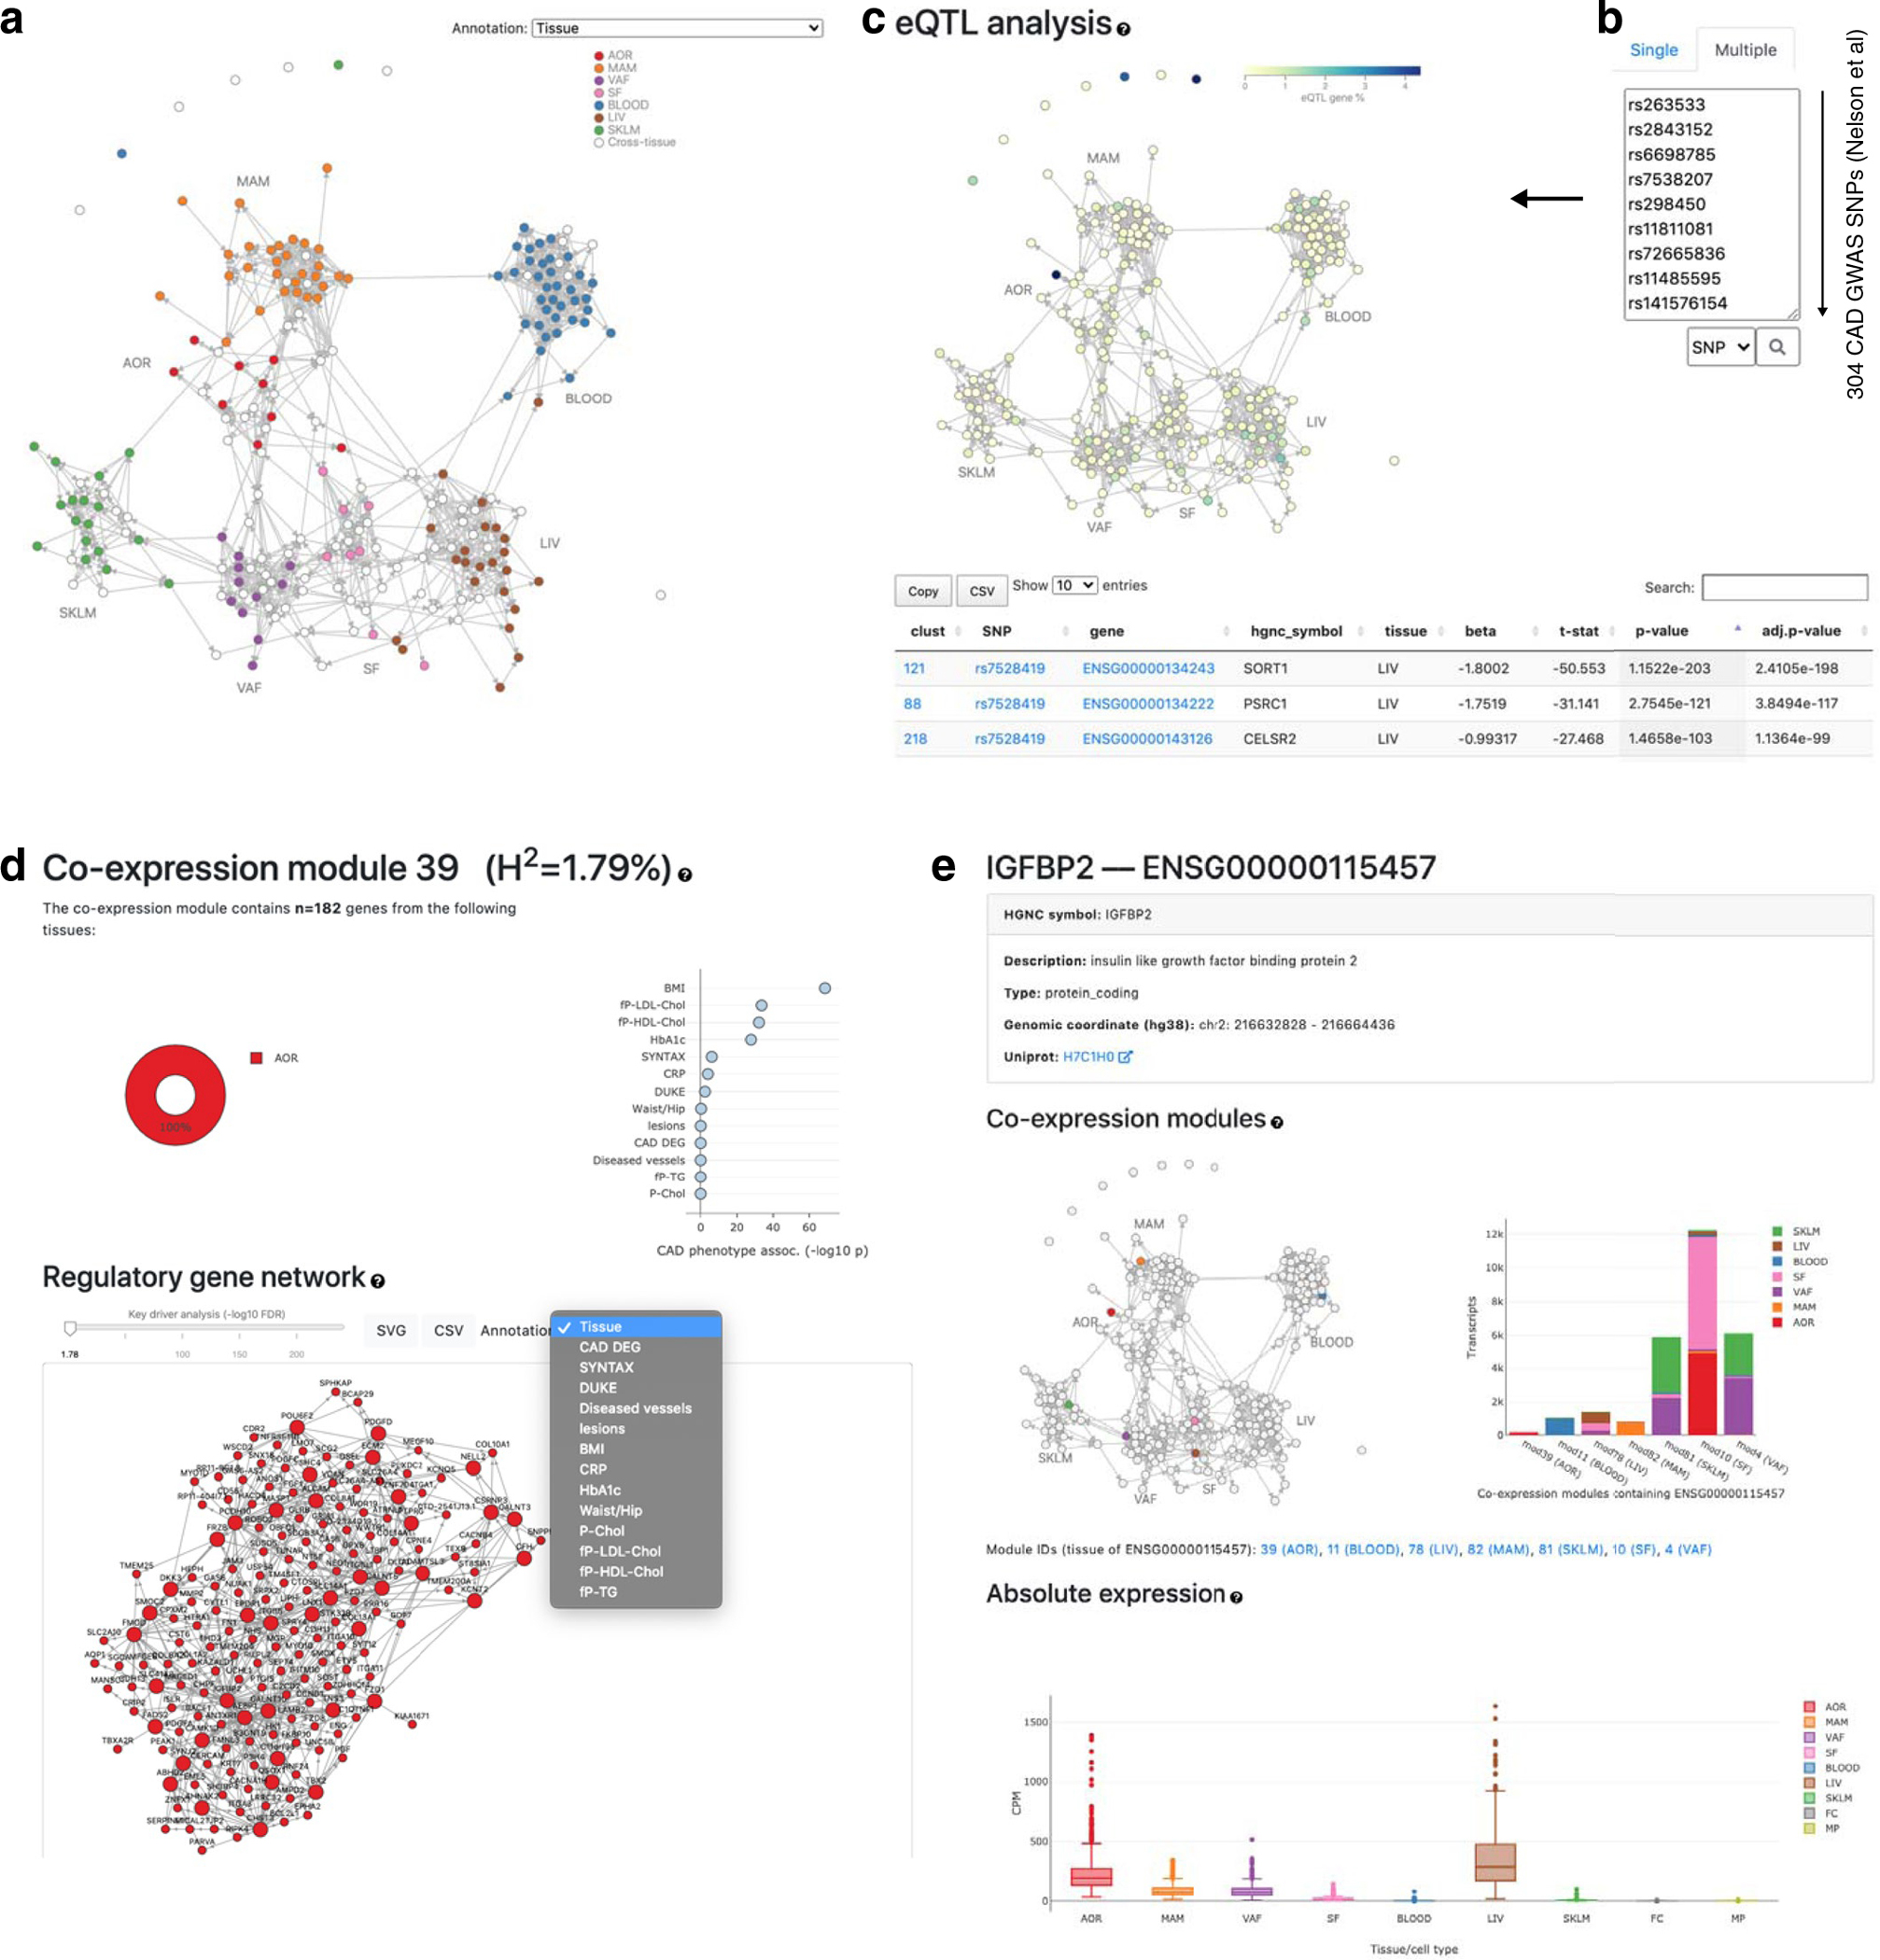
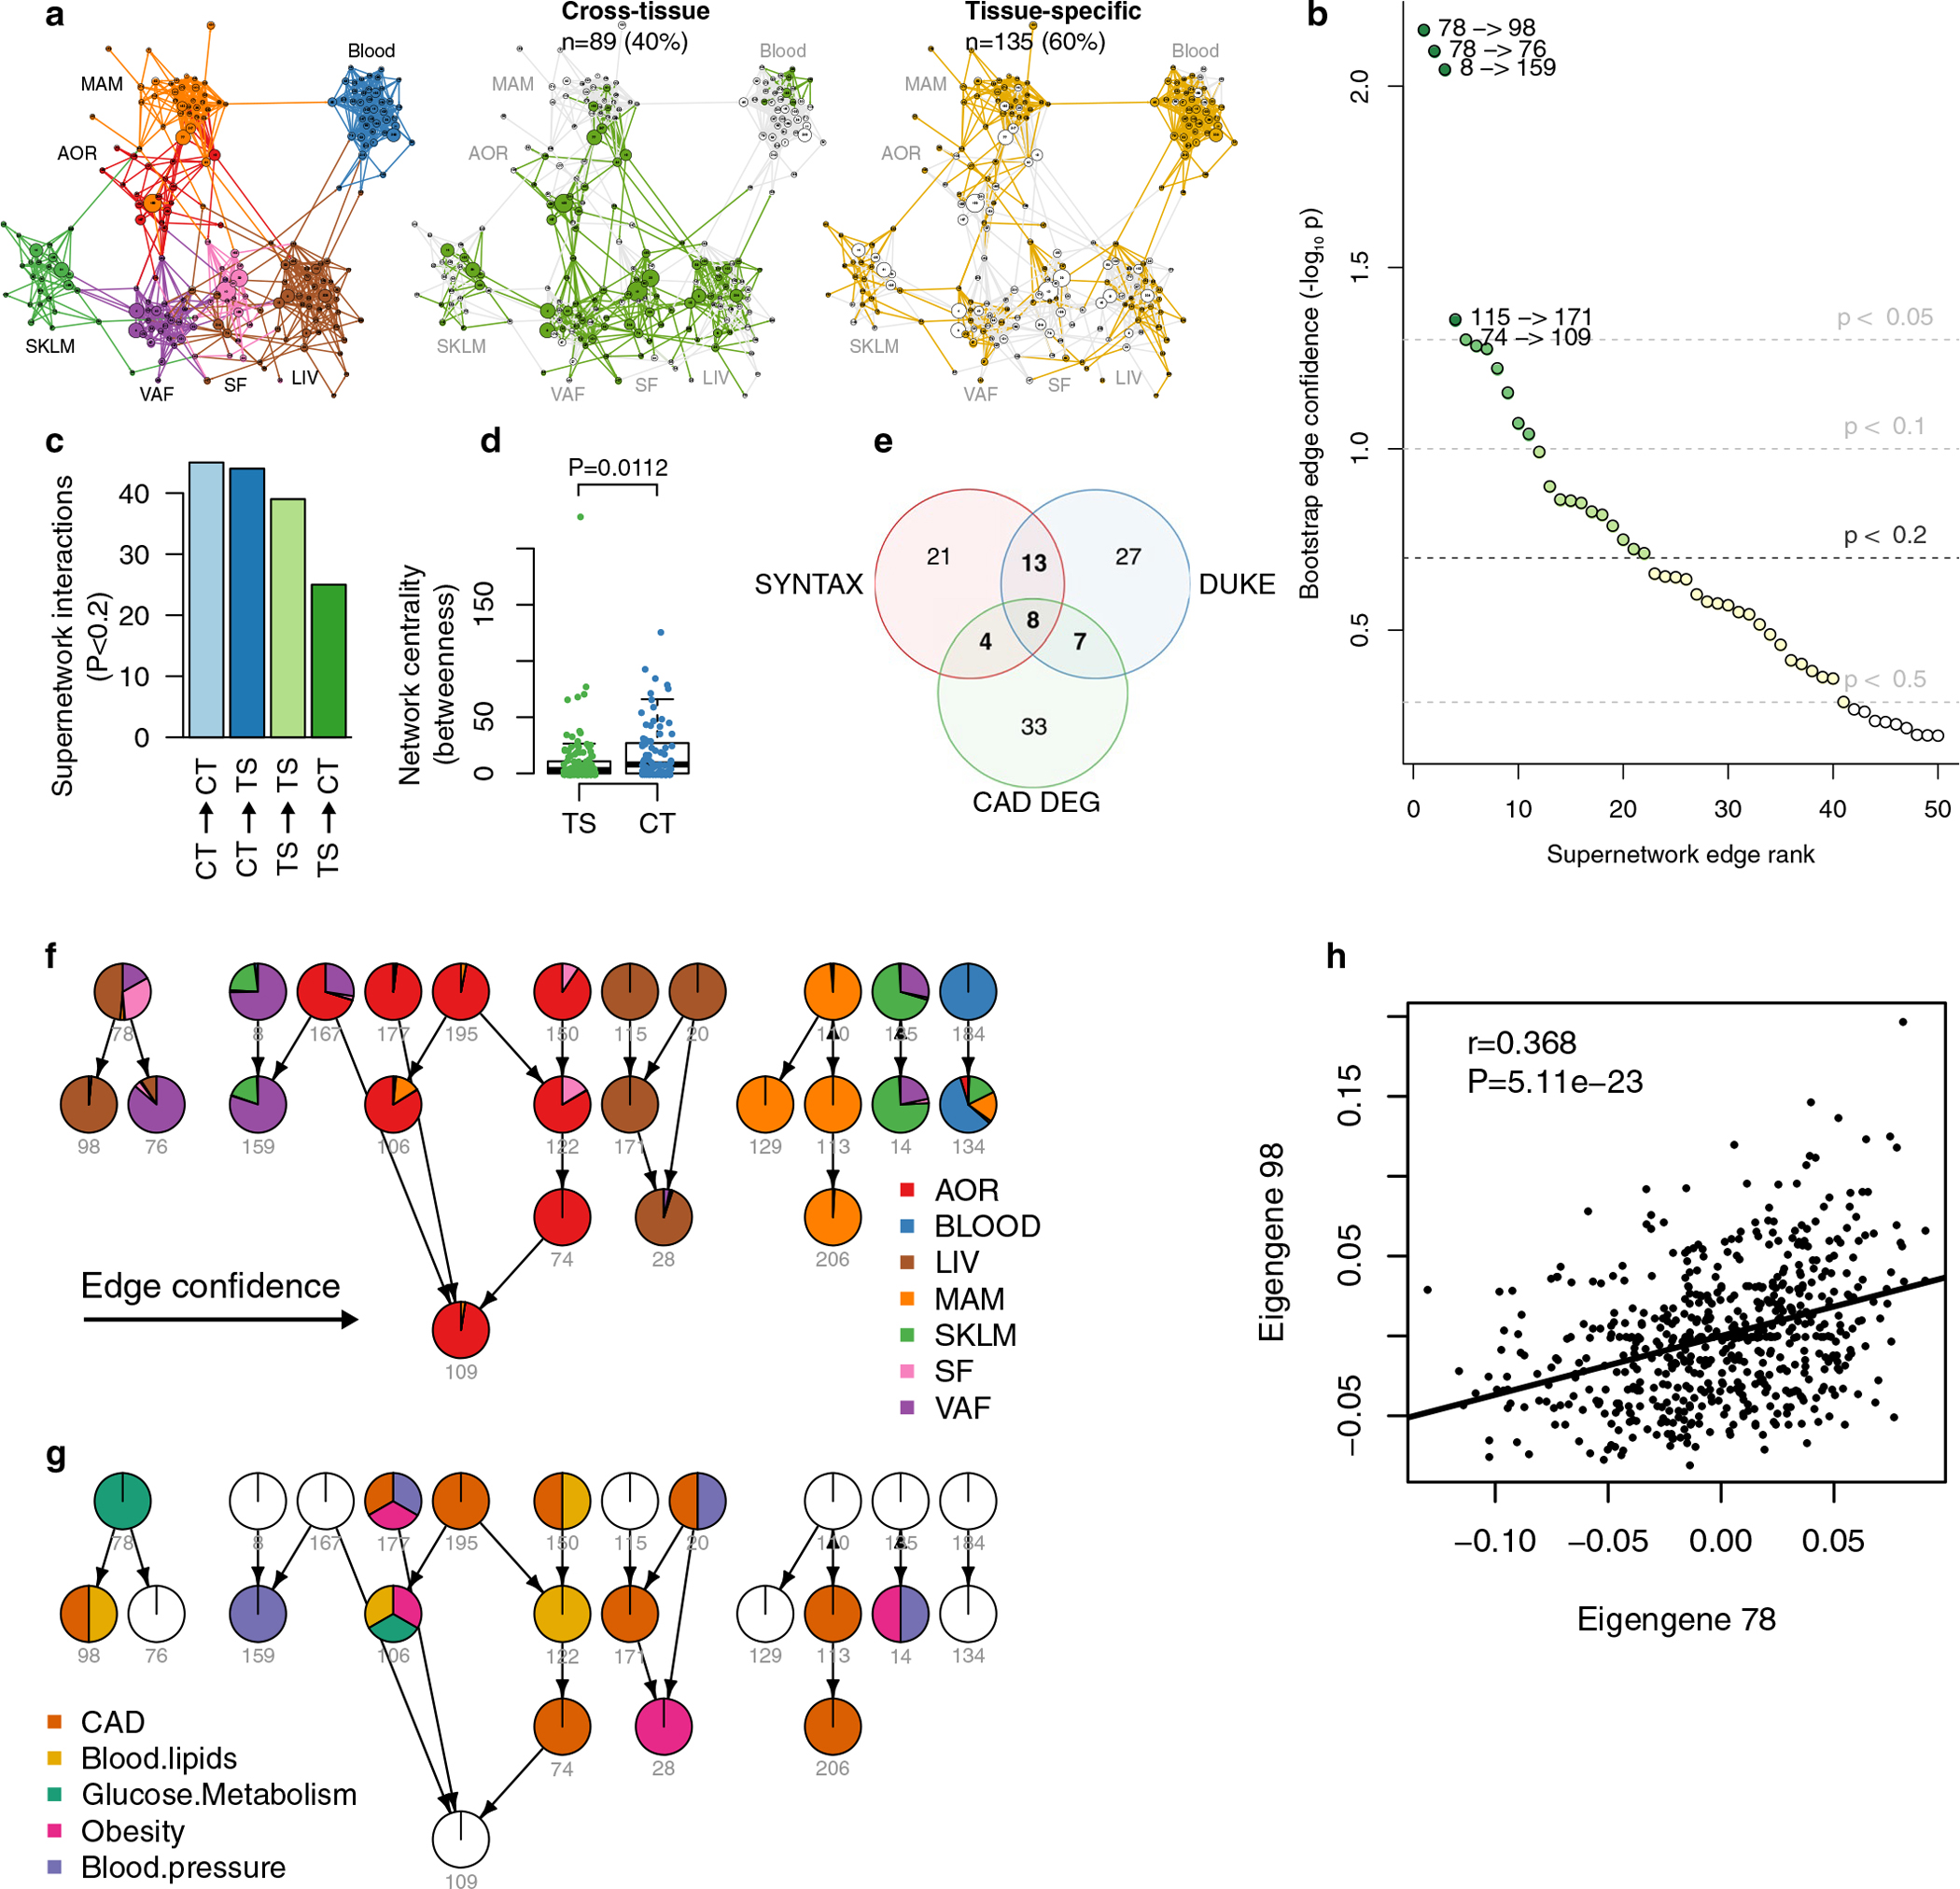
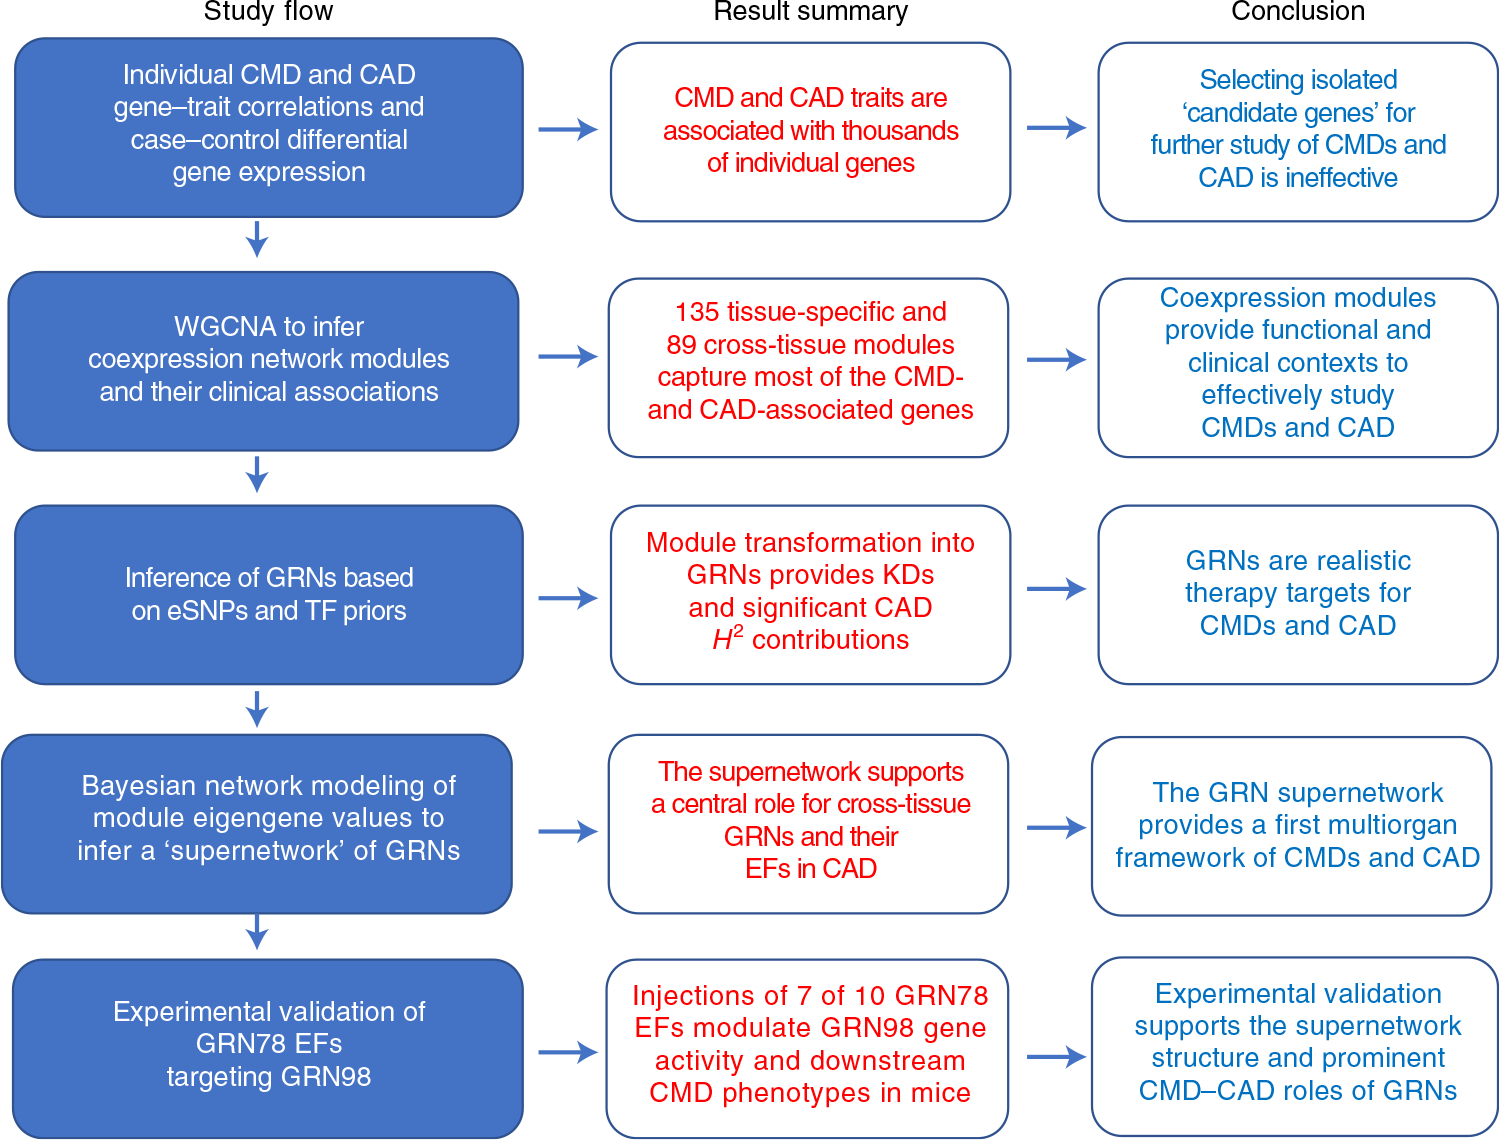
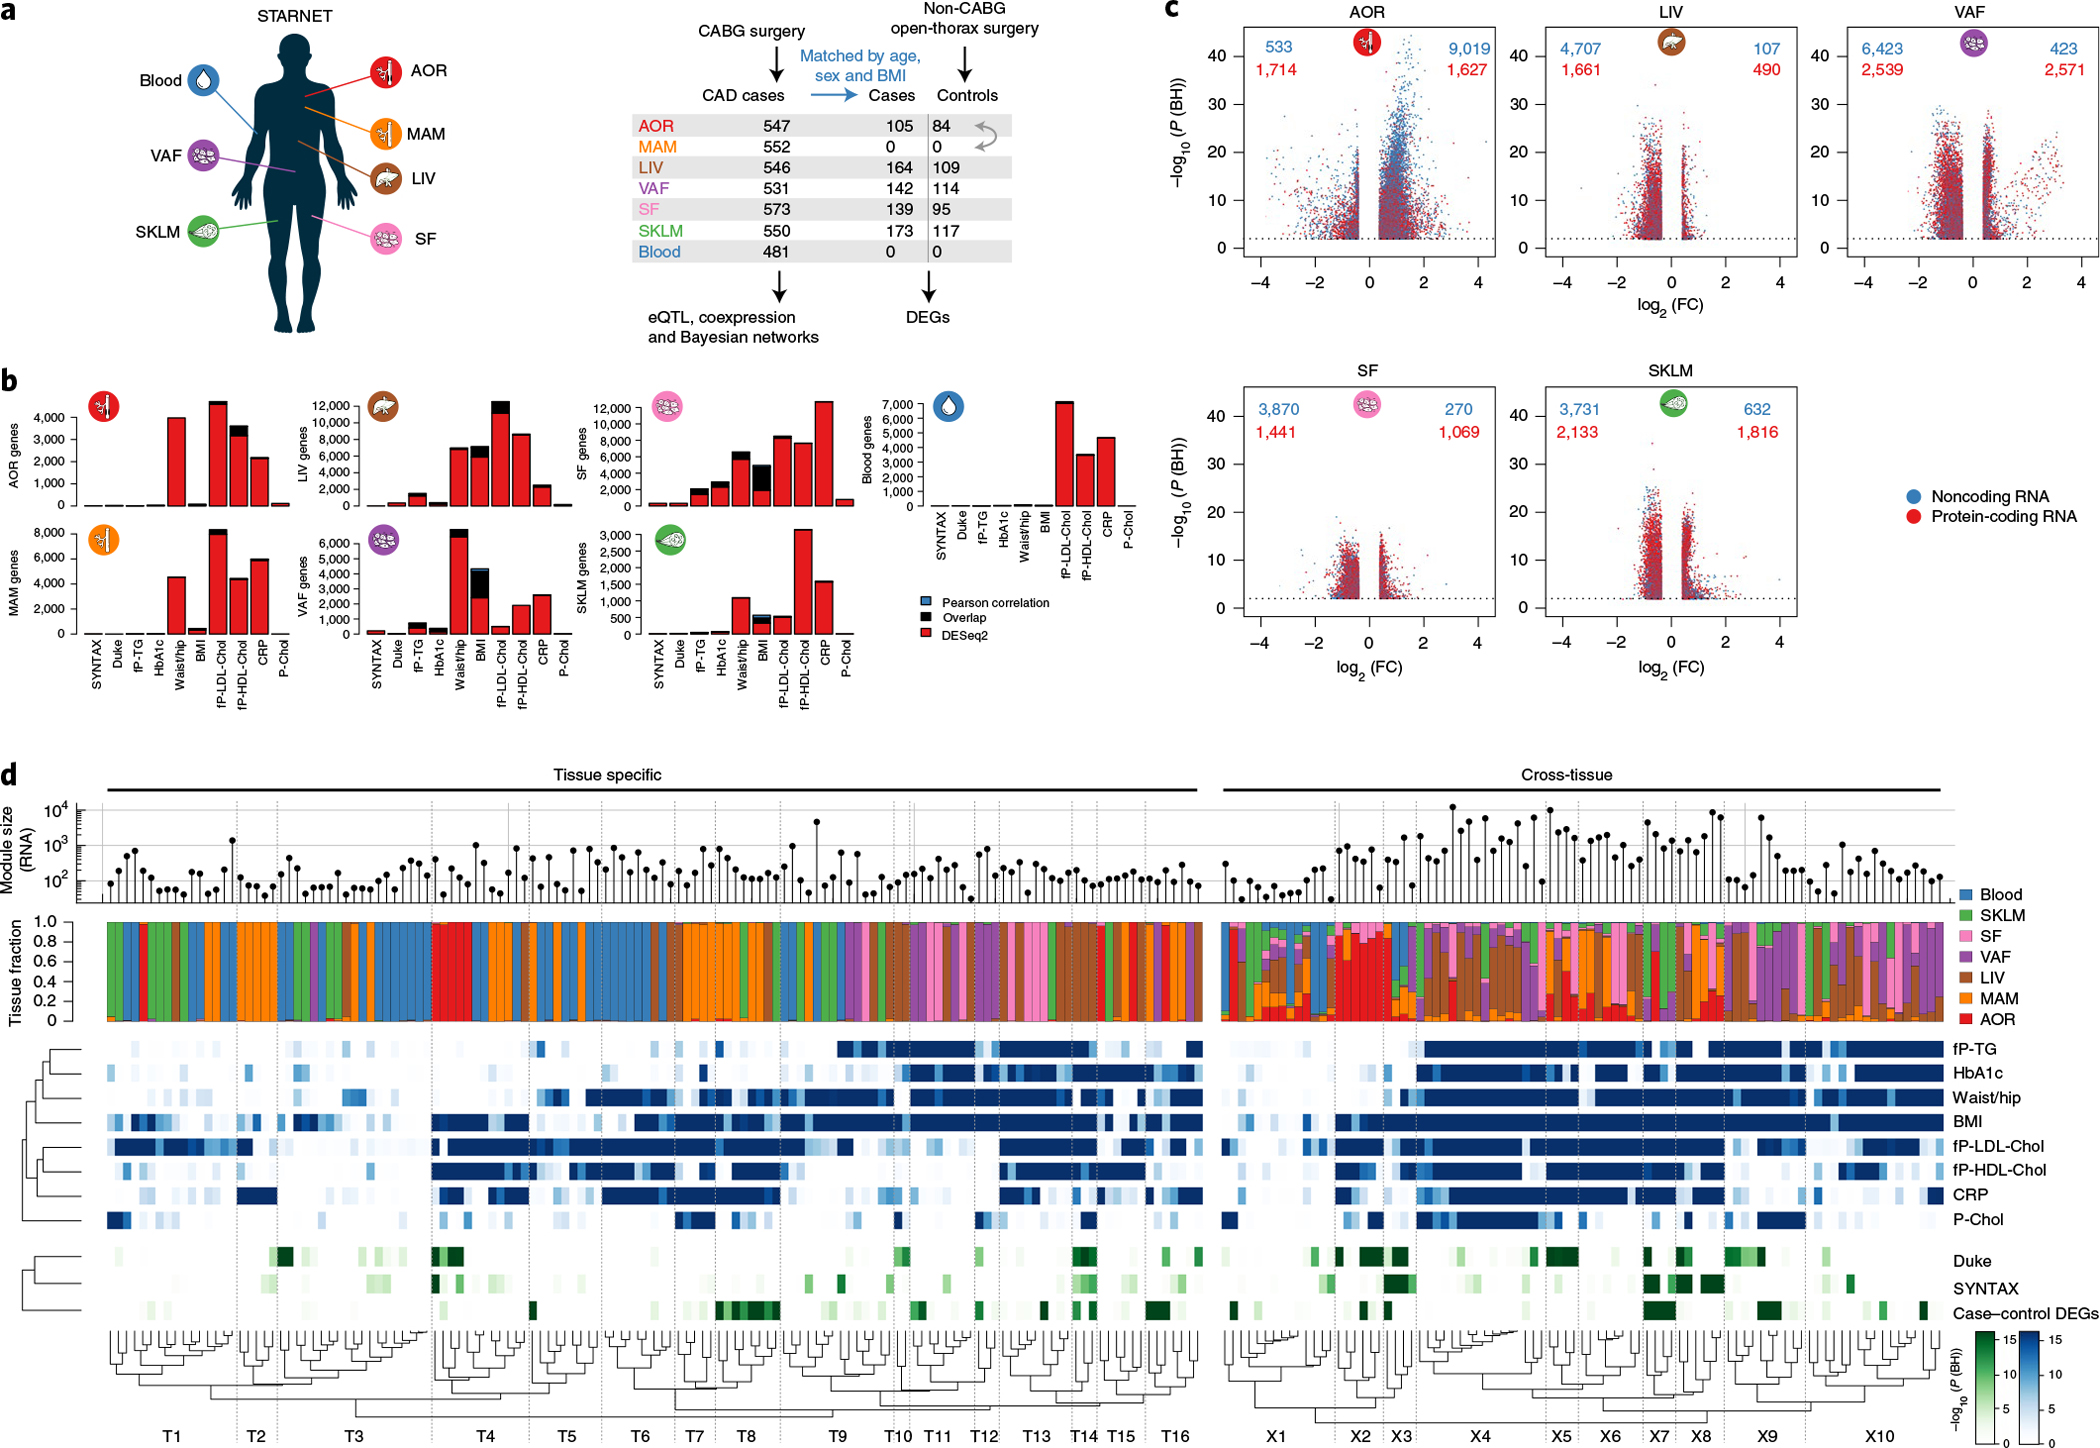
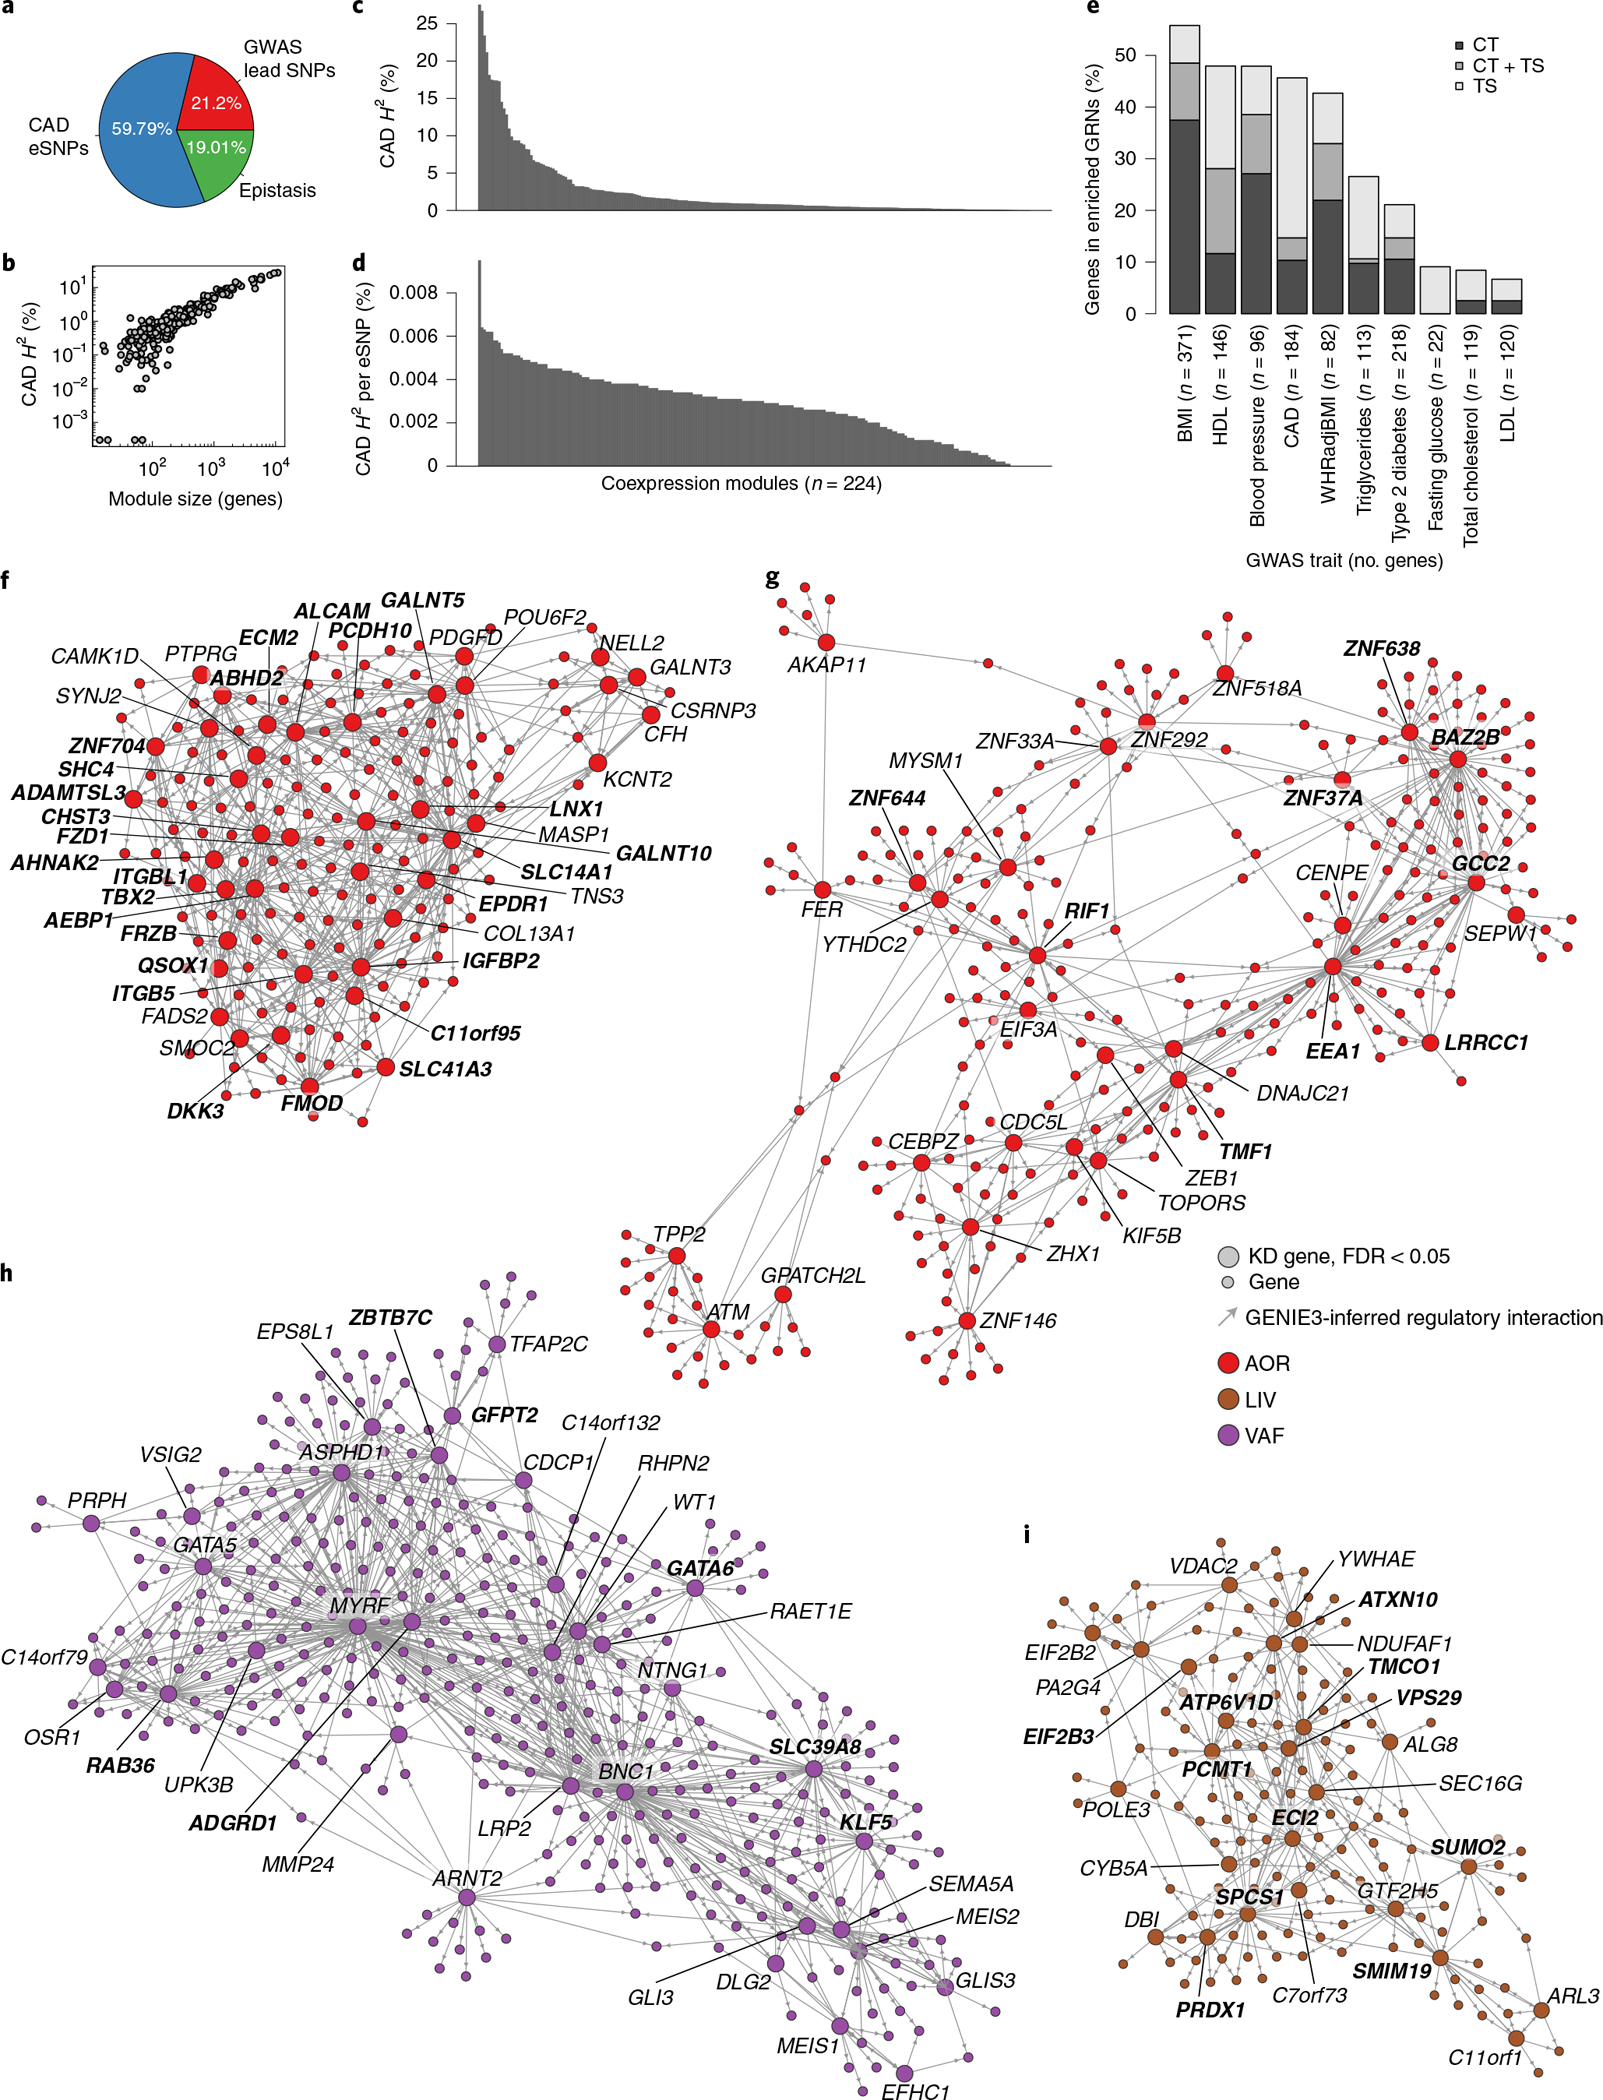
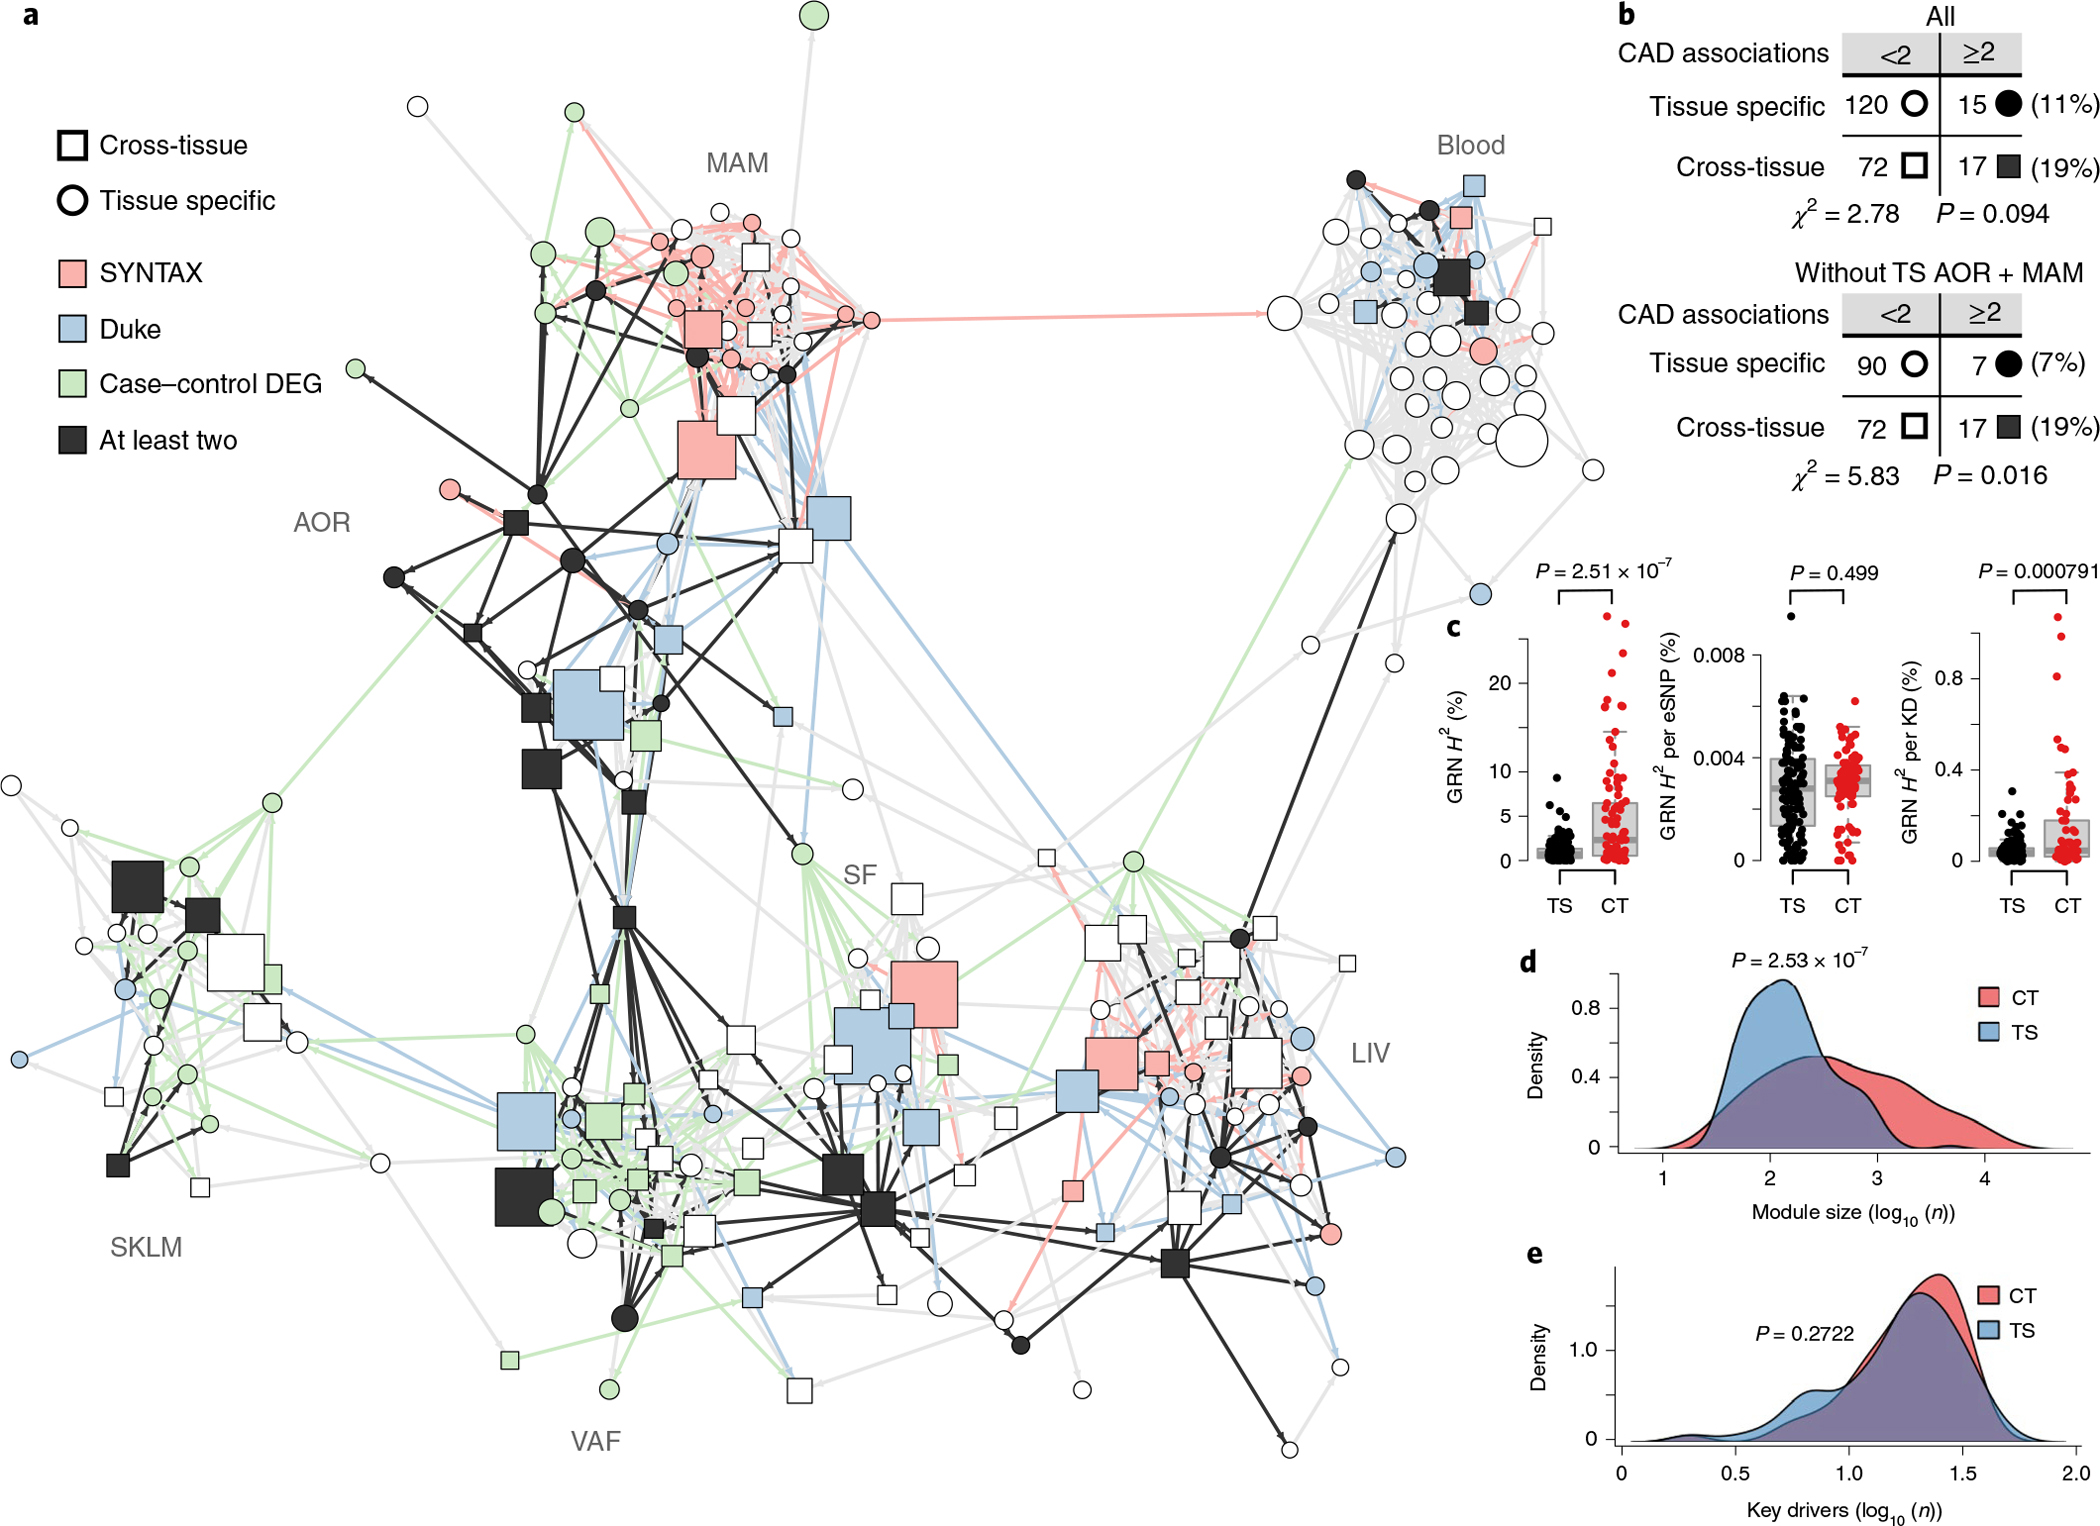
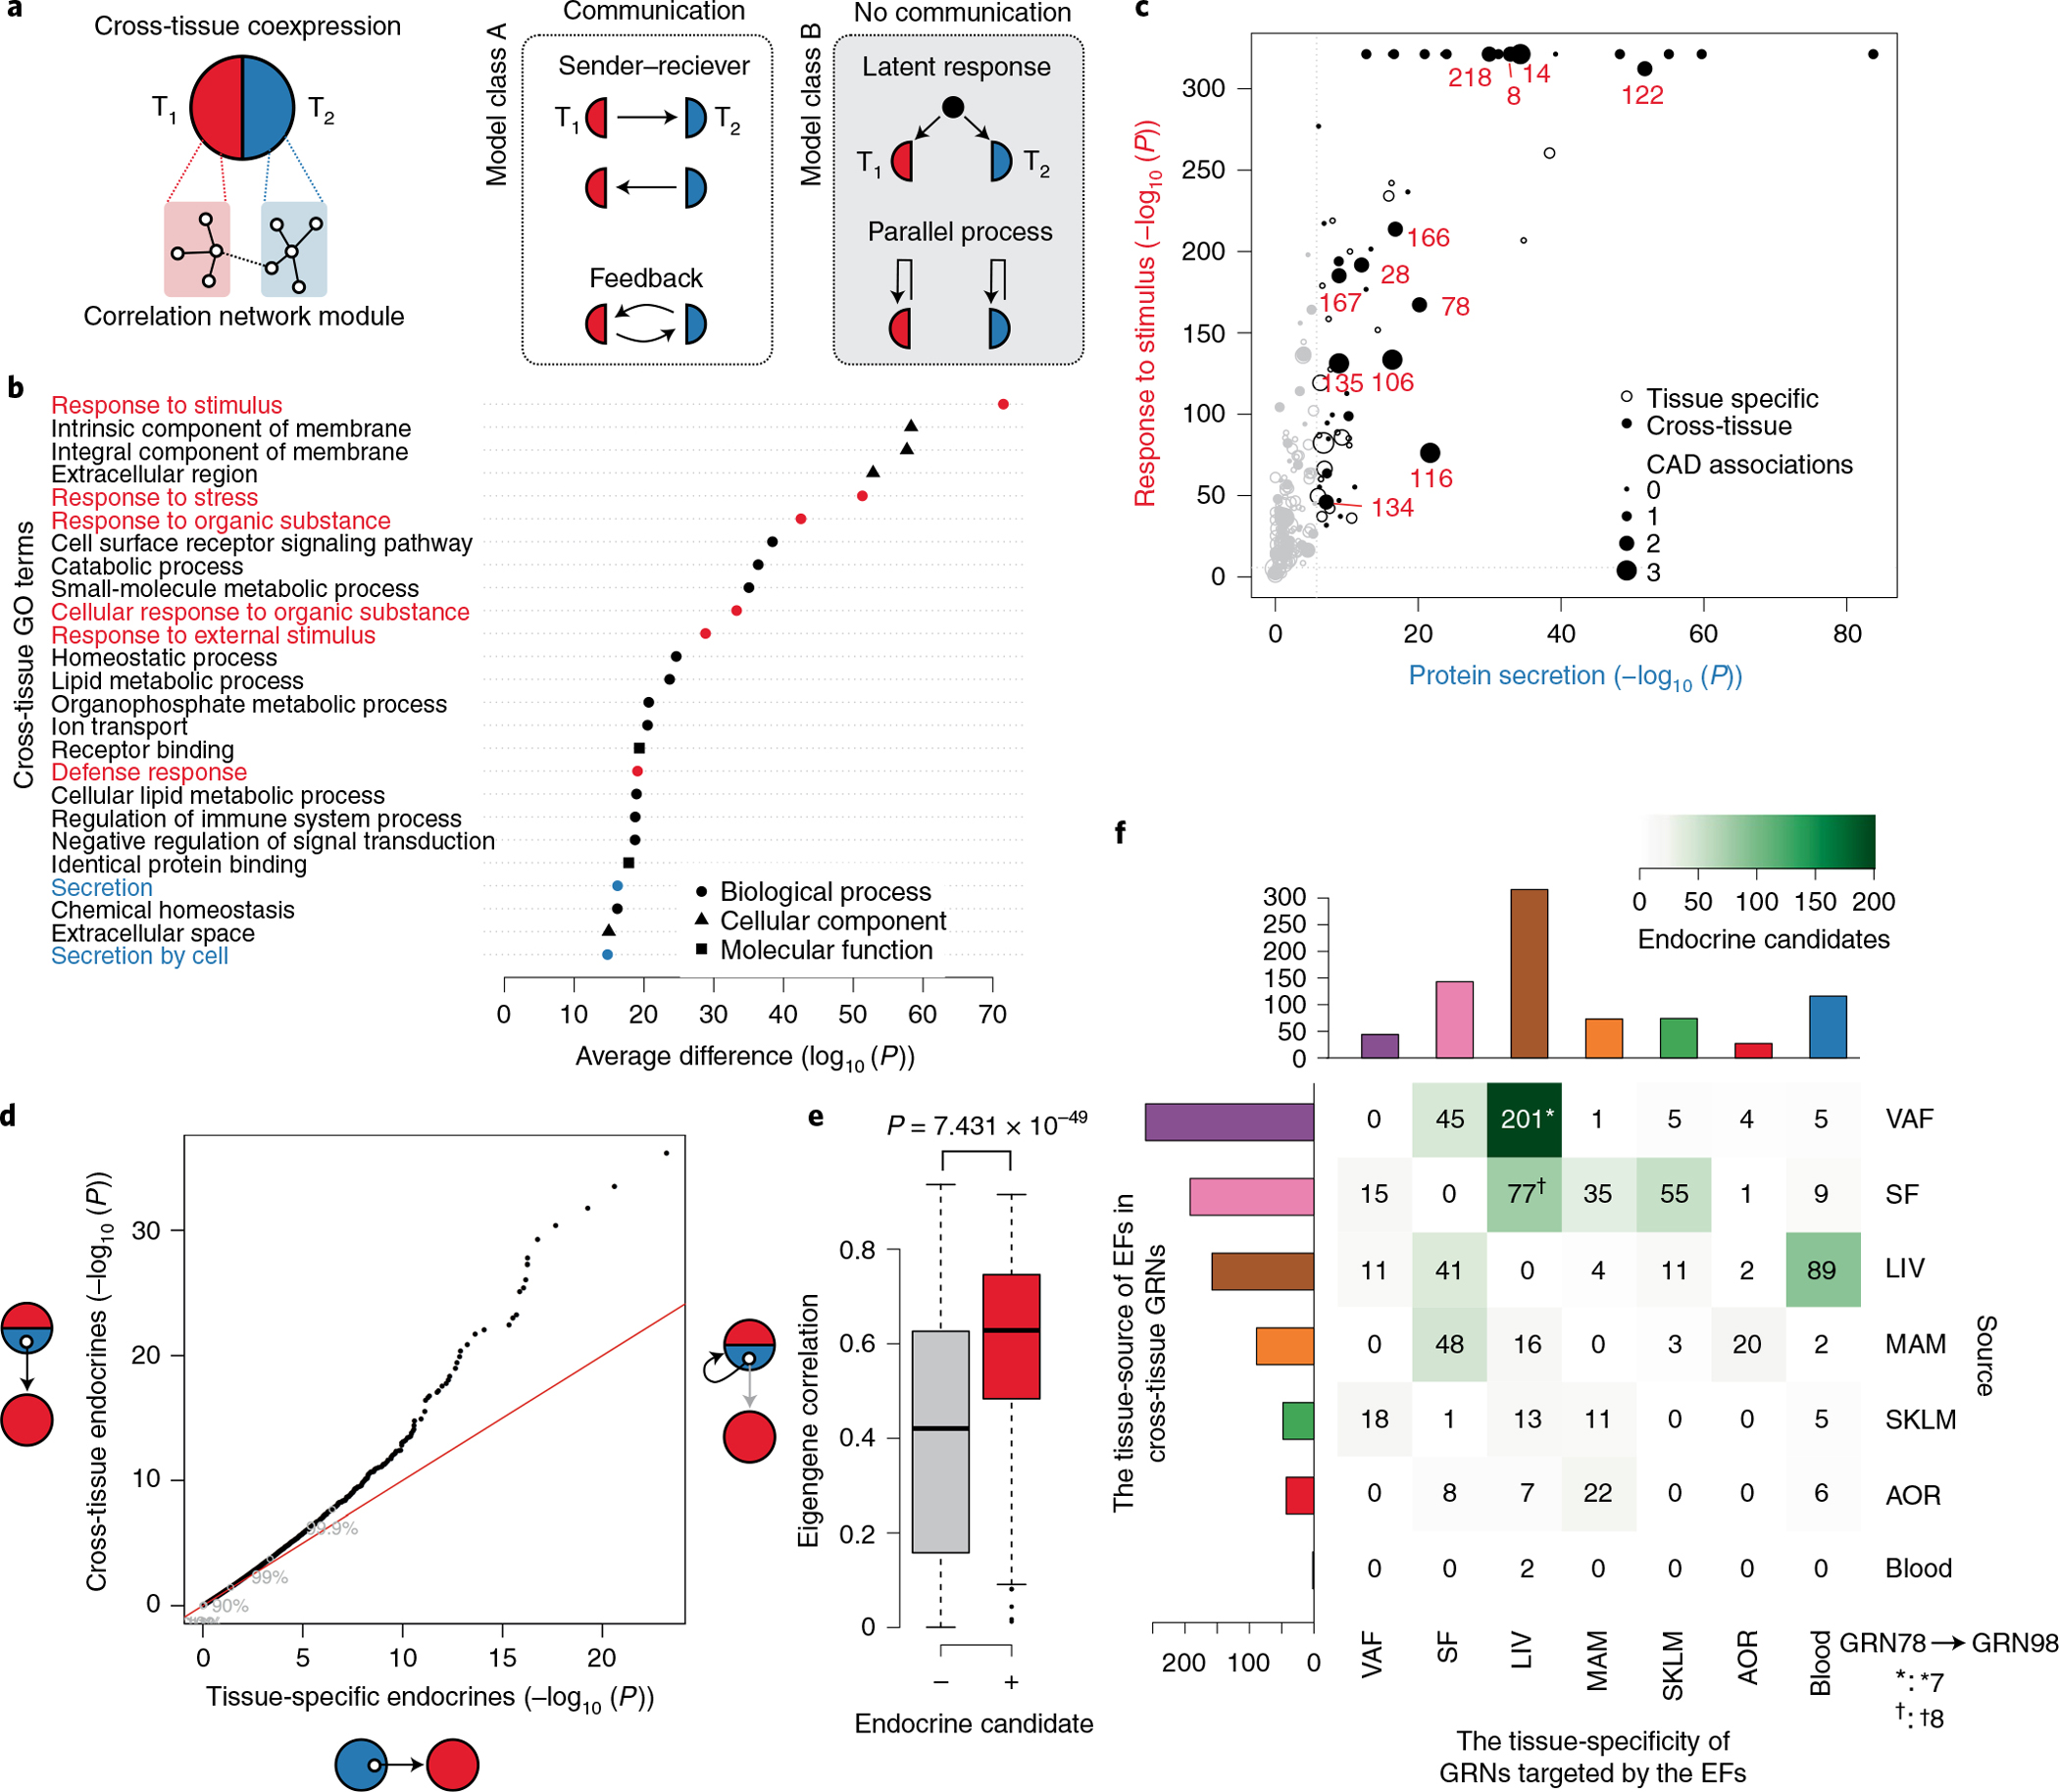
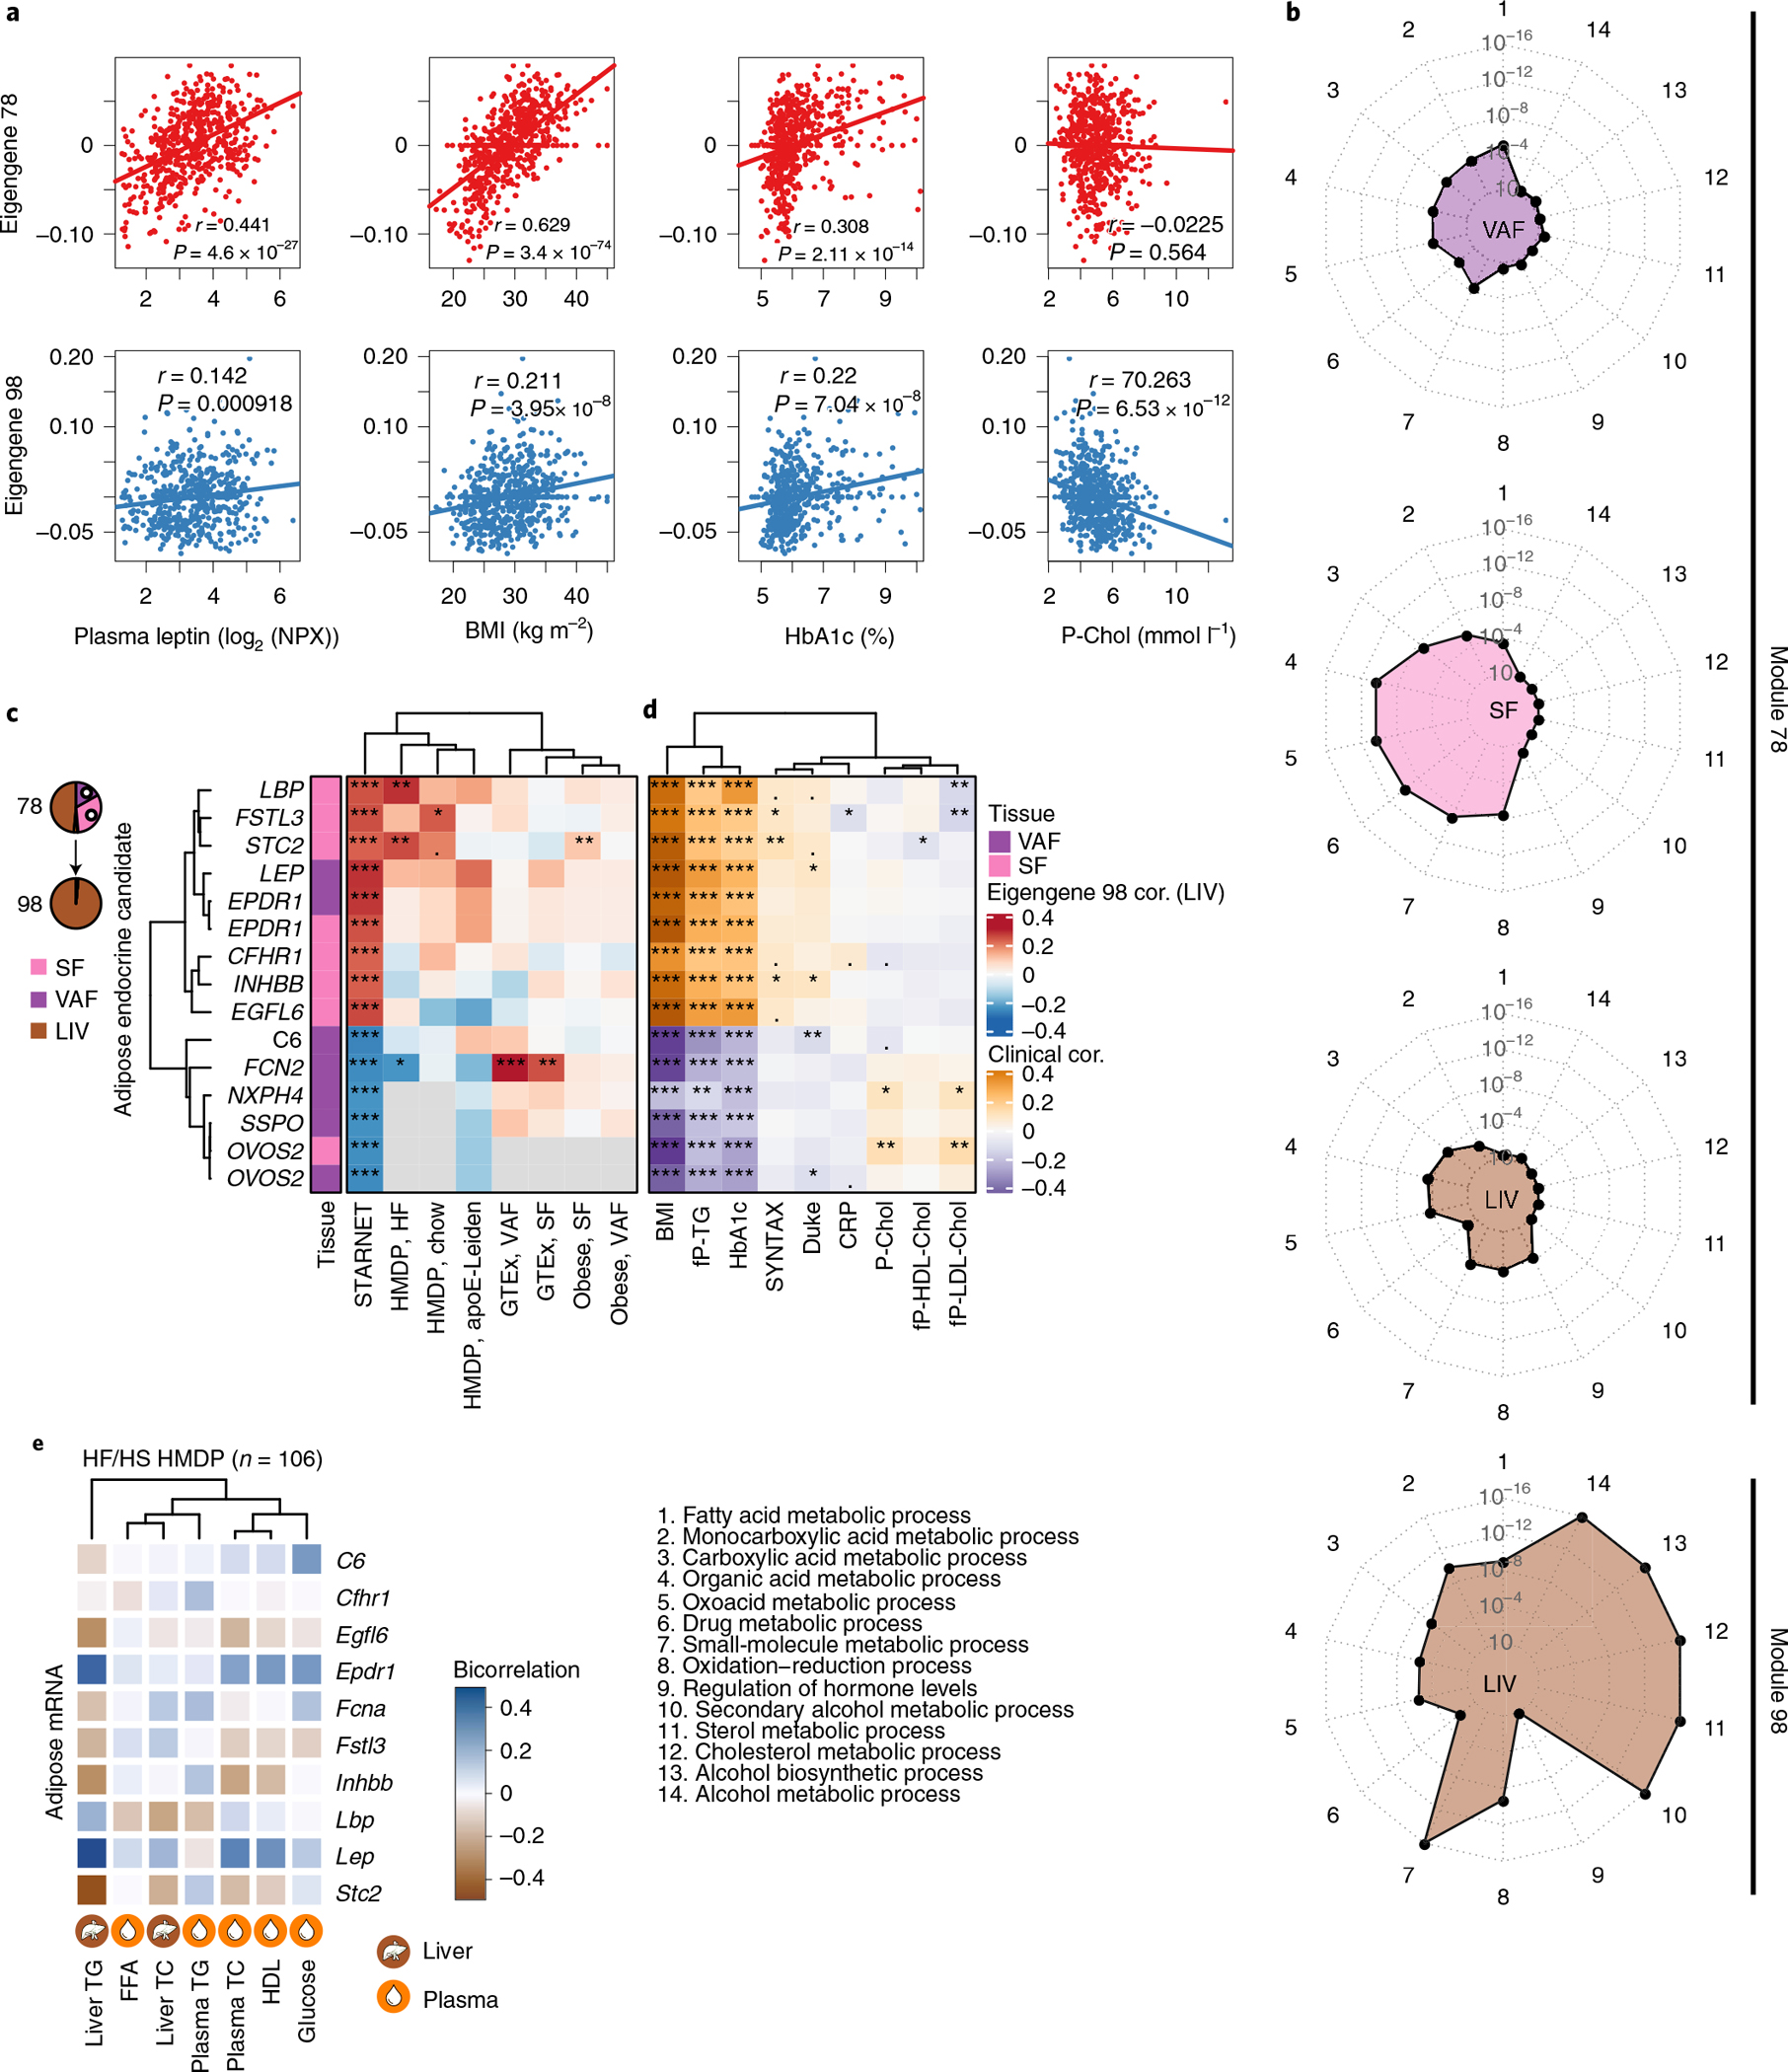
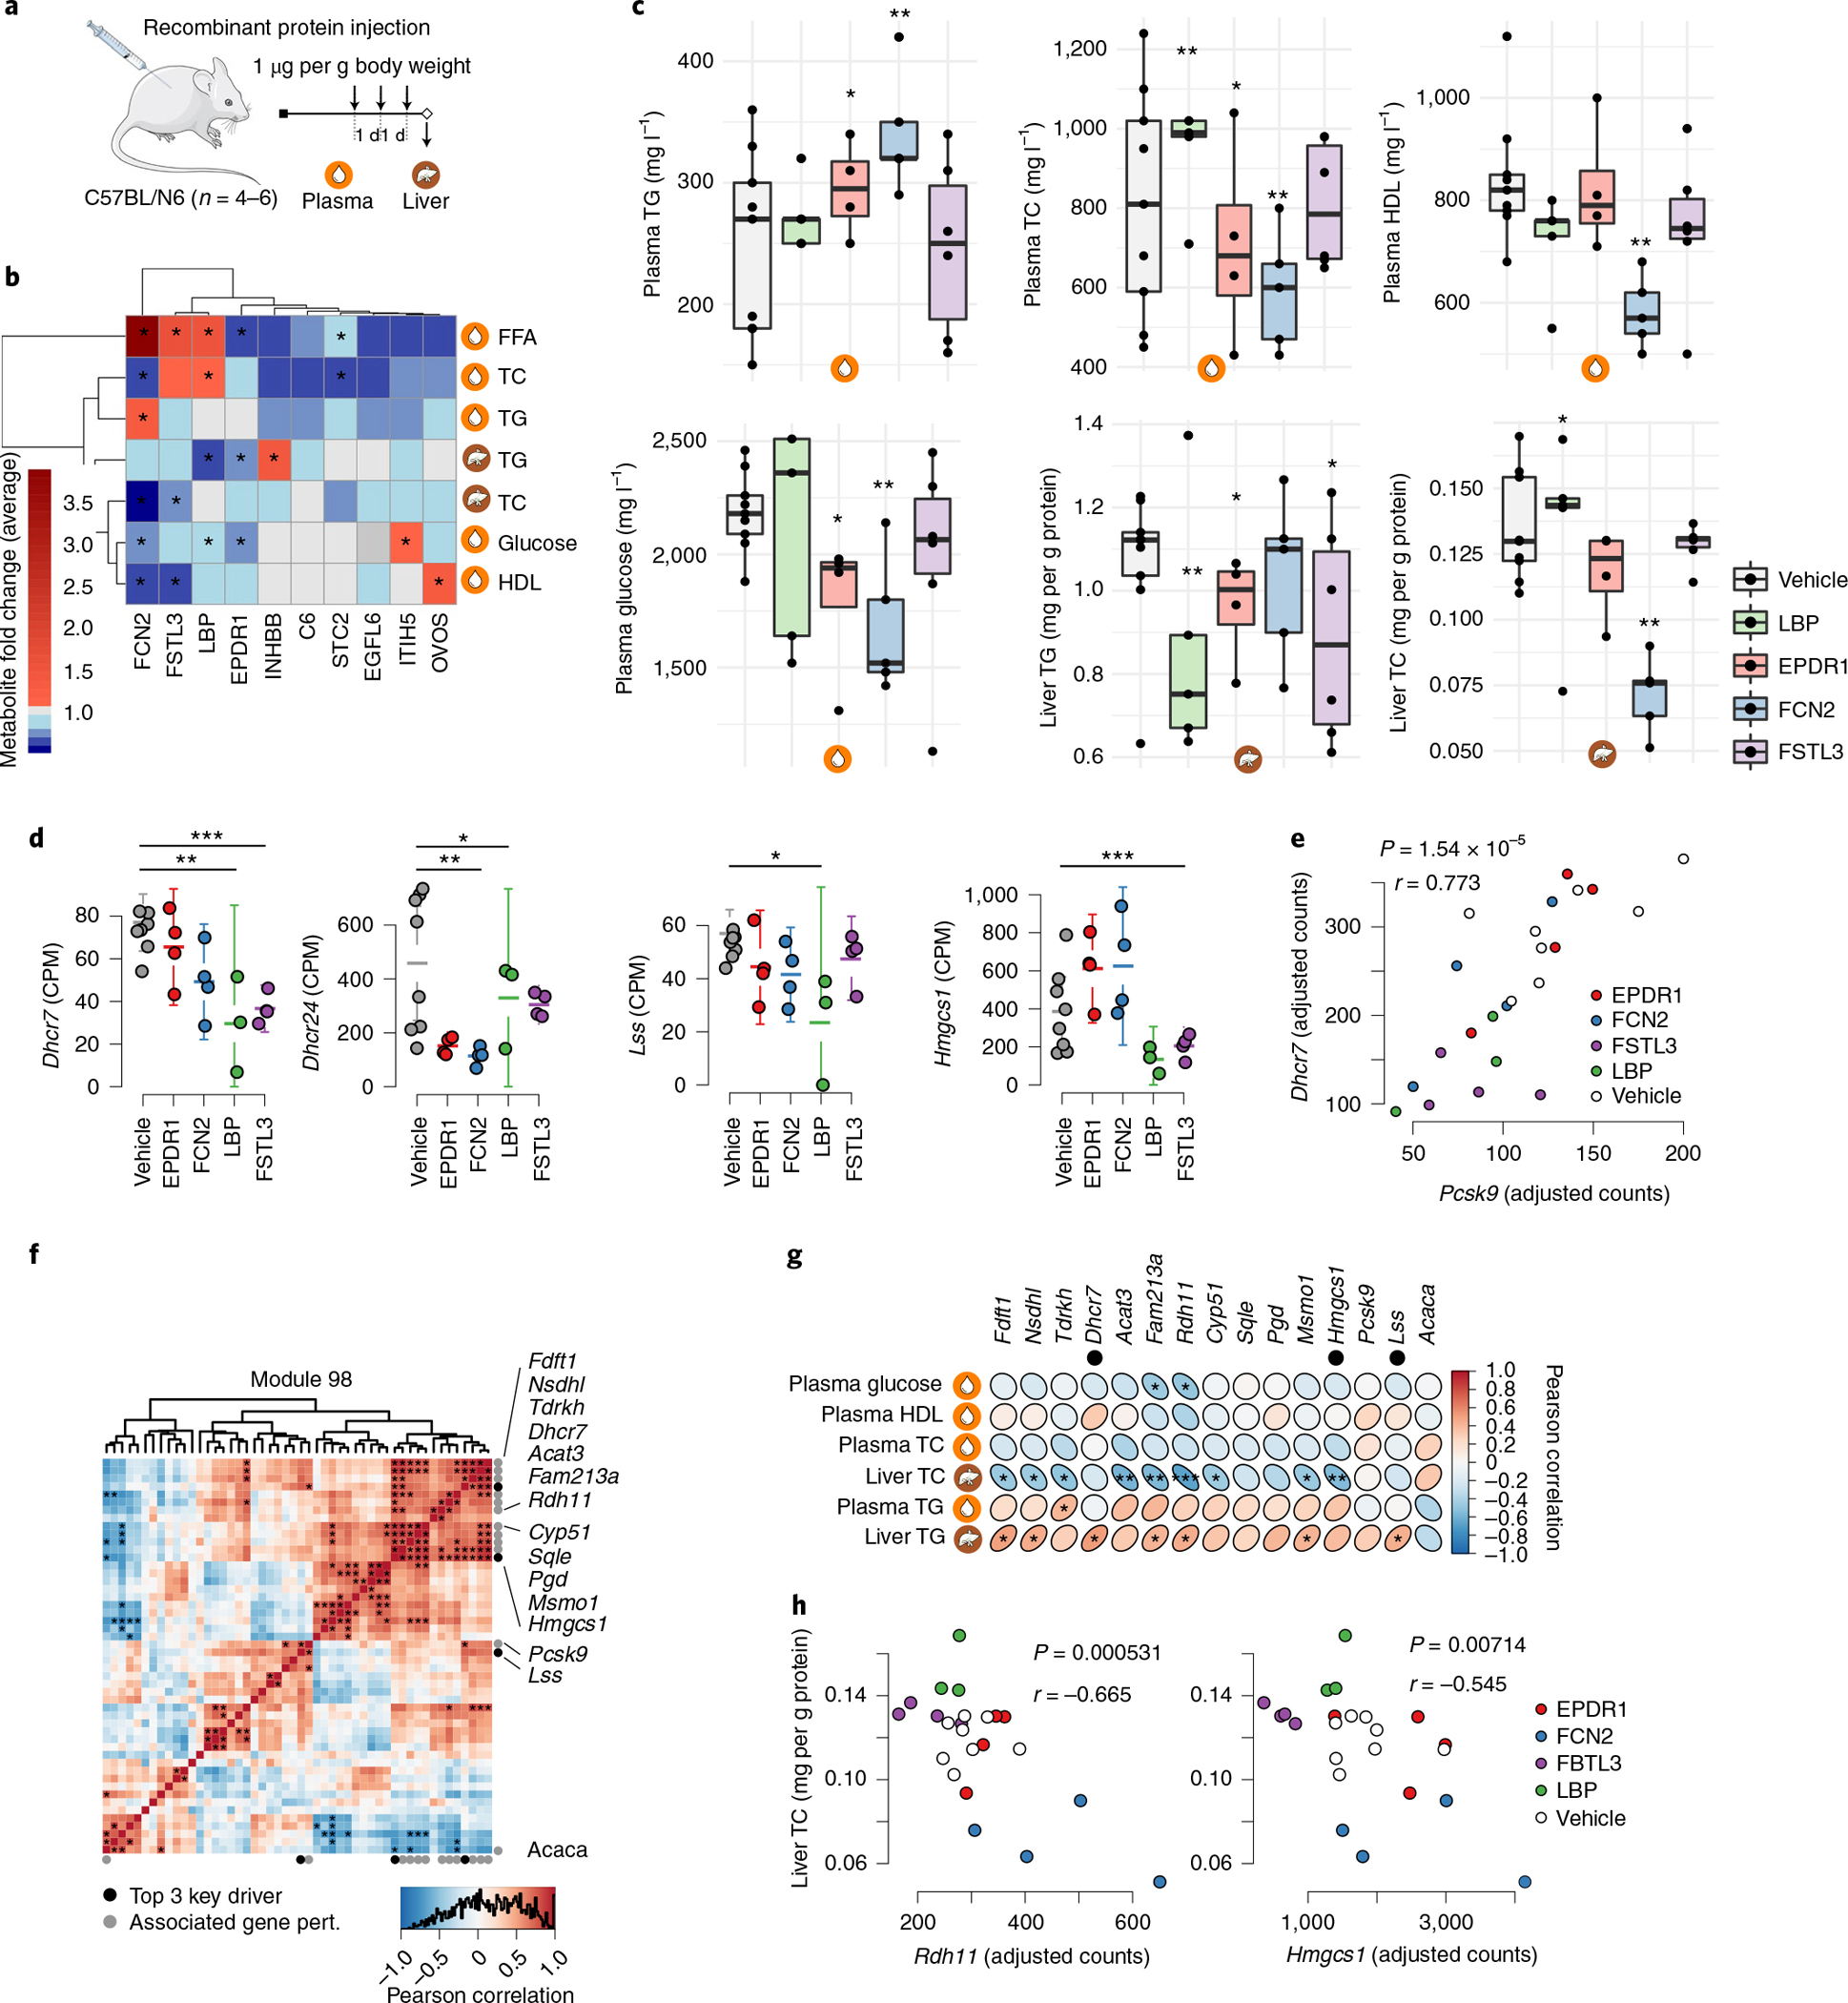
Coronary atherosclerosis results from the delicate interplay of genetic and exogenous risk factors, principally taking place in metabolic organs and the arterial wall. Here we show that 224 gene-regulatory coexpression networks (GRNs) identified by integrating genetic and clinical data from patients with (n = 600) and without (n = 250) coronary artery disease (CAD) with RNA-seq data from seven disease-relevant tissues in the Stockholm-Tartu Atherosclerosis Reverse Network Engineering Task (STARNET) study largely capture this delicate interplay, explaining >54% of CAD heritability. Within 89 cross-tissue GRNs associated with clinical severity of CAD, 374 endocrine factors facilitated inter-organ interactions, primarily along an axis from adipose tissue to the liver (n = 152). This axis was independently replicated in genetically diverse mouse strains and by injection of recombinant forms of adipose endocrine factors (EPDR1, FCN2, FSTL3 and LBP) that markedly altered blood lipid and glucose levels in mice. Altogether, the STARNET database and the associated GRN browser (http://starnet.mssm.edu) provide a multiorgan framework for exploration of the molecular interplay between cardiometabolic disorders and CAD.


Conflict of interest statement

Competing interests J.L.M.B. is the founder of Clinical Gene Networks (CGN). J.L.M.B. (chair) and A.R. are on CGN’s board of directors. J.L.M.B., A.R. and T.M. are shareholders in CGN. J.L.M.B. receives financial compensation as a consultant for CGN. CGN has an invested interest in STARNET that is regulated in an agreement with the Icahn School of Medicine at Mount Sinai. Neither the Icahn School of Medicine at Mount Sinai nor CGN have made claims to results presented in this study. E.E.S. is the CEO of Sema4. C.W. and L.-M.G. are employees of AstraZeneca. No funding for this study was received from Sema4. AstraZeneca supported this study through independent grants to J.L.M.B. at the Karolinska Institutet (ICMC). The remaining authors declare no competing interests.

Figures

Extended Data Fig. 1 |
Extended Data Fig. 1 |. Overview of matching STARNET CAD cases to controls without obstructive CAD according to age, gender and BMI.
The 600 CAD cases underwent coronary artery by-pass grafting (CABG) surgery due to obstructive CAD. The 250 controls were patients eligible to open heart surgery other than CABG (mainly valve replacements) who had no signs of obstructive CAD in pre-operative angiograms (SYNTAX score =0). a, Overview of steps used to select RNA samples from the 600 CAD cases for sequencing by matching them to RNA samples available from the 250 controls according to age, gender and body mass index (BMI). b, Evolutionary algorithm optimizing an objective function quantifying the discrepancy of univariate distribution of age, BMI, and gender between selected cases and controls. c, Distribution of age and BMI (kernel probability density estimates, upper panel) and bar plots of gender for all cases, matched cases and controls (lower panel). d, Bar plots showing per-tissue sample sizes based on tissue sample availability (left panel). Only STARNET subjects in whom at least 3 tissues were sampled were included (right panel). e, Two box plots and one bar plot showing the final balances in age (upper panel) and BMI (middle panel), and gender (lower panel), respectively, between the selected CAD cases and the CAD-negative controls. Median center, lower and upper quartile box, and 1.5 interquartile range whiskers. Two-tailed t-tests.
Extended Data Fig. 2 |
Extended Data Fig. 2 |. Case-control differential gene expression statistics adjusted for metabolic phenotypes, drug treatments and genotype using DESeq2.
The metabolic featured adjusted for comprised: plasma triglycerides, HbA1c, Waist/Hip ratio, plasma low-density lipoprotein (LDL) cholesterol, plasma high-density lipoprotein (HDL) cholesterol, total cholesterol, and C-reactive protein (CRP). The drug treatments adjusted for comprised as discrete categories: β-blocker, Thrombin inhibitors, Long-acting nitrate, Short-acting nitrates, ACE inhibitors or ARB, Loop diuretic, Thiazide diuretic, Lipid lowerer, Ca-channel blocker, Carvedilol, Anticoagulant, Oral antidiabetics, and Insulin. Representing population genotype, we used the first 4 components from MDS analysis of the SNP array data.
Extended Data Fig. 3 |
Extended Data Fig. 3 |. PCA plots of STARNET case and control RNA-seq samples.
a, PCA plot of RNA sequence data from five tissues sampled in both CAD cases and controls. Cases are represented by circles and controls by triangles. Read counts were normalized by DESeq size factors. b, Zoom in of PCA plots for individual tissues.
Extended Data Fig. 4 |
Extended Data Fig. 4 |. Schematics of the multiscale network modeling and normalization of RNA-seq data from the STARNET cases.
a, Schematic illustration of multiscale network modeling based on RNA-seq from multiple patient tissue samples. b, Analytic flow chart of the RNA-seq analysis. Green, blue and red boxes represent input data, steps of data normalization and network inferences, respectively (see also Methods). c, Typical effects of normalization on Pearson’s correlations between 1,000 randomly selected AOR transcripts. The grey lines indicate equivalence with different β-values used in WGCNA. d, Boxplots of n = 499,500 pairwise correlation coefficients among randomly selected genes. Median center, lower and upper quartile box, and 1.5 interquartile range whiskers. e, Density plots demonstrating the quenching effect on AOR transcript correlations following normalization. f, Representative example of the resolution of a partly spurious correlation most likely due to batch effects from different laboratory. The point shape corresponds to laboratory, colors to RNA-seq flow cell, and size to patient age. g, Surrogate variable used for adjustment that correlated to patient ID and not to other known covariates.
Extended Data Fig. 5 |
Extended Data Fig. 5 |. Optimization of scale-free properties of co-expression networks across tissues.
To achieve scale-free properties for both tissue-specific and cross-tissue co-expression networks using weighted gene co-expression network analysis (WGCNA), different β-values (exponentiation parameter of network weights) must be used for gene-gene interactions within and between tissues (Methods). a, β-value calibration curves per tissue and between all tissue combinations, showing the TOM-adjusted scale-free network properties of tissue-specific and cross-tissue networks at different β-values. b, The sizes of co-expression modules (left) and tissue specificity (right) detected using a single (upper panel, green), dual (middle, red) and complete set of pairwise β-values (lower, blue). WGCNA with a single, average β-value for all networks both within and across tissues resulted in 336 predominantly tissue-specific modules. A dual approach with two different β-values: average β-values for networks within tissues (the diagonal in panel c) and for networks across different tissues (off-diagonal β-values in panel c). This resulted in 224 co-expression modules whereof 158 contained genes in ≥2 tissues (70.5%). A complete use of the optimal β-value for each specific pair of tissues (β-values in panel c) resulted in 183 co-expression modules. c, Scatterplot showing the cross-tissue fraction of module transcripts at different module sizes (number of genes). The line indicates the 5% threshold used to define cross-tissue modules. d, Number of detected cross-tissue modules (y-axis) using single, dual and complete β values and the cross-tissue fraction thresholds of 5% (left) and 0.5% (right). e, Detection of a previously characterized and replicated liver-specific co-expression module identified from tissue-specific WGCNA of STARNET using a single (top, green), dual (middle, red) and complete (bottom, blue) β-values in the WGCNA across tissues. f, Overlapping genes with liver co-expression module for the most similar module inferred using single, dual and complete β-values with WGCNA across tissues. g, Frequency of co-expression modules with increasing numbers of cross-tissue genes.
Extended Data Fig. 6 |
Extended Data Fig. 6 |. Cross-tissue co-expression module inference using block-wise WGCNA.
To accommodate the high number of transcripts quantified in the multitissue RNA-seq data, we used block-wise WGCNA, first partitioning transcripts from multiple tissues into 5 blocks using k-means. a, Barplot showing the tissue composition of transcripts segmented into 5 k-means clusters. b, Barplot showing hierarchical clustering of the tissue composition of cross-tissue co-expression modules detected with WGCNA. Each bar corresponds to one co-expression module. Y-axis shows the number of transcripts by tissue. Only modules containing <5,000 transcripts were included. c, Line plot showing the mean fraction of Pearson’s correlation coefficients (y-axis) captured in the 93 cross-tissue modules as a function of cross-tissue correlation cutoff criteria (x-axis). The means are calculated over the 21 tissue pairs in STARNET with the blue area indicating 95% confidence intervals. The vertical dotted line represents a correlation network edge criterium of 0.5, with all supporting tissues pairs plotted as points. d, Hierarchical clustering of co-expression modules, as shown in Fig. 2 d with module IDs.
Extended Data Fig. 7 |
Extended Data Fig. 7 |. Co-expression network module replication and tissue associations with CAD traits.
a, Concordance with GTEx RNA-seq data of gene-gene correlation coefficients in tissue-specific modules and in, b, cross-tissue modules, excluding gene-gene interactions within tissue. Modules indicated with black circle showed significant similarity at FDR < 0.05, Bonferroni corrected for n = 224 tests. c, d, In the absence of normal distributions of network correlation coefficients and weights, we also used 4 one-sided permutation tests implemented in the NetRep R package for replication of tissue-specific (c) and cross-tissue (d) co-expression modules. The scale is −log10 P values from the permutation test for the 4 different measures of network validation, where the extreme corresponds to P < 0.001 indicating the maximum sensitivity based on 1,000 permutations. e, Violin plots comparing tissue fractions of genes in co-expression modules that are significantly associated (+) with SYNTAX score (upper panel), Duke score (middle panel), or enriched (+) in differentially expressed CAD genes (Hypergeometric test) (Fig. 2c) with the tissue fraction of module genes that are not (−) (FDR < 0.05). P-values comparing the ‘+’and “−”module groups are calculated using Wilcoxon two-sided signed-rank test. For SYNTAX and Duke scores, which estimate arterial atherosclerosis, the co-expression modules were associated by aggregating gene-level P-values using Fisher’s method. f, QQ plots comparing tissue-specific and cross-tissue co-expression module aggregated P-values (Fisher’s method) for Duke (upper panel) and SYNTAX score (middle panel) and module enrichment of CAD DEGs. In contrast to CAD DEGs, cross-tissue modules are significantly more associated with Duke and SYNTAX scores than tissue-specific modules (Wilcoxon rank-sum test).
Extended Data Fig. 8 |
Extended Data Fig. 8 |. A tutorial of the STARNET browser.
The STARNET browser (http://starnet.mssm.edu) brings the mechanistic framework of GRNs to the bench-side of the individual CMD and CAD scientist for immediate use. In the displayed example, 304 lead SNPs identified by the most recent GWAS of CAD are queried using the STARNET browser. Six of these lead SNPs are found as eQTLs in GRN39. Together with plasma LDL/HDL levels, these lead SNPs regulate the activity of GRN39 that in turn governs the extracellular matrix organization in the coronary arteries, thereby affecting CAD development (Fig. 3).
Extended Data Fig. 9 |
Extended Data Fig. 9 |. Mendelian Randomization to determine gene-regulatory network causality.
Stack plots showing fraction of tissue-specific GRNs considered causal in MR analysis (Methods). The hypergeom function from the SciPy stats package in Python62 was used to test overlaps with tissue-specific causal networks (blue, Extended Data Table 5) in relation to the total number of GRNs in each STARNET tissue (yellow, FDR < 5% according to Storey and Tibshirani63).
Extended Data Fig. 10 |
Extended Data Fig. 10 |. Modeling network module eigengene-eigengene interactions in a supernetwork to capture high-level tissue patterns of CAD disease progression.
a, Bayesian supernetwork inferred from eigengene values of the 224 STARNET co-expression modules. The likelihood of directed acyclic graphs was assessed using the Bayesian information criteria (BIC) and optimized using fast greedy equivalence search from Tetrad. Network layout was determined by the Fruchterman-Reingold algorithm. Left, colors indicate primary tissues, middle, green indicates cross-tissue network modules and right, yellow indicates tissue-specific network modules. b, Diagram showing bootstrap confidence estimates of supernetwork edges (Methods). Random sets of subjects were drawn and used to infer an ensemble of 1,000 Bayesian networks, from which supernetwork edges were ranked. Bootstrapped P values estimated by 1–frequency of edges in network ensemble. c, Bar plot showing the distribution of 153 statistically robust edges in the supernetwork among the four possible combinations of cross-tissue (CT) and tissue-specific (TS) module interactions. Edge robustness was assessed by bootstrap analysis (M = 10,000) of the full supernetwork of 224 module nodes and 49,952 possible edges (Methods). d, Box plots comparing centrality of cross-tissue modules (n = 89) compared to tissue-specific modules (n = 135). Median center, lower and upper quartile box, 1.5 interquartile range whiskers. The network centrality analysis was based on the betweenness measure, counting the number of shortest paths through each node, performed on a 224×224 matrix of supernetwork eigengene interaction P-values (bootstrap estimates). Comparison by two-sided t test. e, Venn diagram showing 113 GRNs significantly enriched in at least one of 3 CAD clinical measures; 32 GRNs with at least 2 CAD measures, and 8 GRNs with all 3 CAD measures. The CAD measures of the GRNs are enrichment with genes associated with SYNTAX (1) and/or Duke (2) scores (FDR < 0.01) and/or with DEGs in CAD cases versus controls (3). f,g, High-confidence directed edges in the supernetwork (see Methods) detected between 25 of the 32 CAD-associated GRNs with more than two CAD measures (a) colored according to module tissue distribution (f) and enrichment with candidate genes identified by GWAS (g and Fig. 3e). The layout was determined by the Sugiyama algorithm. Indicated below each supernetwork node is the GRN identification number. h, Scatter plot of Pearson correlations between the eigengene values of the most significant edge in the supernetwork between cross-tissue network module 78 and tissue-specific network module 98. P-values were calculated using a two-tailed t-test.
Fig. 1 |
Fig. 1 |. Schematic overview of study flow, including main data-analysis steps, result summary and conclusions.
TFs, transcriptions factors; GRN78, cross-tissue GRN78 identified in the STARNET study; GRN98, liver-specific GRN98 identified in the STARNET study; EF, endocrine factor; KDs, key disease drivers; H2, broad-sense heritability contribution.
Fig. 2 |
Fig. 2 |. Cross-tissue and tissue-specific coexpression network modules capture phenotypic variation associated with CMD and CAD traits.
a, Left, multi-tissue sampling in the STARNET study. Right, sample sizes and study design for generation and analysis of RNA-seq data from individuals with obstructive CAD and controls without obstructive CAD, verified by pre-operative coronary angiographs. Numbers of DEGs in each tissue were calculated from resequenced and randomized RNA samples isolated from individuals with CAD matched to controls by age, sex and BMI. The extent or absence of CAD was determined from pre-operative coronary angiograms and assessed by SYNTAX and Duke scores. b, Bar plots showing the number of genes associated with CMD and/or CAD traits either assessed with DESeq2, adjusting for age and sex (FDR < 0.01), or Pearson correlation with normalized gene expression (|r| > 0.2), which corresponds to Bonferroni correction at FDR < 0.14 (two-sample Student’s test, n = 500 patients and 21,500 genes). CRP, C-reactive protein; fP-Chol, fasting plasma total cholesterol levels; fP-LDL-Chol, fasting plasma LDL cholesterol levels; fP-HDL-Chol, fasting plasma high-density lipoprotein (HDL) cholesterol levels; fP-TG, fasting plasma triglyceride levels; P-Chol, plasma cholesterol levels. c, Volcano plots showing coding (red) and noncoding (blue) DEGs, comparing tissue samples from individuals with CAD and CAD-free controls (FDR < 0.01 and ±30% fold change). DESeq2 two-tailed statistics adjusted for multiple hypotheses with the Benjamini–Hochberg (BH) method. FC, fold change. d, Hierarchical clustering of 135 tissue-specific (left) and 89 cross-tissue (right) coexpression network modules. Modules were inferred from gene expression across all tissues in up to 572 individuals with CAD in the STARNET study followed by blockwise, weighted WGCNA with distinct β values for cross-tissue and tissue-specific correlations to achieve scale-free networks. Modules containing >5% of transcripts from more than one tissue were defined as cross-tissue. Modules were annotated and clustered by tissue composition (multicolor), module enrichment in genes associated with metabolic phenotypes (blue) and with three CAD measures (green): module enrichments of DEGs from case–control tissues (hypergeometric test) and module meta-analysis of genes associated with SYNTAX and Duke scores. Enrichment for SYNTAX and Duke scores, along with metabolic phenotypes, were assessed by aggregate gene-level P values (Fisher’s method) based on Pearson correlation two-tailed t-tests. Multiple hypotheses for the 224 modules tested were adjusted separately for each association type using the Benjamini–Hochberg method.
Fig. 3 |
Fig. 3 |. Major heritability contributions of GRNs.
a, Pie chart showing portions of broad-sense heritability (H2) of CAD explained by lead SNPs identified in a GWAS, by eSNPs in GRNs identified in the current study and the missing part, postulated to comprise epistasis. b, Scatterplot of average H2 contributions in relation to coexpression module size (number of genes in each GRN). c, Bar plot showing CAD heritability contributions (H2) of each of the 224 modules. Each module represents one GRN; H2 contributions of SNPs affecting gene expression (eSNPs) in each GRN were calculated by using the REML method after excluding all SNPs in linkage disequilibrium (r2 > 0.2) with known CAD lead SNPs identified by GWAS (Supplementary Table 3). d, Bar plot showing the average CAD H2 contribution per eSNP of each of the 224 modules. Each module represents one GRN (Supplementary Table 3). e, Bar plot showing the fraction (percent) of CMD and CAD GWAS genes found in significantly enriched tissue-specific (TS) and cross-tissue (CT) GRNs (hypergeometric test, FDR < 0.1, 71 networks in total). WHRadjBMI, waist/hip ratio-adjusted BMI. f, The arterial wall-specific GRN39 (http://starnet.mssm.edu/module/39, see also tutorial in Extended Data Fig. 8, n = 182 genes) contributes to 1.79% of CAD H2, contains seven eQTL of six lead SNPs identified by GWAS of CAD (rs7500448,CDH13; rs2839812, PDGFD; rs421329, PPP1R3G; rs2083460, ABHD2; rs11257613, CAMK1D; rs2083460, MFGE8; rs28596486, HTRA1) and 26 top key drivers (in bold). GRN39 was found enriched in genes associated with the extent of coronary lesions according to SYNTAX score (P = 10−7), plasma levels of HbA1c (P = 10−27), plasma levels of HDL (P = 10−32) and LDL (P = 10−34) and cholesterol levels and BMI (P < 10−100) and, according to GO analysis, is involved in ‘extracellular matrix organization’ (GO:0030198, FDR = 1.04 × 10⁻³³). The official NCBI Gene symbol for C11orf95 is ZFTA. g, The cross-tissue (AOR, 84%; SF, 15%) GRN165 (http://starnet.mssm.edu/module/165, n = 709 genes) contributes to 4.1% of CAD H2 and contains nine top key drivers (in bold). GRN165 is enriched in genes associated with plasma levels of high-sensitivity CRP (hCRP) (P = 10−25), the extent of coronary lesions according to the angiographic Duke score (P = 10−56), BMI (P = 10−64) and plasma levels of LDL and HDL cholesterol (P < 10−100) and, according to GO analysis, is involved in ‘RNA processing’ (GO:0006396, FDR = 2.03 × 10−55). The official NCBI Gene symbol for SEPW1 is SELENOW. h, The visceral fat-specific GRN27 (http://starnet.mssm.edu/module/27, 553 genes) contributes to 3.24% of CAD H2 and contains seven top key drivers (in bold). GRN27 is enriched in genes associated with plasma levels of HbA1c (P = 10−5) and triglycerides (P = 10−8), the extent of coronary lesions according to the angiographic Duke score (P = 10−9), DEG CAD genes (P = 10−14), the total level of plasma cholesterol (P = 10−19), the waist/hip ratio (P = 10−42) and BMI (P < 10−100) and, according to GO analysis, is involved in ‘epithelium development’ (GO:0060429, FDR = 4.8901 × 10−36). The official NCBI Gene symbol for C14orf79 is CLBA1. i, The liver-specific GRN214 (http://starnet.mssm.edu/module/214, n = 229 genes) contributes to 2.25% of CAD H2 and contains 11 top-ranked key drivers (in bold). GRN214 is enriched in genes associated with the number of coronary lesions (P = 10−6), the total level of plasma cholesterol (P = 10−8), HbA1c levels (P = 10−9), the waist/hip ratio (P = 10−23), plasma triglyceride levels (P = 10−32), BMI (P = 10−94) and plasma levels of hCRP and HDL and LDL cholesterol (P < 10−100) and, according to GO, is involved in ‘mitochondrion organization’ (GO:0007005, FDR = 3.66 × 10−39). The official NCBI Gene symbol for C7orf73 is STMP1. In fi, visualizations of GRNs are restricted to nodes (‘genes’) that are immediately downstream of key drivers. Top key drivers with equal rank are highlighted in bold. GO gene set enrichment was assessed by hypergeometric tests with Bonferroni adjustment. DEG CAD enrichment was assessed by hypergeometric test. Clinical phenotype enrichment was assessed by aggregate gene-level P values (Fisher’s method).
Fig. 4 |
Fig. 4 |. A high-hierarchy network organization of GRNs reveals that topologically central cross-tissue networks are important for CAD development.
a, Diagram of a Bayesian directed high-hierarchy network (‘supernetwork’) inferred from eigengenes of the 224 GRNs over blood, metabolic and vascular tissues. The supernetwork layout was computed with the Fruchterman–Reingold algorithm, which largely clustered each GRN by its primary tissue (http://starnet.mssm.edu). Color coding of supernetwork nodes and outgoing edges indicates association with CAD measures (DEG enrichment and aggregate P values for SYNTAX and Duke scores, FDR < 0.01), showing the central location of cross-tissue GRNs. b, Contingency tables showing that cross-tissue GRNs more frequently have two or more CAD associations than tissue-specific GRNs. The upper table includes all tissue-specific networks, whereas the lower table excludes AOR and MAM tissues, which are the principal sites of CAD development. c, Box plots showing average CAD H2 contributions of cross-tissue (CT) GRNs (n = 89) versus tissue-specific (TS) GRNs (n = 135) (left), per-GRN eSNPs (middle) and per-GRN key drivers (KDs) (right). Median, center; lower and upper quartiles, box; 1.5 × interquartile range, whiskers. d,e, Density plots of size (d) and number of key drivers (e) of cross-tissue GRNs. Significance was determined by χ2 tests (b), two-sample t-tests (c) and two-sample Wilcoxon rank-sum tests (d,e).
Fig. 5 |
Fig. 5 |. Endocrine factors in cross-tissue networks mediate signaling between GRNs in metabolic tissues and the arterial wall.
a, Two biological models that may explain cross-tissue GRNs. Left, communicative models, such as sender–receiver or feedback signaling. Right, noncommunicative models, such as parallel coincidental responses to latent external factors (for example, circulating or neuronal factors) or parallel but independent intra-tissue processes such as cell mitosis. T1, tissue 1; T2, tissue 2. b, Difference in GO enrichment between cross-tissue and tissue-specific GRNs (Fisher’s exact test, one-sided Mann–Whitney test of enrichment log (P values), FDR < 0.01). Enrichments of GO terms related to cellular signal reception and transmission are marked in red and blue, respectively. c, GO enrichments of cross-tissue and tissue-specific GRNs for the sender term ‘protein secretion’ (x axis) and the receiver term ‘response to stimuli’ (y axis). CAD-associated GRNs are marked in red. Gene set enrichment was performed by Fisher’s exact test. d, Quantile–quantile plot of correlations between genes (mRNA) encoding secreted proteins (UniProt annotation) in cross-tissue (y axis) and tissue-specific (x axis) GRNs and eigengene values of tissue-specific GRNs separate from the origin of the mRNA of the secreted protein (Pearson correlations, two-tailed t-test). e, Box plot showing average mRNA correlations of genes encoding secreted proteins with the eigengene of their host cross-tissue GRNs, comparing secreted proteins defined as ‘endocrine candidates’ (+, n = 467) and those that were not (−, n = 2,959). ‘Endocrine candidates’ were defined as secreted proteins in cross-tissue GRNs with correlations with tissue-specific GRNs at FDR < 0.2 in d. Median, center; lower and upper quartiles, box; 1.5 × interquartile range, whiskers. Two-sample Wilcoxon test. f, Heatmap of a tissue source–target matrix of 793 significant associations between pairs of endocrine candidate mRNA expression values and eigengene values of tissue-specific GRN targets. In total, 374 unique endocrine candidate genes were identified. 13 of these endocrine candidates identified in VAF (n = 7) or SF (n = 8*) as part of the cross-tissue (liver-SF-VAF) GRN78 targeted the liver-specific GRN98 representing the most reliable edge in the supernetwork according to the bootstrapping analysis (Extended Data Fig. 10h).
Fig. 6 |
Fig. 6 |. Adipose endocrine factors in the cross-tissue GRN78 targeting liver-specific GRN98 are associated with liver and plasma lipid and glucose levels.
a, Scatterplots showing linear correlations of eigengene values of GRN78 and GRN98 with BMI and plasma leptin, HbA1c and total cholesterol levels. Pearson correlation, two-sample t-tests. b, Radar plots comparing the top five GO enrichments for tissue-stratified genes in GRN78 and GRN98. c, Heatmap showing Pearson correlations of GRN78 endocrine candidates (13 unique genes) with eigengene values of GRN98 in the STARNET study and in independent SF, VAF and liver microarray and RNA-seq data from HMDP mice fed a chow or high-fat (HF) diet, GTEx and a morbid obesity cohort. The official NCBI Gene symbol for SSPO is SSPOP. d,e, Associations of the 13 endocrine candidates with; CMD and CAD clinical phenotypes in the STARNET study (d) and, CMD phenotypes in high-fat/high-sucrose (HF/HS) fed mice in the HMDP, including plasma free fatty acid (FFA) levels and liver triglyceride (TG) and total cholesterol (TC) levels (e). Cor., correlation; NPX, Normalized Protein eXpression (Olink Inc.).
Fig. 7 |
Fig. 7 |. Injection of mice with GRN78 endocrine factors affects GRN98 and levels of liver and plasma lipids and blood glucose.
a, Chow-fed C57BL6N mice were injected with purified recombinant proteins of the indicated endocrine factors or the vehicle control (secreted GFP) once daily for 3 d (1 μg per g body weight). Twenty-four hours after the final injection, mice were killed, and the liver and plasma were collected for RNA isolation and metabolite screening. b, Heatmap showing changes in liver and plasma lipid and glucose levels in response to injection of recombinant forms of ten adipose endocrine candidates in GRN78 compared to those of control mice injected with GFP. *P < 0.01 by two-tailed t-test. c, Box plots comparing concentrations of plasma and liver lipid and blood glucose levels (y axis) after injecting recombinant endocrine factors (x axis). n = 3–8 independent animals per treatment group. Median, center; lower and upper quartiles, box; 1.5 × interquartile range, whiskers. Two-tailed t-tests. *P < 0.05, **P < 0.005, ***P < 0.001 versus vehicle (GFP). d, Mean plots showing mRNA expression of top key drivers in GRN98 (Dhcr7, Dhcr24, Lss and Hmgsc1) after injection of recombinant endocrine factors. Batch-adjusted DESeq2 negative binomial two-tailed tests, corrected for multiple hypotheses genome-wide with the Benjamini–Hochberg method. For visualization, expression values were normalized by counts per million (CPM). n = 4–6 independent animals per treatment group. Error bars are s.e.m. *FDR < 0.05, **FDR < 0.01, ***FDR < 0.001 versus vehicle. Tests are batch-adjusted DESeq2, corrected for multiple hypotheses genome-wide. e, Scatterplot showing correlation of Dhcr7 and Pcsk9 expression levels after injections (Pearson correlation, two-tailed t-test). f, Heatmap showing GRN98 gene correlations in liver RNA-seq data after injecting recombinant endocrine factors. Black dots indicate the top three key drivers previously identified, and gray dots indicate significantly associated genes. *FDR < 0.05, adjusted by the Benjamini–Hochberg method. Pert., perturbation. The official NCBI Gene symbol for Fam213a is PRXL2A. g, Heatmap showing Pearson correlations between GRN98-associated genes (d) and hepatic and plasma lipid and blood glucose levels after injecting recombinant endocrine factors. Two-tailed correlation t-tests. *P < 0.05, **P < 0.01, ***P < 0.001. The top three key drivers are indicated by black dots. h, Scatterplot showing liver cholesterol levels (y axis) and expression levels of Rdh11 and Hmgsc1 (x axis) after injecting recombinant endocrine factors. Pearson correlation, two-tailed t-tests.

References

    1. Kumar V, Hsueh WA & Raman SV Multiorgan, multimodality imaging in cardiometabolic disease. Circ. Cardiovasc. Imaging 10, e005447 (2017). - PMC - PubMed
    1. Rask-Madsen C & Kahn CR Tissue-specific insulin signaling, metabolic syndrome, and cardiovascular disease. Arterioscler. Thromb. Vasc. Biol. 32, 2052–2059 (2012). - PMC - PubMed
    1. Beverly JK & Budoff MJ Atherosclerosis: pathophysiology of insulin resistance, hyperglycemia, hyperlipidemia, and inflammation. J. Diabetes 12, 102–104 (2020). - PubMed
    1. Schadt EE et al. An integrative genomics approach to infer causal associations between gene expression and disease. Nat. Genet. 37, 710–717 (2005). - PMC - PubMed
    1. Schadt EE Molecular networks as sensors and drivers of common human diseases. Nature 461, 218–223 (2009). - PubMed