

A lactate-related LncRNA model for predicting prognosis, immune landscape and therapeutic response in breast cancer
- PMID: 36276952
- PMCID: PMC9579365
- DOI: 10.3389/fgene.2022.956246
A lactate-related LncRNA model for predicting prognosis, immune landscape and therapeutic response in breast cancer
Abstract
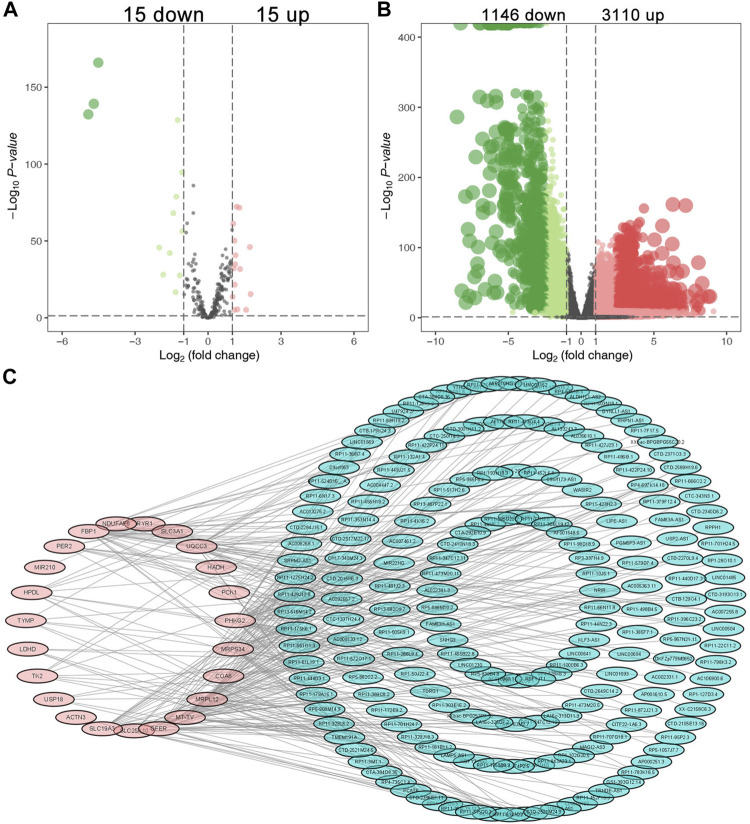
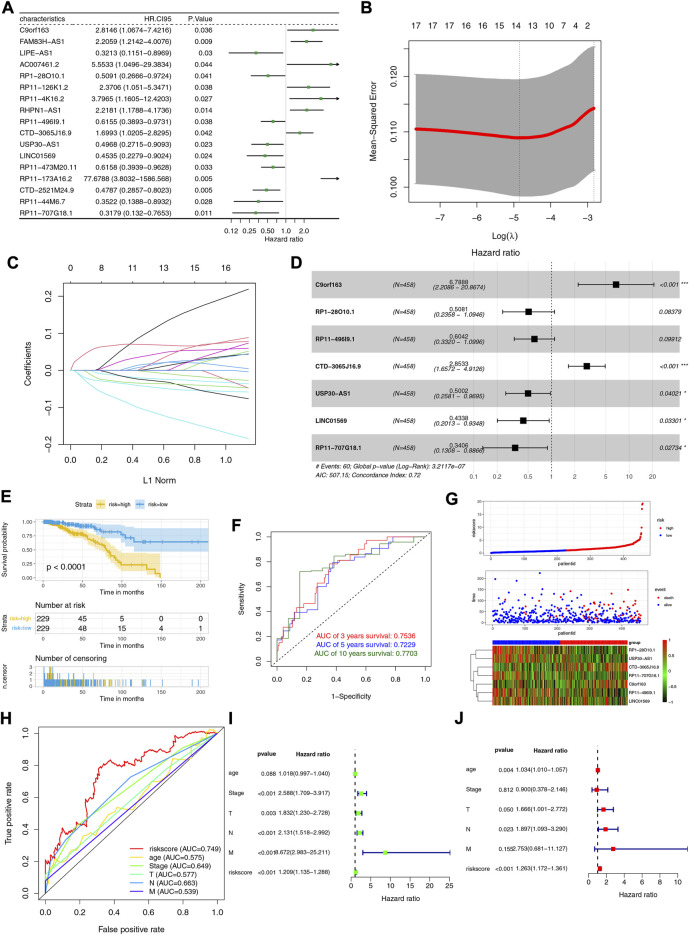
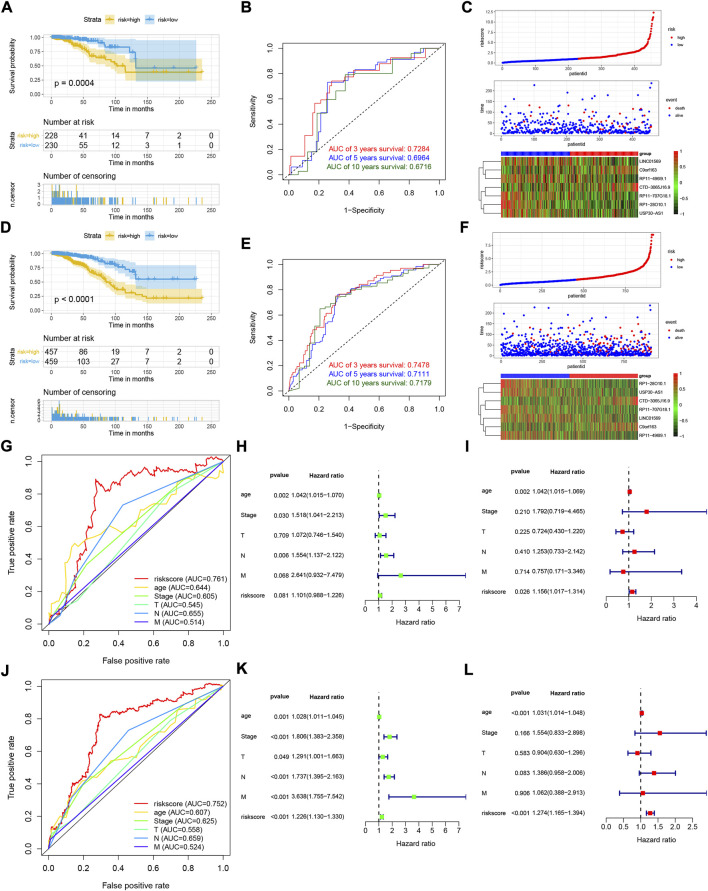
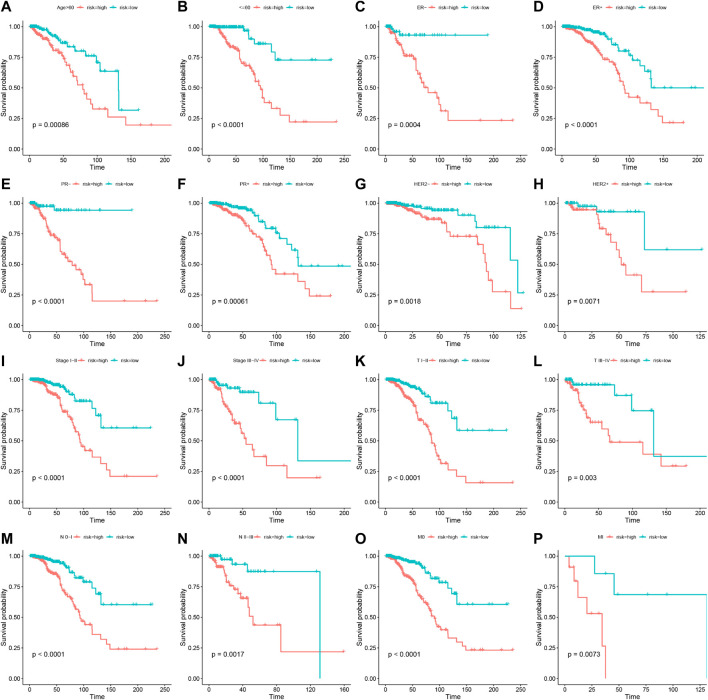
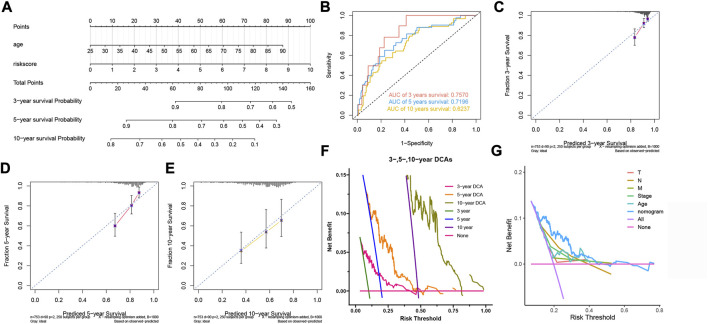
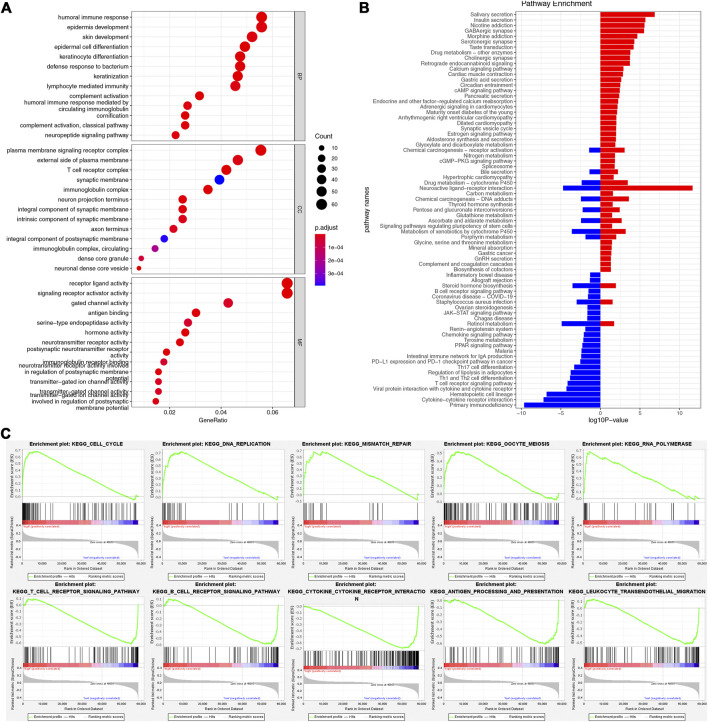
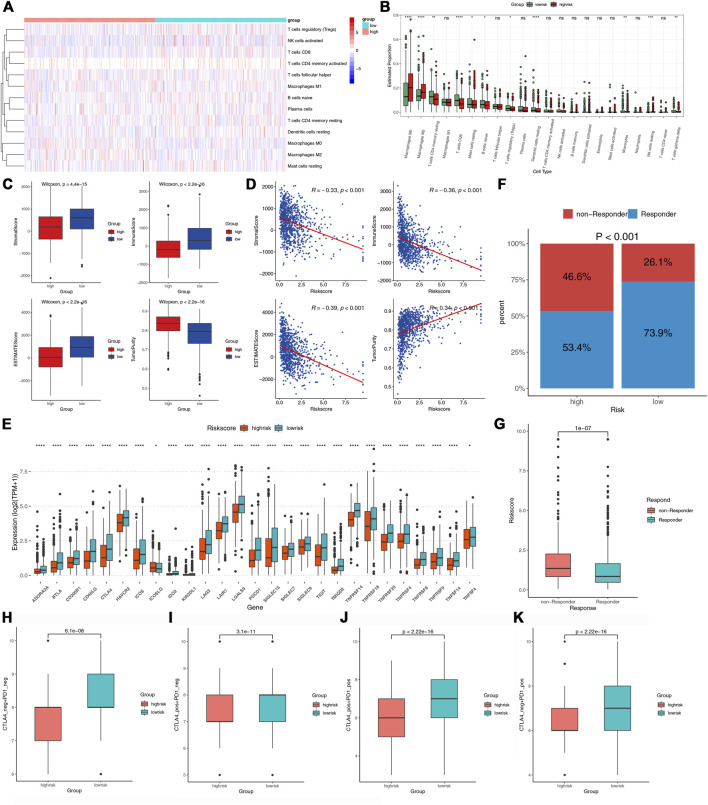
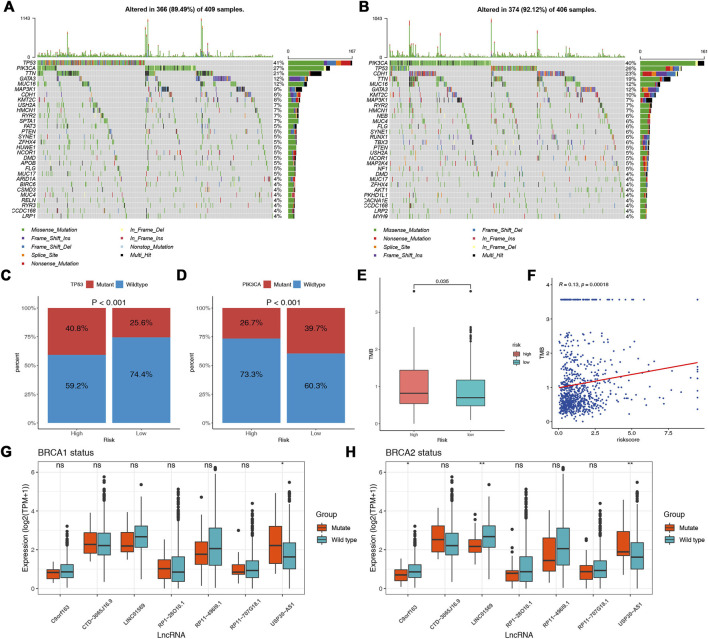
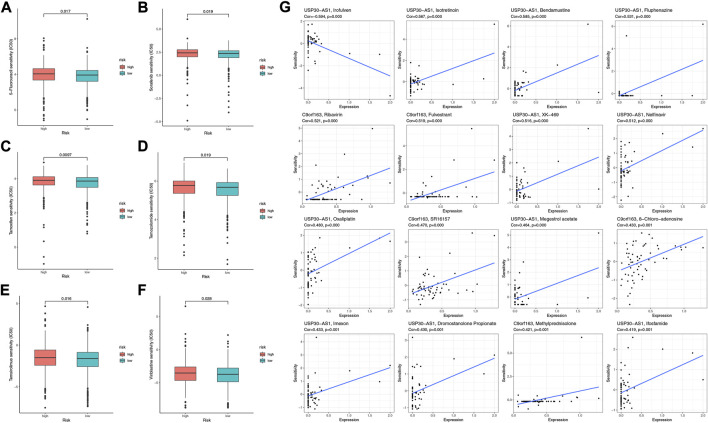
Breast cancer (BC) has the highest incidence rate of all cancers globally, with high heterogeneity. Increasing evidence shows that lactate and long non-coding RNA (lncRNA) play a critical role in tumor occurrence, maintenance, therapeutic response, and immune microenvironment. We aimed to construct a lactate-related lncRNAs prognostic signature (LRLPS) for BC patients to predict prognosis, tumor microenvironment, and treatment responses. The BC data download from the Cancer Genome Atlas (TCGA) database was the entire cohort, and it was randomly assigned to the training and test cohorts at a 1:1 ratio. Difference analysis and Pearson correlation analysis identified 196 differentially expressed lactate-related lncRNAs (LRLs). The univariate Cox regression analysis, least absolute shrinkage and selection operator (LASSO), and multivariate Cox regression analysis were used to construct the LRLPS, which consisted of 7 LRLs. Patients could be assigned into high-risk and low-risk groups based on the medium-risk sore in the training cohort. Then, we performed the Kaplan-Meier survival analysis, time-dependent receiver operating characteristic (ROC) curves, and univariate and multivariate analyses. The results indicated that the prognosis prediction ability of the LRLPS was excellent, robust, and independent. Furthermore, a nomogram was constructed based on the LRLPS risk score and clinical factors to predict the 3-, 5-, and 10-year survival probability. The GO/KEGG and GSEA indicated that immune-related pathways differed between the two-risk group. CIBERSORT, ESTIMATE, Tumor Immune Dysfunction and Exclusion (TIDE), and Immunophenoscore (IPS) showed that low-risk patients had higher levels of immune infiltration and better immunotherapeutic response. The pRRophetic and CellMiner databases indicated that many common chemotherapeutic drugs were more effective for low-risk patients. In conclusion, we developed a novel LRLPS for BC that could predict the prognosis, immune landscape, and treatment response.
Keywords: breast cancer; drug sensitivity; lactate; long non-coding RNA; prognostic signature; tumor immune microenvironment.
Copyright © 2022 Li, Zhang, Li, Wu, Feng, Wang, Liu, Zhang, Cai, Jia, Qiao, Wu and Zhang.
Conflict of interest statement
The authors declare that the research was conducted in the absence of any commercial or financial relationships that could be construed as a potential conflict of interest.
Figures
Similar articles
-
Identification of a novel defined inflammation-related long noncoding RNA signature contributes to predicting prognosis and distinction between the cold and hot tumors in bladder cancer.Front Oncol. 2023 Mar 29;13:972558. doi: 10.3389/fonc.2023.972558. eCollection 2023. Front Oncol. 2023. PMID: 37064115 Free PMC article.
-
Oncogenic signaling pathway-related long non-coding RNAs for predicting prognosis and immunotherapy response in breast cancer.Front Immunol. 2022 Aug 4;13:891175. doi: 10.3389/fimmu.2022.891175. eCollection 2022. Front Immunol. 2022. PMID: 35990668 Free PMC article.
-
Construction of prognostic signature of breast cancer based on N7-Methylguanosine-Related LncRNAs and prediction of immune response.Front Genet. 2022 Oct 24;13:991162. doi: 10.3389/fgene.2022.991162. eCollection 2022. Front Genet. 2022. PMID: 36353118 Free PMC article.
-
Identification of a glycolysis- and lactate-related gene signature for predicting prognosis, immune microenvironment, and drug candidates in colon adenocarcinoma.Front Cell Dev Biol. 2022 Aug 23;10:971992. doi: 10.3389/fcell.2022.971992. eCollection 2022. Front Cell Dev Biol. 2022. PMID: 36081904 Free PMC article.
-
A novel hypoxia- and lactate metabolism-related signature to predict prognosis and immunotherapy responses for breast cancer by integrating machine learning and bioinformatic analyses.Front Immunol. 2022 Oct 7;13:998140. doi: 10.3389/fimmu.2022.998140. eCollection 2022. Front Immunol. 2022. PMID: 36275774 Free PMC article.
Cited by
-
Dissecting the role of lactate metabolism LncRNAs in the progression and immune microenvironment of osteosarcoma.Transl Oncol. 2023 Oct;36:101753. doi: 10.1016/j.tranon.2023.101753. Epub 2023 Aug 6. Transl Oncol. 2023. PMID: 37549606 Free PMC article.
-
Glycolysis-associated lncRNAs in cancer energy metabolism and immune microenvironment: a magic key.Front Immunol. 2024 Sep 13;15:1456636. doi: 10.3389/fimmu.2024.1456636. eCollection 2024. Front Immunol. 2024. PMID: 39346921 Free PMC article. Review.
-
The current advances of lncRNAs in breast cancer immunobiology research.Front Immunol. 2023 Jun 5;14:1194300. doi: 10.3389/fimmu.2023.1194300. eCollection 2023. Front Immunol. 2023. PMID: 37342324 Free PMC article. Review.
-
Lactate-related lncRNAs assessment model predicts the prognosis of pancreatic ductal adenocarcinoma.Sci Rep. 2025 Jul 1;15(1):21226. doi: 10.1038/s41598-025-05486-z. Sci Rep. 2025. PMID: 40594525 Free PMC article.
References
-
- Baker J. H. E., Kyle A. H., Reinsberg S. A., Moosvi F., Patrick H. M., Cran J., et al. (2018). Heterogeneous distribution of trastuzumab in HER2-positive xenografts and metastases: Role of the tumor microenvironment. Clin. Exp. Metastasis 35 (7), 691–705. 10.1007/s10585-018-9929-3 - DOI - PMC - PubMed
LinkOut - more resources
Full Text Sources