Review
. 2022;24(11):3395-3421.
doi: 10.1007/s10530-022-02858-8. Epub 2022 Aug 29.

Identifying, reducing, and communicating uncertainty in community science: a focus on alien species

Affiliations
Review

Identifying, reducing, and communicating uncertainty in community science: a focus on alien species

Anna F Probert et al. Biol Invasions. 2022.

Abstract

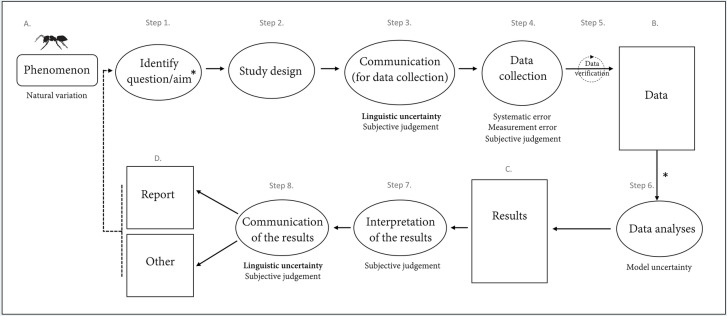
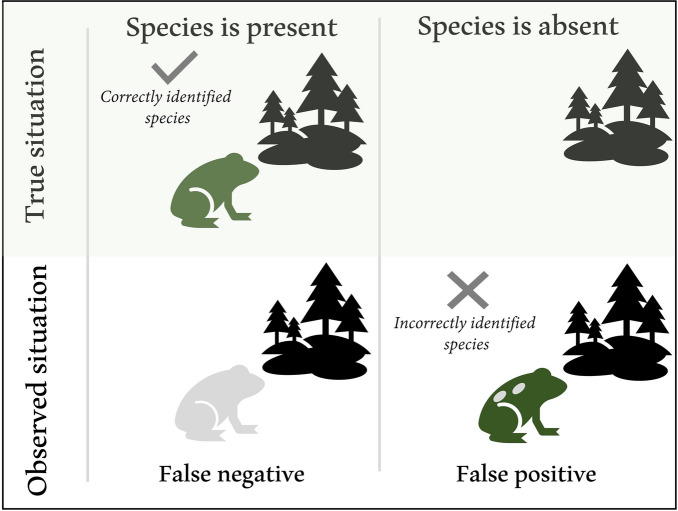
Community science (also often referred to as citizen science) provides a unique opportunity to address questions beyond the scope of other research methods whilst simultaneously engaging communities in the scientific process. This leads to broad educational benefits, empowers people, and can increase public awareness of societally relevant issues such as the biodiversity crisis. As such, community science has become a favourable framework for researching alien species where data on the presence, absence, abundance, phenology, and impact of species is important in informing management decisions. However, uncertainties arising at different stages can limit the interpretation of data and lead to projects failing to achieve their intended outcomes. Focusing on alien species centered community science projects, we identified key research questions and the relevant uncertainties that arise during the process of developing the study design, for example, when collecting the data and during the statistical analyses. Additionally, we assessed uncertainties from a linguistic perspective, and how the communication stages among project coordinators, participants and other stakeholders can alter the way in which information may be interpreted. We discuss existing methods for reducing uncertainty and suggest further solutions to improve data reliability. Further, we make suggestions to reduce the uncertainties that emerge at each project step and provide guidance and recommendations that can be readily applied in practice. Reducing uncertainties is essential and necessary to strengthen the scientific and community outcomes of community science, which is of particular importance to ensure the success of projects aimed at detecting novel alien species and monitoring their dynamics across space and time.

Supplementary information: The online version contains supplementary material available at 10.1007/s10530-022-02858-8.

Keywords: Biodiversity monitoring; Citizen science; Data quality; Epistemic uncertainty; Linguistic uncertainty; Non-native species.


Conflict of interest statement

Conflict of interestThe authors declare no conflict of interest.

Figures

Fig. 1
Fig. 1
Schematic of a generalised scientific process identifying where differences sources of uncertainty emerge in context to community science projects related to alien species. The different steps, or actions, are outlined and encapsulated within ovals, whereas the text in rectangles indicate outcomes generated by the actions. The process begins at A., with the occurrence of some phenomenon (e.g., arrival, spread) of an alien species to be investigated. Sources of uncertainty (Regan et al. 2002) are indicated where they arise across the process: the specific types of epistemic uncertainty are listed and linguistic uncertainty is identified in general. During the communication for both data collection (Step 3) and the results (Step 8), subjective judgement is relevant as it may influence the message made by the communicator(s) and thus the way the recipient audience perceives the information. The asterisks at ‘Identify question/aim’ (Step 1.) and between the ‘Data’ (B.) and ‘Data analyses’ (Step 6.) stages, indicate that for some projects, research questions may be generated post-data collection (e.g., projects that data mine biological databases). The dashed lines represent the potential for information learnt during any stage of the process to be integrated into subsequent actions for longer-term projects allowing the process to become refinements and improvements to be incorporated
Fig. 2
Fig. 2
Two forms of detection error illustrated using an example of an alien frog at a specific location. False negatives (Type II error) occur when an observer does not detect the target species (the “green” frog) that was indeed present, because i) observers are looking in the wrong place (e.g., the species occurs on plant A, but the observer only looks on plant B), or the species is ii) cryptic or hidden, or, iii) incorrectly identified (in our example, the target species is misidentified as another species). False positives (Type I error) occur when an observer incorrectly detects the target species (usually based on a misidentification – here, the “spotted” frog is mistaken for the target species)
Fig. 3
Fig. 3
Detection biases may be accounted for by obtaining information about individual observer’s detection rates. Some observers may be more likely to detect a species. To learn error rates, studies should be designed such that different locations are visited by more than one observer (illustrated by figures of different colours). Not all projects will lend themselves to such a design; there may be few participants and/or participants may be unable to visit multiple locations
Fig. 4
Fig. 4
Illustration of the hierarchical model from Box 1 with parameters ψ=0.3, ϵ01=0.1 and ϵ10=0.7 (dashed vertical lines). A: expected distributions of the number of reported detections at occupied (filled, orange) and not occupied locations (open, black) for m=5 visits per location. B and C: Posterior distributions on ψ (B), ϵ01 (C, black) and ϵ10 (C, orange) for data simulated at L=104 (solid), L=103 (dashed) and L=102 (dotted) locations with m=5 visits each. D: Accuracy of inferring ψ as quantified by the root mean squared deviation (RMSD) of the posterior means of ψ across 100 replicate simulations for different combinations of locations L and visits m for Lm=105 (solid) and Lm=104 (dashed) total number of visits
Fig. 5
Fig. 5
Inferring relative abundances under the models presented in Box 3. AB: Posterior estimates of abundances from data simulated for five visits per location with N1=100 and N2=200 and detection probability p=0.2 (dashed vertical lines). B: Posterior distribution of the relative abundance of N2/N1 from the data of A. CF: Posterior distributions on N0 (C), p0 (D) and the relative abundances ρl (E and F, mean and 90% quantile, true values as orange dots) for each location l under the multi-location relative abundance model outlined in Box 3 and from data simulated with N0=100, σρ2=0.2, p0=-1 and σπ2=0.5 and either L=J=20 (black, E) or L=J=100 (blue, F)
Fig. 6
Fig. 6
Power to identify trends in abundances. Shown are the mean posterior probabilities P(ϕ<1|d,n) given data d conditioned on the total counts n and reflecting the certainty that abundances declined across 1000 replicate simulations for different trends ϕ=0.5, 0.9 or 0.95 as a function of the number of observers that each surveyed a single location with observer-specific detection probabilities and location-specific abundances as described in Box 4

References

    1. Aceves-Bueno E, Adeleye AS, Feraud M, Huang Y, Tao M, Yang Y, Anderson SE. The accuracy of citizen science data: a quantitative review. The Bull Ecol Soc Am. 2017;98(4):278–290. doi: 10.1002/bes2.1336. - DOI
    1. Adriaens T, Gomez G, Maes D. Invasion history, habitat preferences and phenology of the invasive ladybird Harmonia axyridis in Belgium. Biocontrol. 2008;53:69–88. doi: 10.1007/s10526-007-9137-6. - DOI
    1. Adriaens T, Sutton-Croft M, Owen K, Brosens D, van Valkenburg J, Kilbey D, Groom Q, Ehmig C, Thürkow F, Van Hende P, Schneider K. Trying to Engage the Crowd in Recording Invasive Alien Species in Europe: Experiences from Two Smartphone Applications in Northwest Europe. 2015 doi: 10.3391/mbi.2015.6.2.12. - DOI
    1. Aebischer T, Ibrahim T, Hickisch R, Furrer RD, Leuenberger C, Wegmann D. Apex predators decline after an influx of pastoralists in former Central African Republic hunting zones. Biol Cons. 2020;241:108326. doi: 10.1016/j.biocon.2019.108326. - DOI
    1. Azzou AK, S., Singer, L., Aebischer, T., Caduff, M., Wolf, B., & Wegmann, D. A sparse observation model to quantify species distributions and their overlap in space and time. Ecography. 2021;44(6):928–940. doi: 10.1111/ecog.05411. - DOI

LinkOut - more resources