. 2022 Jul;2(7):644-661.
doi: 10.1038/s43587-022-00248-2. Epub 2022 Jul 15.

A computational solution for bolstering reliability of epigenetic clocks: Implications for clinical trials and longitudinal tracking

Affiliations

A computational solution for bolstering reliability of epigenetic clocks: Implications for clinical trials and longitudinal tracking

Albert T Higgins-Chen et al. Nat Aging. 2022 Jul.

Abstract

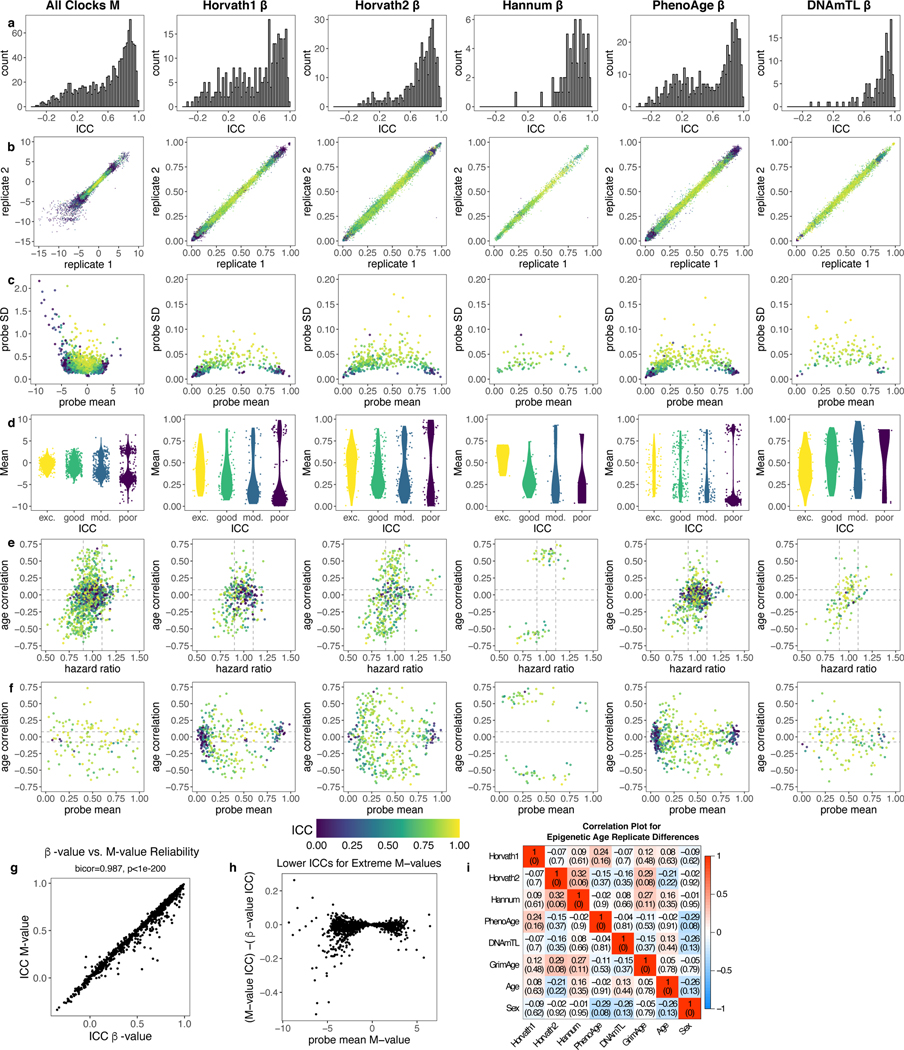
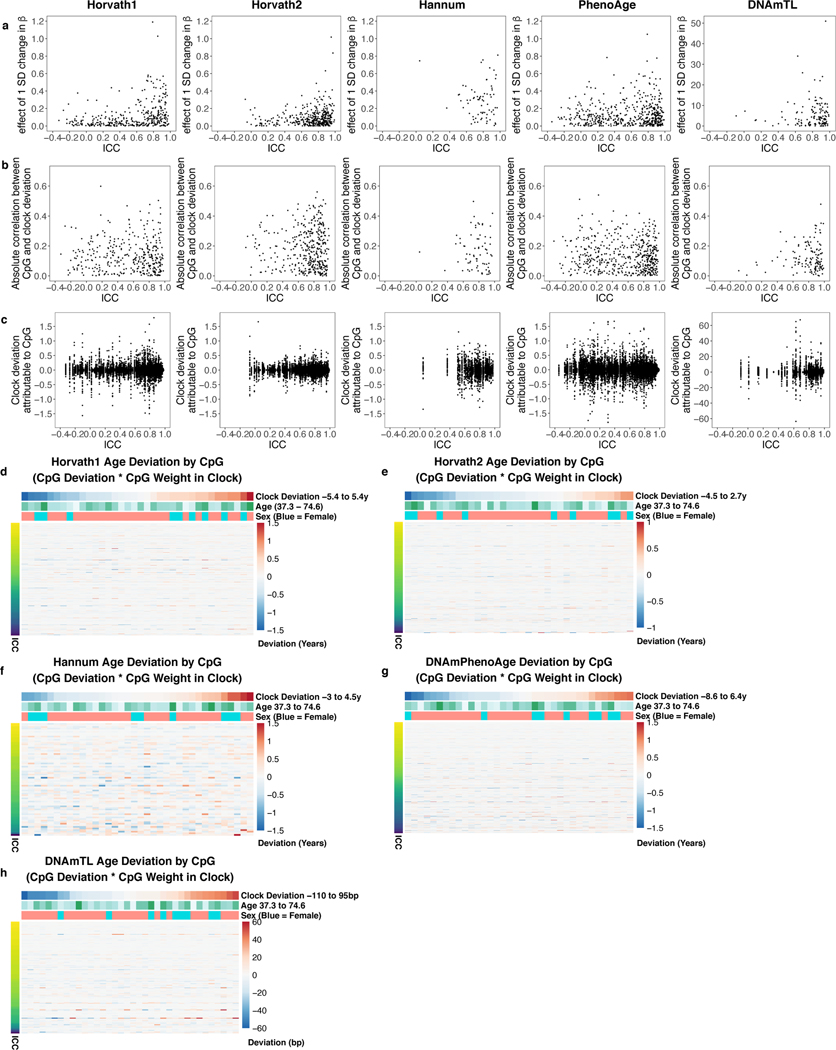
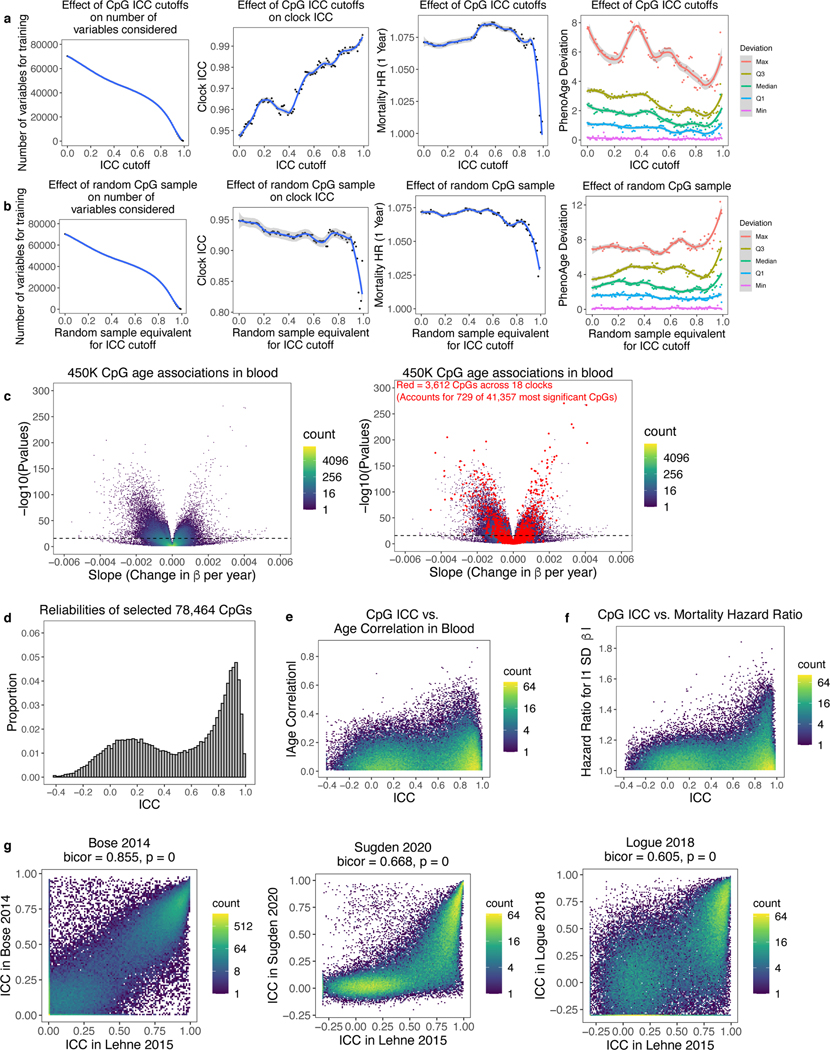
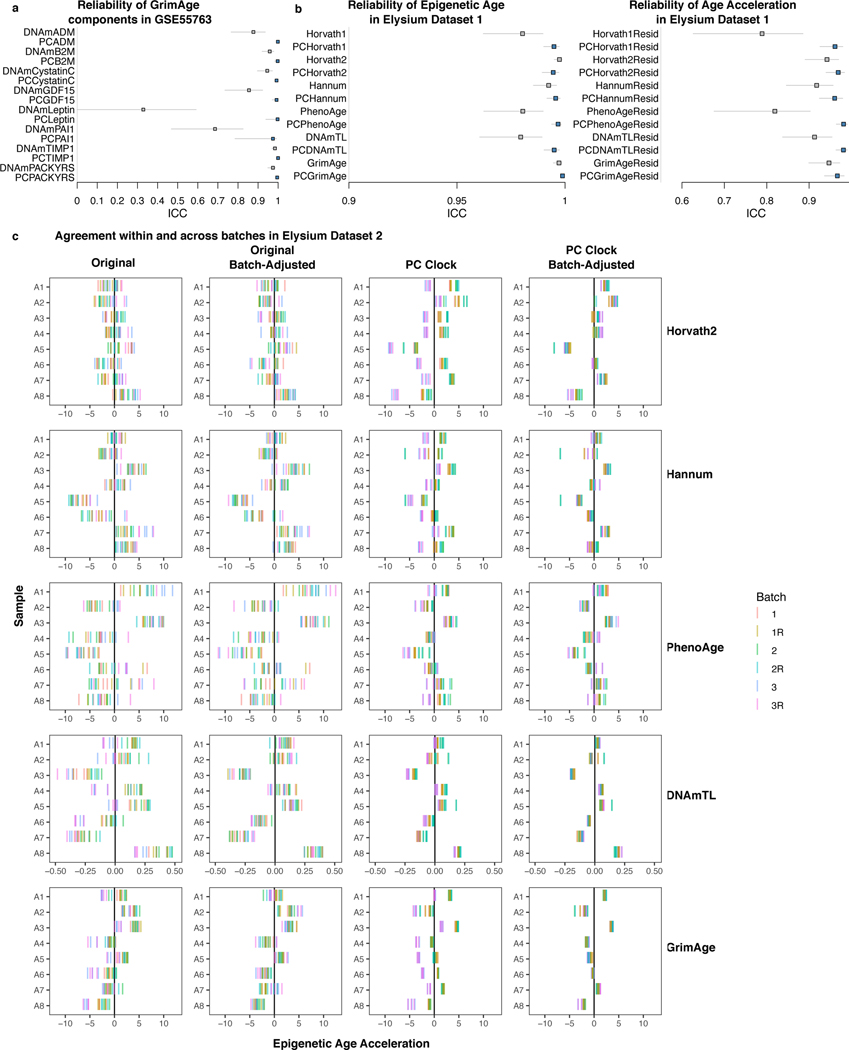
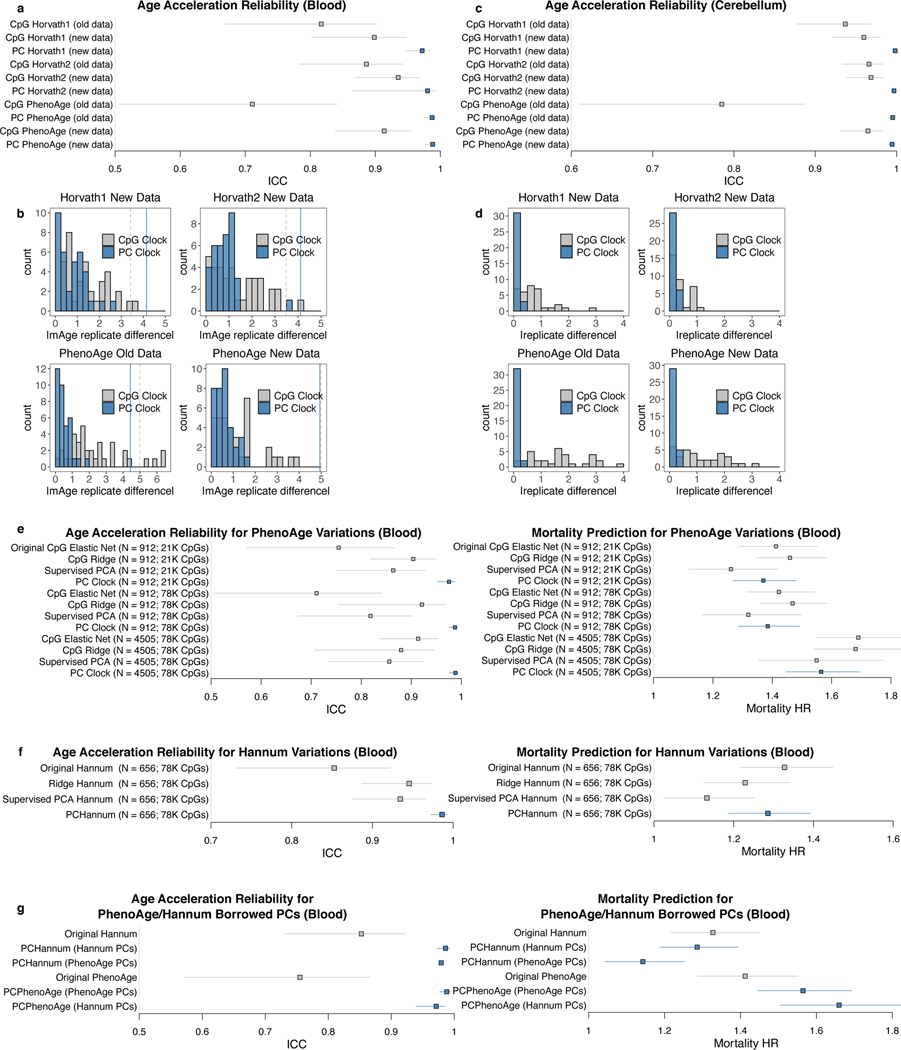
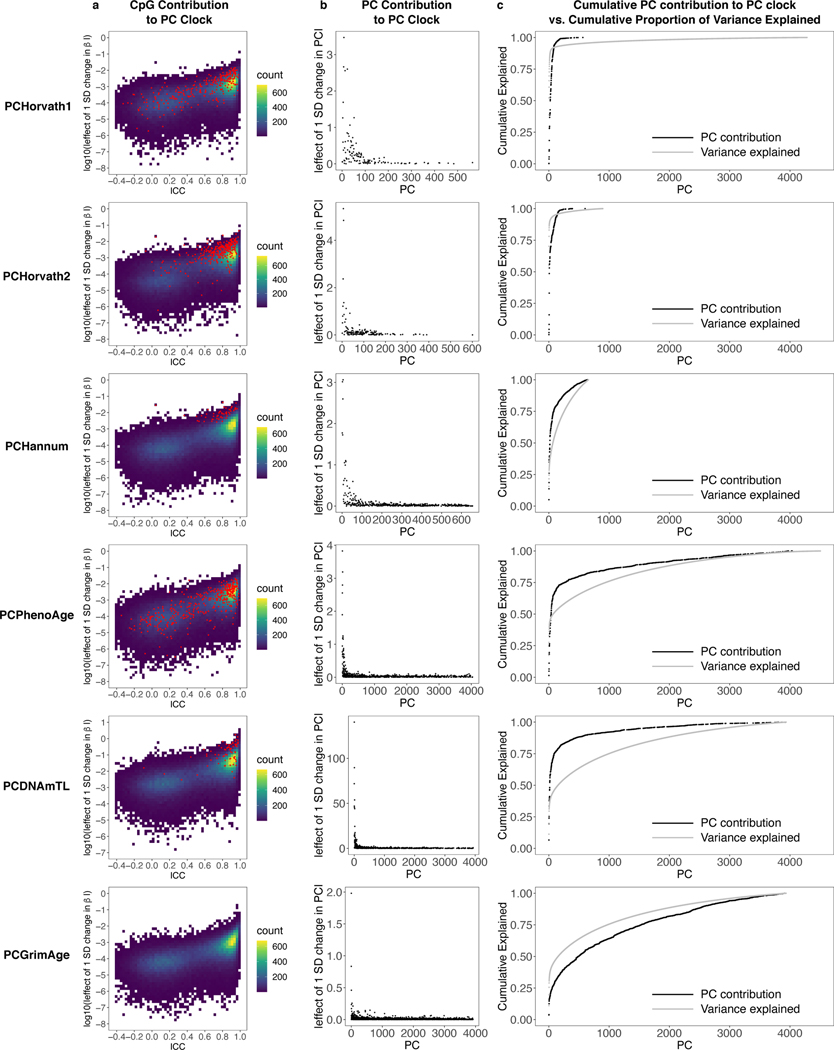
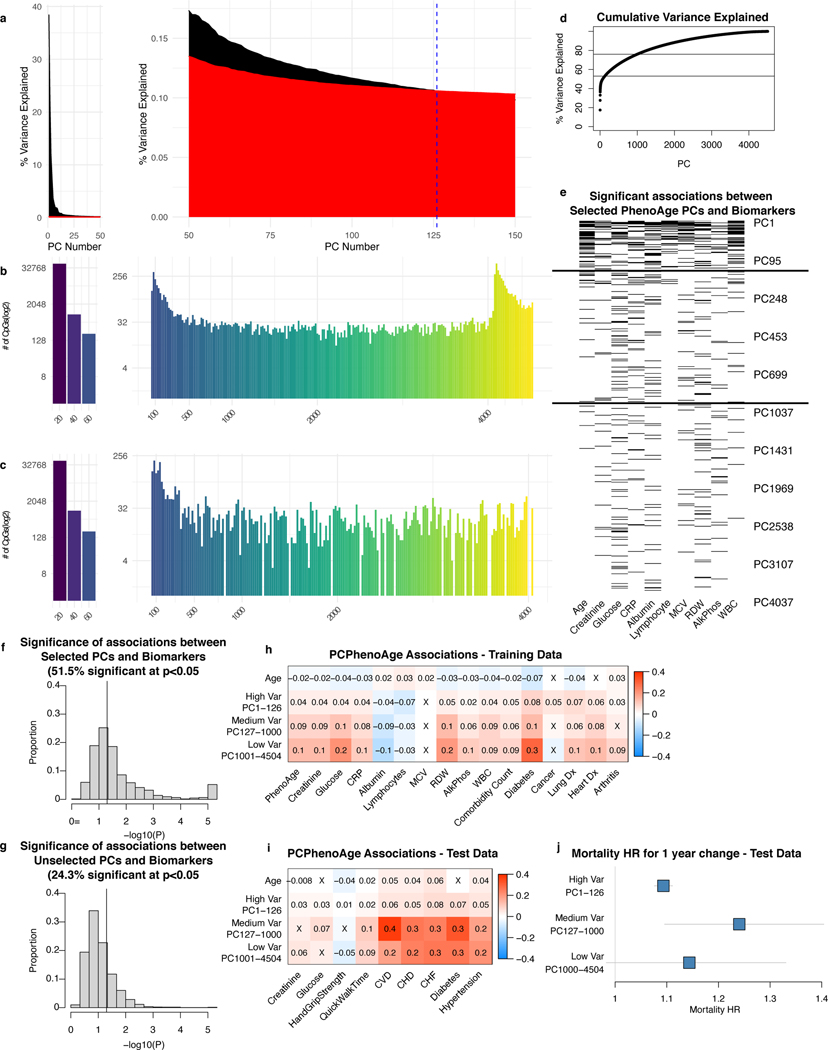
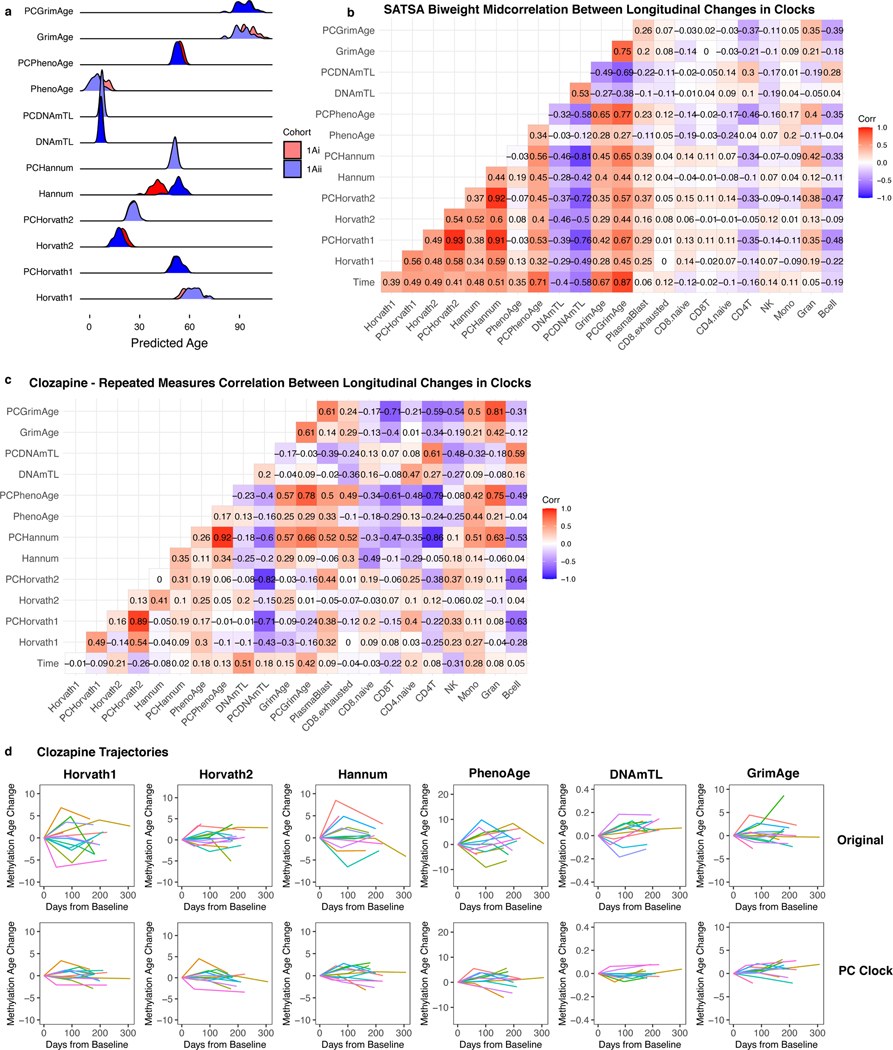
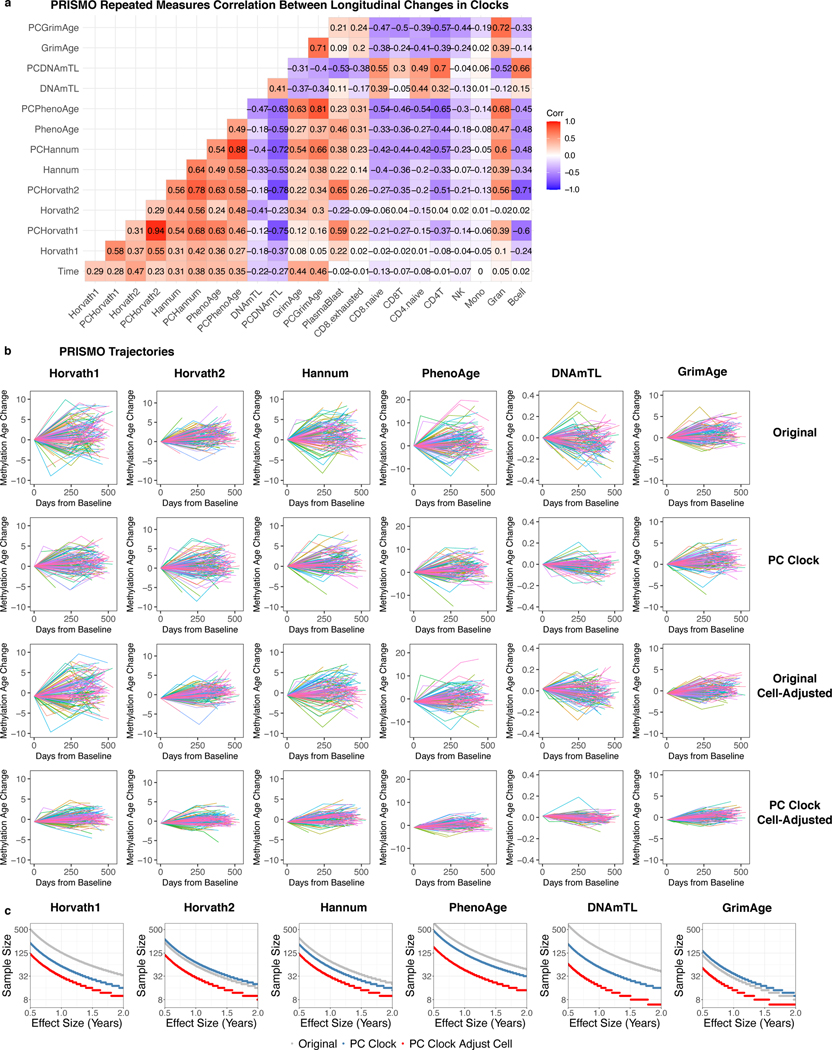
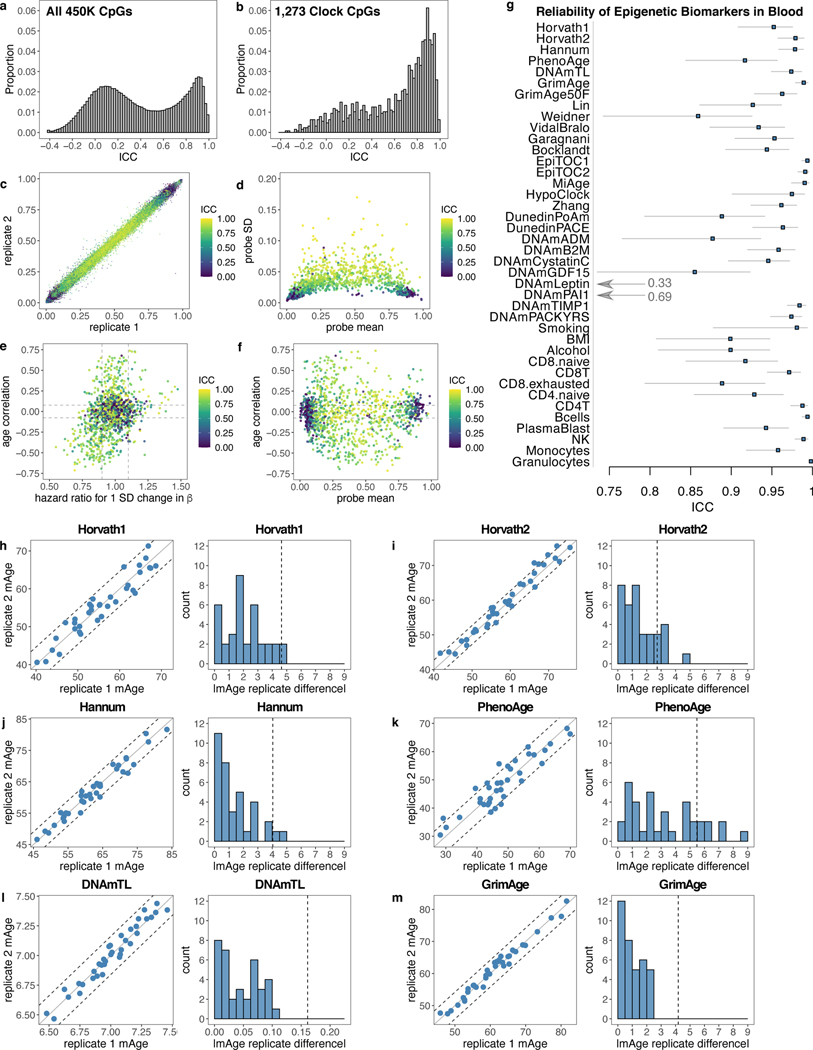
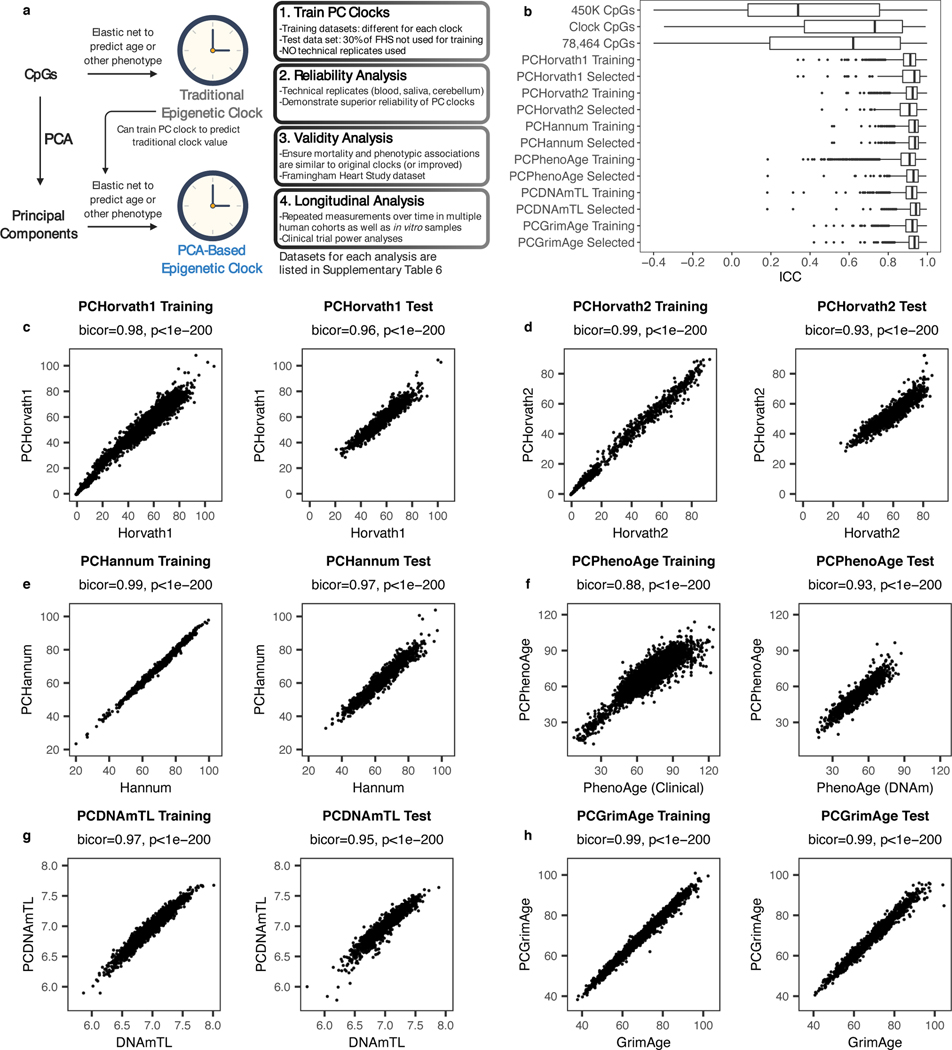
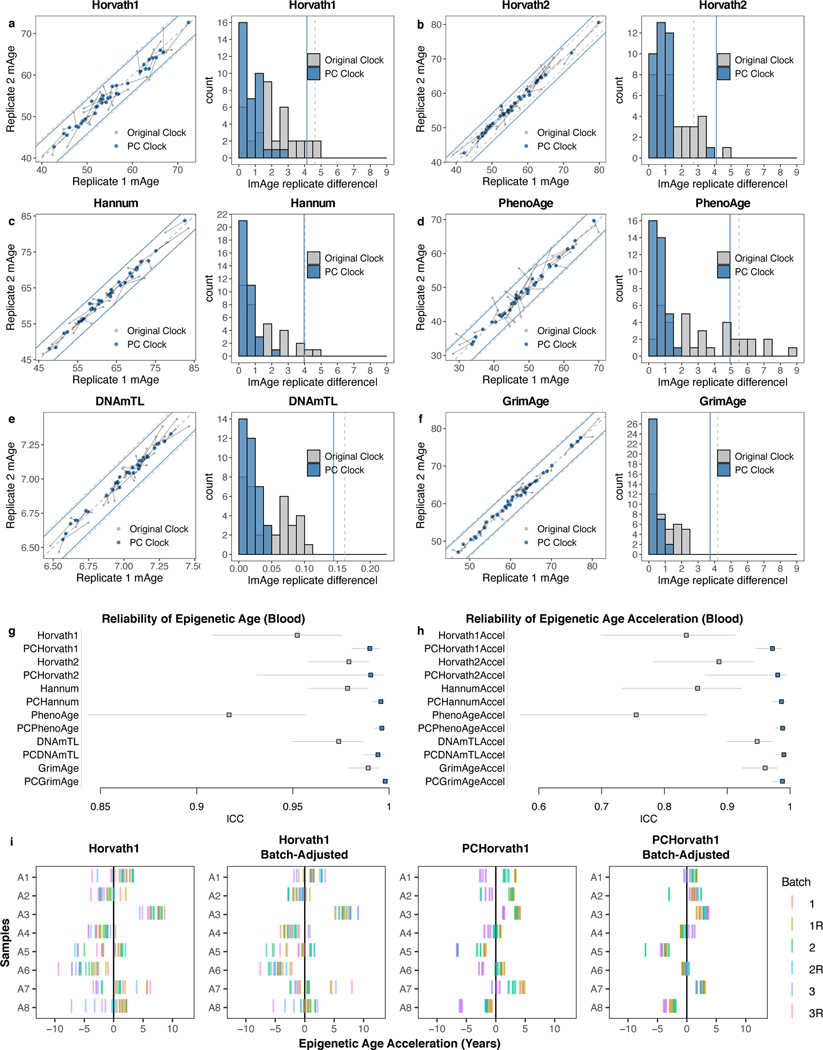
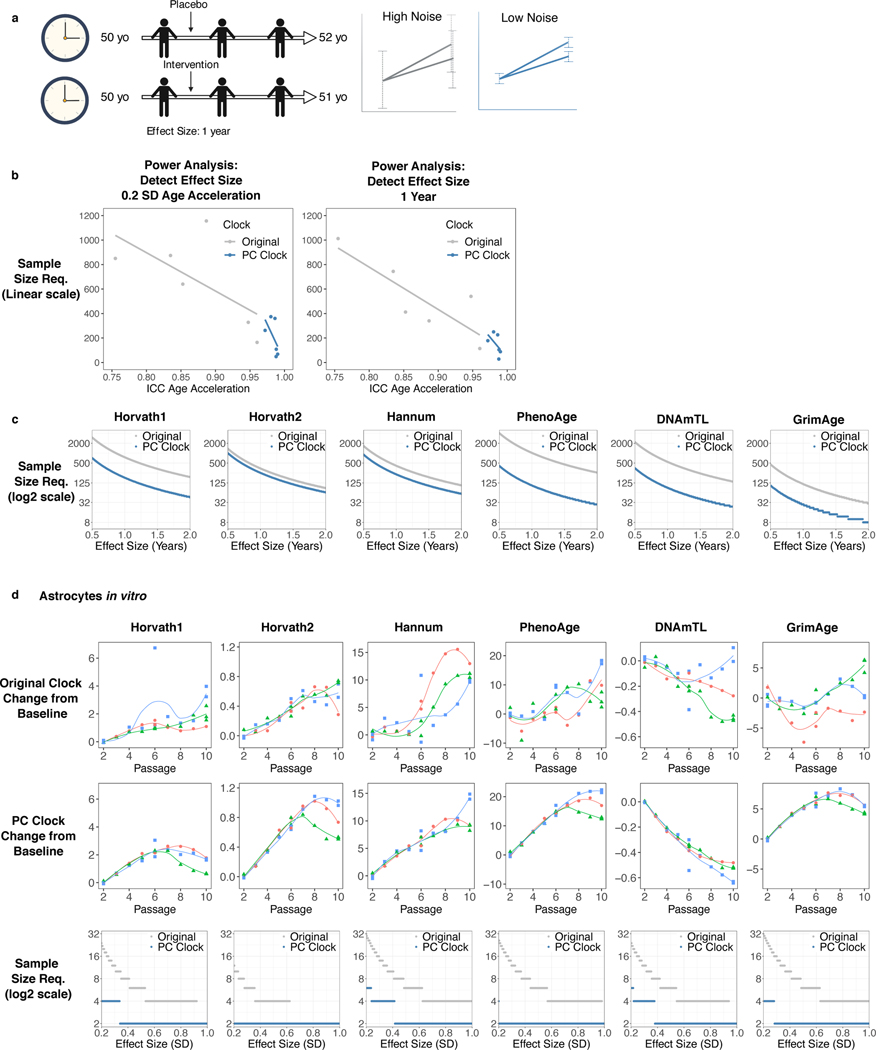
Epigenetic clocks are widely used aging biomarkers calculated from DNA methylation data, but this data can be surprisingly unreliable. Here we show technical noise produces deviations up to 9 years between replicates for six prominent epigenetic clocks, limiting their utility. We present a computational solution to bolster reliability, calculating principal components from CpG-level data as input for biological age prediction. Our retrained principal-component versions of six clocks show agreement between most replicates within 1.5 years, improved detection of clock associations and intervention effects, and reliable longitudinal trajectories in vivo and in vitro. This method entails only one additional step compared to traditional clocks, requires no replicates or prior knowledge of CpG reliabilities for training, and can be applied to any existing or future epigenetic biomarker. The high reliability of principal component-based clocks is critical for applications to personalized medicine, longitudinal tracking, in vitro studies, and clinical trials of aging interventions.

Keywords: aging; biomarker; epigenetic clock; longitudinal analysis; reliability.


Conflict of interest statement

Competing Interests Statement MEL and AHC have built epigenetic aging metrics involving the technology described in the present manuscript, and these metrics are licensed by Elysium Health through Yale University. Elysium provided paired blood and saliva replicate datasets reported in this study, but otherwise did not fund the study and did not play a role in conceptualization, design, decision to publish, or preparation of the manuscript. MEL previously acted as a Scientific Advisor for, and received consulting fees from, Elysium Health, Inc. THS was previously an employee of Elysium Health, Inc. AHC received consulting fees from FOXO Technologies, Inc. for work unrelated to the present manuscript. All other authors report no biomedical financial interests or potential conflicts of interest.

Figures

Extended Data Fig. 1.
Extended Data Fig. 1.. Additional reliability information about clock CpGs.
a-f, Reliability, age correlation, and mortality information for M-values from all clocks and β-values from individual clocks, similar to Fig. 1b-f. ICCs are quantified across 36 samples with 2 technical replicates each. Blood age correlations were calculated in GSE40279. Mortality associations (hazard ratios for 1 SD change in β or M value) were calculated in FHS (n = 3935 with 319 deaths). Shown are histograms of ICC of clock CpGs (a), agreement of technical replicates for CpG values where each point represents one pair of replicates for one CpG (b), and comparisons of ICC values to mean values, standard deviations, age correlations, and mortality associations where each point is one CpG (c-f). g-h, Comparison of M-value and β-value ICCs. Correlation test p-value is based on Student’s t distribution (two-tailed). i, Correlation plot for epigenetic age differences between replicates. Epigenetic age replicate differences were calculated for each clock separately, then the differences were correlated with each other and with age and sex. Data is reported as correlation (p-value). Correlation test p-value is based on Student’s t distribution (two-tailed).
Extended Data Fig. 2.
Extended Data Fig. 2.. Contributions of CpG deviations to clock deviations between replicates.
a, Contribution of each CpG to overall clock measured in years (except DNAmTL which is measured in base pairs), calculated as weight in clock multiplied by 1 SD in beta value in GSE55763. Each point represents one CpG. b, Correlation of each CpG’s deviation with clock deviation between replicates. Each point represents one CpG. c, Deviation of each CpG multiplied by the CpG weight. Each point represents one CpG for one pair of replicates. d-h, Heatmap of clock deviations attributable to each CpG (CpG deviation multiplied by CpG weight in clock), separated by sample. Rows are CpGs and columns are samples. Clock deviations are measured in years (except DNAmTL which is measured in base pairs).
Extended Data Fig. 3.
Extended Data Fig. 3.. Many CpGs show associations with age and mortality that could be used by clocks.
a, Filtering out CpGs by ICC leads to modest improvements in clock reliability. PhenoAge has a low ICC yet high mortality prediction, and thus we tested whether ICC could be improved without jeopardizing the latter. 100 models with ICC cutoff 0–0.99 were generated to predict PhenoAge in InCHIANTI when limiting CpGs to those above the ICC cutoff. The resulting epigenetic age ICCs (calculated in 36 pairs of technical replicates) and mortality prediction in test data (n = 3935 with 319 deaths) were visualized. b, Similar to a, except using a random CpG subset selection with an equivalent number of CpGs. c, Volcano plots showing the age associations in blood (GSE40279; 450K array). Red indicates CpGs present in any of 18 existing clocks. Significance was assessed with a two-sided t-test, and the dotted line indicates genome-wide significance calculated by Bonferroni correction (p = 1.057 × 10⁻⁷). d, ICCs for 78,464 CpGs present across all datasets and the 450K and EPIC arrays, listed in Supplementary Table 6. ICCs were calculated in 36 pairs of technical replicates. e-f, Age and mortality correlations for CpG ICCs for selected 78,464 CpGs. Age correlation was calculated in GSE40279, and mortality hazard ratio was calculated in the Framingham Heart Study after adjusting for age and sex. g, Comparison of the 78,464 CpG ICCs to previously published ICC values. Lehne 2015: 450K array, age range 37.3–74.6. Bose 2014: 450K array, age range 45–64. Sugden 2020: 450K and EPIC, age range 18–18. Logue 2018: EPIC array, mean age 31.8 and SD 8.4. Since Bose 2014 published ICCs with floor value of 0, we changed all Lehne 2015 CpGs with ICC<0 to ICC=0 to make comparisons consistent. For Sugden 2020 or Logue 2018, we adjusted the floor to −0.3 for presentation purposes. Correlation test p-value is based on Student’s t distribution (two-tailed).
Extended Data Fig. 4.
Extended Data Fig. 4.. Additional reliability data on PC clocks in blood.
a, Reliability of GrimAge and PCGrimAge components calculated using 36 pairs of technical replicates (GSE55763). Data are presented as ICC estimates with 95% confidence interval. b, Reliability of epigenetic age and age acceleration in an independent blood DNAm dataset with 37 pairs of technical replicates (Elysium Dataset 1). Data are presented as ICC estimates with 95% confidence interval. c, PC clocks allow for correction for systemic offsets in epigenetic age across batches. Epigenetic age acceleration is shown for 8 individuals with 18 measurements (across 3 batches, 2 scans, and 3 replicates per batch) in Elysium Dataset 2.
Extended Data Fig. 5.
Extended Data Fig. 5.. Enhanced reliability of PC clocks does not depend on new training data.
a-b, Age acceleration ICC and replicate differences (n = 36 pairs of technical replicates) for Horvath1, Horvath2, and PhenoAge in blood trained using new data (including substitute datasets). Data are presented as ICC estimate with 95% confidence interval. c-d, Same as a-b, for cerebellum (n = 34 pairs of technical replicates). Data are presented as ICC estimate with 95% confidence interval. e-f, Age acceleration reliability in GSE55763 (n = 36 pairs of technical replicates) and mortality prediction in FHS (n = 3935 with 319 deaths) for variations of PhenoAge (e) and Hannum (f) calculated using different CpG sets, sample sizes, and different methods (elastic net, ridge regression, supervised PCA, PC clocks). Data are presented as ICC or HR (1 SD change) estimates with 95% confidence interval. g, PCs from one dataset can be projected to a second dataset for elastic net regression and used to construct reliable PC clocks. PCA was performed in the Hannum GSE40279 dataset then projected to the PhenoAge HRS/InCHIANTI dataset for elastic net regression, and vice versa. These “borrowed” PCs could still be used to reliable age predictors. We plotted age acceleration reliability in GSE55763 (n = 36 pairs of technical replicates) and mortality prediction in FHS (n = 3935 with 319 deaths). Data are presented as ICC or HR (1 SD change) estimates with 95% confidence interval.
Extended Data Fig. 6.
Extended Data Fig. 6.. Contribution of CpGs and PCs to PC clocks.
a, The effect of a 1 SD change in beta for each CpG on the PC clocks. This was calculated by multiplying the CpG loadings for each PC by the PC weight in the clock, summing these products for each CpG, and multiplying by CpG standard deviation from the GSE55763. Effects are shown on a log base 10 scale. Note that results were similar using standard deviations from the PC clock training data. CpGs present in the original clock are denoted in red. b, Effect of 1 SD change in PC score for each PC on the overall clock. c, Cumulative sum of 1 SD changes in PC scores for each PC (black), plotted against cumulative variance explained for each PC in the original training data (grey).
Extended Data Fig. 7.
Extended Data Fig. 7.. Low-variance PCs capture aging heterogeneity in physiological systems.
a, Scree plots showing variance explained by PC for PCPhenoAge in training data (black) compared to variance explained for a randomized matrix of the same size as PCPhenoAge training data (red), for the top 150 PCs (split into two graphs for visualization purposes). b-c, Number of new driver CpGs introduced by each PC for all PCs (b) and PCs included in the model (c). d, Cumulative variance plot for PCPhenoAge. e, Plot showing significant univariate linear associations between PhenoAge components and PCPhenoAge PCs, with PCs ordered from highest to lowest variance explained. These were not adjusted for multiple testing as the PCs are meant to be combined by elastic net regression. For d and e, the horizontal lines delineate the selected cutoffs for high-, medium-, and low-variance PCs. f-g, Histograms of the association significance for selected PCPhenoAge PCs (f) and unselected PCs (g), with values reported as -log10(p-value), with significance determined by two-sided t-test, not adjusted for multiple testing. Vertical lines denote p = 0.05. For each PC, we selected the most significant p-value out of the 10 PhenoAge components. h-i, PCPhenoAge was divided into components corresponding to the signal from high-, medium-, and low-variance PCs in both HRS training data (h) and FHS test data (i). Multivariate associations between biomarkers and disease status are shown. Biomarkers were standardized (Z-scores) and modeled using linear regression. Disease status was binary and modeled with logistic regression. PCPhenoAge components were in units of 1 year. For example, a 1-year increase in PCPhenoAge due to medium-variance PCs was associated with a 0.1 SD increase in creatinine in training data and a 0.06 SD increase in test data. Non-significant correlations are denoted by “X”. j, Mortality hazard ratios for a 1-year change in PCPhenoAge components from high-, medium-, and low-variance PCs are shown (n = 3935 with 319 deaths). Data are presented as HR estimate with 95% confidence interval.
Extended Data Fig. 8.
Extended Data Fig. 8.. PC clocks show improved agreement in cerebellum technical replicates and increased stability in longitudinal blood DNAm data.
a, Ridge plot demonstrating the distributions of clock values for cerebellum technical replicates (GSE43414). b, Biweight midcorrelation between longitudinal changes in clocks for SATSA. c, Repeated measures correlations in longitudinal change in clocks for clozapine dataset. d, Short-term longitudinal blood DNAm data was measured with up to 300 days follow-up after initiation of clozapine. Each line shows the trajectory of an individual’s epigenetic age relative to their baseline during the follow-up period.
Extended Data Fig. 9.
Extended Data Fig. 9.. PC clocks allow for correction for short-term cell composition shifts.
a, Repeated measures correlations in longitudinal change in clocks for PRISMO dataset. b, Short-term longitudinal blood DNAm data was measured with up to 500 days follow-up in the PRISMO dataset. Each line shows the trajectory of an individual’s epigenetic age relative to their baseline during the follow-up period. Cell-adjusted trajectories were adjusted based on proportions of 5 cell types imputed from DNAm data most correlated with the clocks (granulocytes, plasmablasts, B, CD4T, and CD8T cells). c, Power analysis for a trial evaluating an intervention in a young population to protect from stress-induced pathological aging, based on parameters estimated from the PRISMO study. The red line indicates epigenetic age adjusted for longitudinal changes in granulocytes, plasmablasts, B, CD4T, and CD8T cells.
Fig. 1.
Fig. 1.. Low reliability of CpGs reduces reliability of epigenetic age prediction.
a, ICCs for all 450K CpGs, analyzed in 36 pairs of technical replicates in blood (GSE55763). b, Intraclass correlation coefficients (ICCs) for 1,273 CpGs in the Horvath1, Horvath2, Hannum, PhenoAge, or DNAmTL clocks. c, Clock CpG ICCs versus beta values for all samples. Each point corresponds to one pair of replicates for one CpG. d-f, Comparisons of clock CpG ICCs to CpG mean beta value, standard deviation, age correlation (in GSE40279), and mortality hazard ratio (in the Framingham Heart Study, after adjusting for age and sex). Each point corresponds to one CpG. g, ICCs for epigenetic biomarkers (raw score not adjusted for age), calculated from 36 pairs of technical replicates in blood (GSE55763). Data are presented as ICC estimate with 95% confidence interval. ICCs for biomarkers adjusted for age are listed in Supplementary Table 4. GrimAge50F is GrimAge setting age to 50 and sex to female for all samples. h-m, Scatterplots and histograms for deviations between replicates for each clock. In scatterplots, each point corresponds to one sample, center line indicates perfect agreement, dashed lines indicate agreement within 1 SD of age acceleration. Histograms show absolute deviation between technical replicates, with 1 SD of age acceleration denoted by dotted grey line calculated in the Framingham Heart Study.
Fig. 2.
Fig. 2.. Epigenetic clocks trained from principal components.
a, Strategy for training PC clocks compared to traditional epigenetic clocks. Datasets can be found in Supplementary Table 6. Image created with Biorender.com. b, ICC distributions for PCs in test data compared to CpGs, calculated using 36 pairs of technical replicates in blood. In box-and-whisker plots, boxes correspond to IQR, and whiskers extend to 1.5 x IQR. Outliers are shown as individual points. c-h, Correlations between the original clocks and their PC clock proxies in both training and test data. Test data shown is the Framingham Heart Study methylation data for all clocks, using samples that were not used to train PCDNAmTL or PCGrimAge. Correlation test p-values based on Student’s t distribution (two-tailed) are provided, without multiple testing correction.
Fig. 3.
Fig. 3.. Epigenetic clocks trained from principal components are highly reliable.
a-f, Epigenetic clock agreement between technical replicates in blood test data (GSE55763). Grey indicates the original clock while blue indicates the PC clock. In scatterplots, lines connect the same pair of samples as measured by the original clock and the corresponding PC clock. Also, each point corresponds to one sample, center line indicates perfect agreement, and peripheral grey and blue lines indicate agreement within 1 SD of age acceleration. Histograms show absolute deviation between technical replicates, with 1 SD of age acceleration denoted by grey and blue lines calculated in the Framingham Heart Study. g-h, ICCs for epigenetic clock scores without residualization (g) and epigenetic age acceleration (h) in GSE55763. Data are presented as ICC estimate with 95% confidence interval. Note that for PCHorvath2, the lower bound is decreased substantially by a single outlier. i, Horvath1 epigenetic clock agreement between 18 technical replicates (3 batches, 3 replicates per batch, 2 scans per batch) for 8 samples, before and after batch correction. Other clocks are shown in Extended Data Fig. 4c. Batch correction was performed using a linear model using batch as a categorical variable.
Fig. 4.
Fig. 4.. Information requirements for age and mortality prediction.
PCHorvath1 and PCPhenoAge were re-trained using varying numbers of CpGs (randomly selected), PCs (consecutive top-ranked by variance), or sample sizes (for PCA, elastic net regression, or both). The resulting epigenetic age ICCs and age acceleration ICCs (calculated in 36 pairs of technical replicates), as well as age correlation and mortality prediction in test data (n = 3935 with 319 deaths) were visualized. Though we did not repeat each iteration multiple times with different random samples, we performed sufficient iterations to visualize the variation between models as well as the general trend as the number of variables increases. For example, a random sample of N=100 is similar to a sample of N=105. A LOESS smoothing function was used to plot the overall trend. Note that the x-axes are on a log base 2 scale.
Fig. 5.
Fig. 5.. PC clocks are reliable in saliva and brain.
a, The original clocks and corresponding PC clocks were calculated for 8 saliva samples with 18 technical replicates each (3 batches, 3 replicates per batch, 2 scans per batch). Note that we did not plot standard deviation of epigenetic age acceleration because there were insufficient samples to reliably calculate this value, and we found that much of the variation in the original clocks stemmed primarily from noise. b, Clock ICC values derived for 8 saliva samples with 18 technical replicates each, treating each batch and scan separately. Data are presented as ICC estimate with 95% confidence interval. c, Agreement between technical replicates in cerebellum test data (GSE43414). Because of a systematic shift in epigenetic age between replicates, mean-centered epigenetic age values were used for both the original clocks and PC clocks. Grey indicates the original clock while blue indicates the PC clock. In scatterplots, grey lines connect the same pair of samples as measured by the original clock and the corresponding PC clock. d, Clock ICC values derived from 34 pairs of technical replicates in cerebellum. Data are presented as ICC estimate with 95% confidence interval.
Fig. 6.
Fig. 6.. PC clocks preserve relevant aging and mortality signals.
a, Correlation between age acceleration values for original and PC clocks in Framingham Heart Study (FHS) blood data. b, Mortality hazard ratios were calculated in FHS after adjusting for chronological age and sex, n = 3935 with 319 deaths. Data are presented as HR estimate with 95% confidence interval. c, Correlations with various traits were calculated in FHS after adjusting for chronological age and sex. Note that GrimAge was trained to predict smoking, serum proteins, and mortality in FHS, and therefore associations are elevated compared to other clocks due to overfitting. d-e, Relative telomere length was compared to DNAmTL and PCDNAmTL for passaged fibroblasts from adults (d) and children (e). Each regression line refers to one biological replicate where the same cell line was measured at multiple passages. Some cell lines were utilized for multiple biological replicates. For each cell line, the age of the donor when the cell line was isolated is shown in the legend. Correlation test p-values are based on Student’s t distribution (two-tailed) without multiple testing correction.
Fig. 7.
Fig. 7.. PC clocks show trajectories with improved stability in longitudinal data.
(a-f) Each line shows the trajectory of an individual’s epigenetic age relative to their baseline during the follow-up period. Colors are included primarily to help distinguish between different individuals. (g) Repeated measures correlation to compare longitudinal changes in each clock and cell composition estimates. (h) ICC values reflecting within-individual variance relative to total variance for each clock, n = 941 measurements for 294 individuals (2–5 measurements per individual). Data are presented as ICC estimate with 95% confidence interval.
Fig. 8.
Fig. 8.. PC clocks reduce sample size requirements for clinical trials and in vitro assays.
a, Design of a randomized controlled trial lasting 2 years to target epigenetic aging through an intervention. Biomarkers with reduced noise are more sensitive to effects on epigenetic age. Image created with Biorender.com. b-c, Power analysis for a trial evaluating an intervention in an aging population, based on parameters estimated from the SATSA study (Fig. 7). b, Relationship between reliability and sample size requirements (linear scale) for a given effect size. c, Relationship between effect size (in years) and sample size requirements (log2 scale) for each clock. d, DNAm from astrocytes was measured at every passage in cell culture for 3 replicates. Each curve shows the trajectory of one replicate over time from baseline. Zero on the y-axis is defined as the mean between the replicates at the first DNAm measurement. Power analysis was performed using parameters estimated from the first 6 passages, with plots showing the relationship between effect size (in SD) and sample size requirements (log2 scale).

References

    1. Jylhävä J, Pedersen NL & Hägg S. Biological Age Predictors. EBioMedicine 21, 29–36 (2017). - PMC - PubMed
    1. Bell CG et al. DNA methylation aging clocks: Challenges and recommendations. Genome Biol. 20, 249 (2019). - PMC - PubMed
    1. Horvath S. & Raj K. DNA methylation-based biomarkers and the epigenetic clock theory of ageing. Nat. Rev. Genet. 19, 371–384 (2018). - PubMed
    1. Sugden K. et al. Patterns of Reliability: Assessing the Reproducibility and Integrity of DNA Methylation Measurement. Patterns 1, 100014 (2020). - PMC - PubMed
    1. Logue MW et al. The correlation of methylation levels measured using Illumina 450K and EPIC BeadChips in blood samples. Epigenomics 9, 1363–1371 (2017). - PMC - PubMed

Publication types