

Predicting infectious disease for biopreparedness and response: A systematic review of machine learning and deep learning approaches
- PMID: 36277100
- PMCID: PMC9582566
- DOI: 10.1016/j.onehlt.2022.100439
Predicting infectious disease for biopreparedness and response: A systematic review of machine learning and deep learning approaches
Abstract
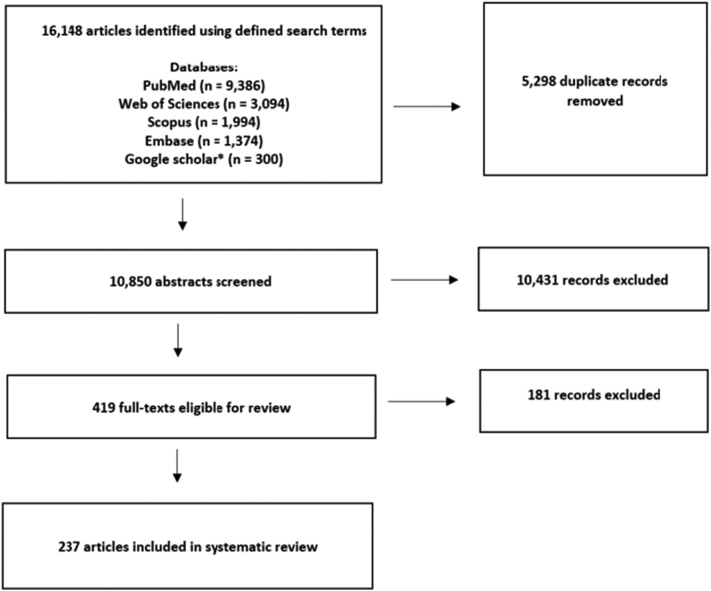
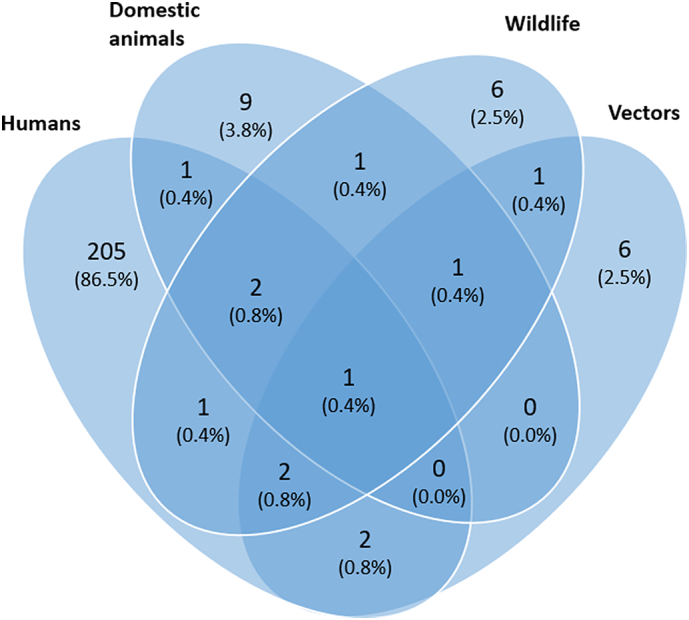
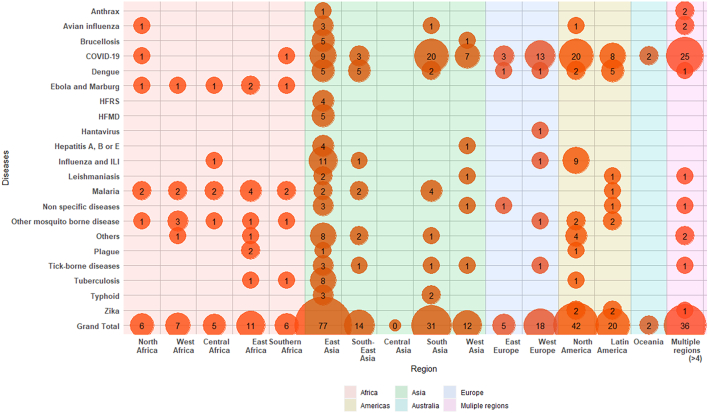
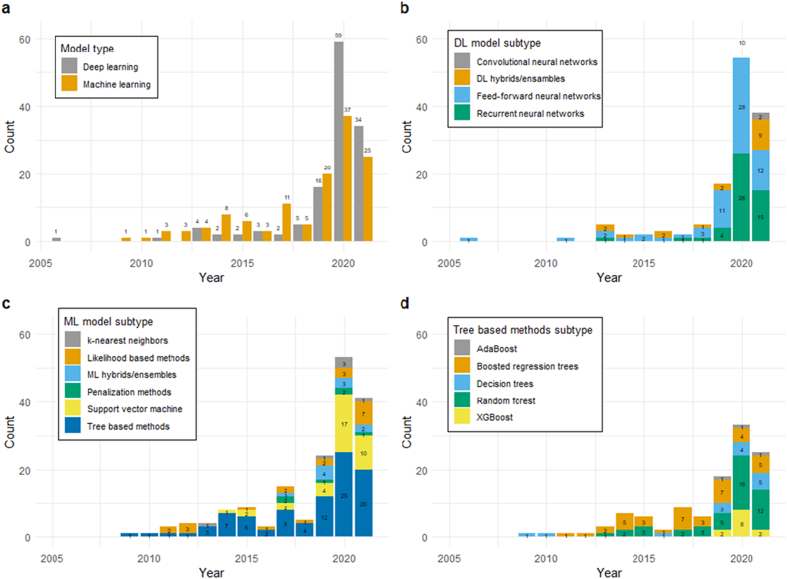
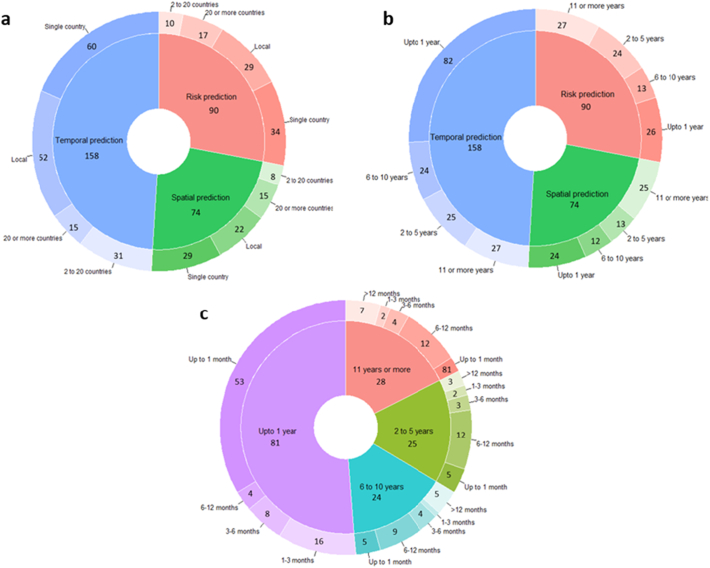
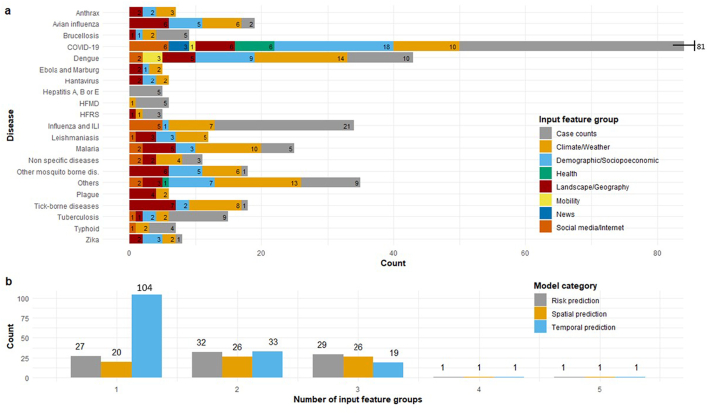
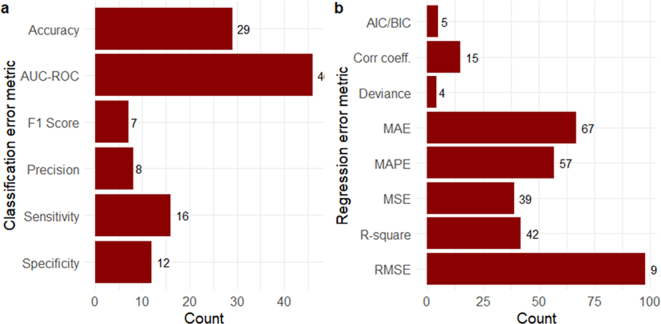
The complex, unpredictable nature of pathogen occurrence has required substantial efforts to accurately predict infectious diseases (IDs). With rising popularity of Machine Learning (ML) and Deep Learning (DL) techniques combined with their unique ability to uncover connections between large amounts of diverse data, we conducted a PRISMA systematic review to investigate advances in ID prediction for human and animal diseases using ML and DL. This review included the type of IDs modeled, ML and DL techniques utilized, geographical distribution, prediction tasks performed, input features utilized, spatial and temporal scales, error metrics used, computational efficiency, uncertainty quantification, and missing data handling methods. Among 237 relevant articles published between January 2001 and May 2021, highly contagious diseases in humans were most often represented, including COVID-19 (37.1%), influenza/influenza-like illnesses (9.3%), dengue (8.9%), and malaria (5.1%). Out of 37 diseases identified, 51.4% were zoonotic, 37.8% were human-only, and 8.1% were animal-only, with only 1.6% economically significant, non-zoonotic livestock diseases. Despite the number of zoonoses, 86.5% of articles modeled humans whereas only a few articles (5.1%) contained more than one host species. Eastern Asia (32.5%), North America (17.7%), and Southern Asia (13.1%) were the most represented locations. Frequent approaches included tree-based ML (38.4%) and feed-forward neural networks (26.6%). Articles predicted temporal incidence (66.7%), disease risk (38.0%), and/or spatial movement (31.2%). Less than 10% of studies addressed uncertainty quantification, computational efficiency, and missing data, which are essential to operational use and deployment. This study highlights trends and gaps in ML and DL for ID prediction, providing guidelines for future works to better support biopreparedness and response. To fully utilize ML and DL for improved ID forecasting, models should include the full disease ecology in a One-Health context, important food and agricultural diseases, underrepresented hotspots, and important metrics required for operational deployment.
Keywords: Deep learning; Disease forecast; Disease prediction; Infectious diseases; Machine learning; Systematic review.
© 2022 Battelle Memorial Institute.
Conflict of interest statement
The authors declare that they have no competing interests.
Figures

References
-
- Heesterbeek H., Anderson R.M., Andreasen V., Bansal S., DeAngelis D., Dye C., Eames K.T.D., Edmunds W.J., Frost S.D.W., Funk S., Hollingsworth T.D., House T., Isham V., Klepac P., Lessler J., Lloyd-Smith J.O., Metcalf C.J.E., Mollison D., Pellis L., Pulliam J.R.C., Roberts M.G., Viboud C., Arinaminpathy N., Ball F., Bogich T., Gog J., Grenfell B., Lloyd A.L., Mclean A., O’Neill P., Pearson C., Riley S., Tomba G.S., Trapman P., Wood J. Modeling infectious disease dynamics in the complex landscape of global health. Science. 1979;347(2015) doi: 10.1126/SCIENCE.AAA4339/ASSET/8FA31E42-DA90-4C84-BF84-FBB2DA09DB83/ASSETS/GRAPHIC/347_AAA4339_F2.JPEG. - DOI - PMC - PubMed
-
- Charles-Smith L.E., Reynolds T.L., Cameron M.A., Conway M., Lau E.H.Y., Olsen J.M., Pavlin J.A., Shigematsu M., Streichert L.C., Suda K.J., Corley C.D. Using social media for actionable disease surveillance and outbreak management: a systematic literature review. PLoS One. 2015;10 doi: 10.1371/JOURNAL.PONE.0139701. - DOI - PMC - PubMed
Publication types
LinkOut - more resources
Full Text Sources
