

Multi-scale mechanobiological model for skeletal muscle hypertrophy
- PMID: 36277181
- PMCID: PMC9582841
- DOI: 10.3389/fphys.2022.899784
Multi-scale mechanobiological model for skeletal muscle hypertrophy
Abstract
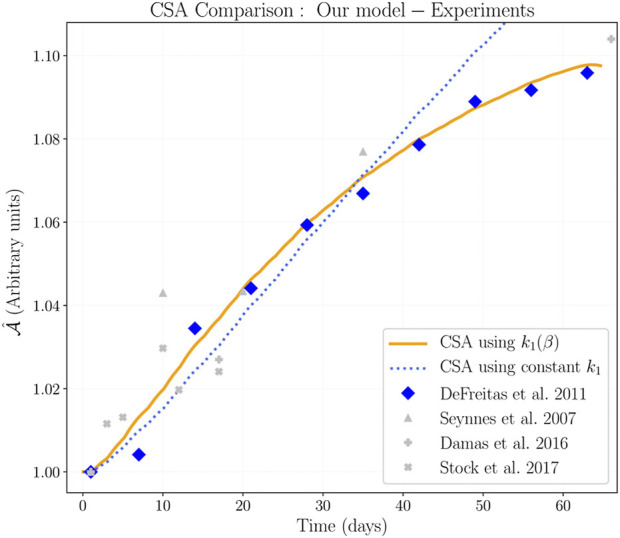
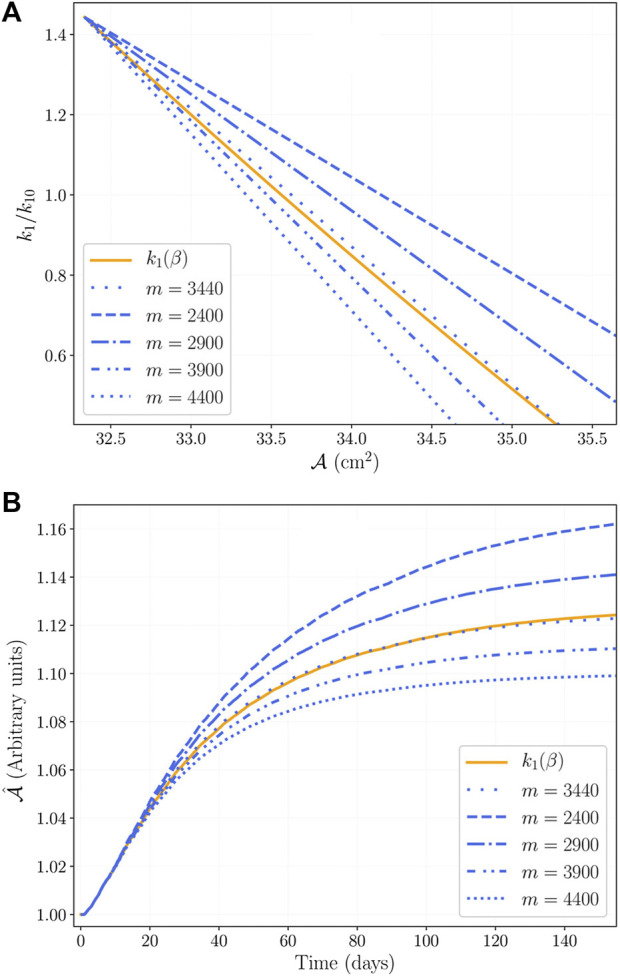
Skeletal muscle adaptation is correlated to training exercise by triggering different signaling pathways that target many functions; in particular, the IGF1-AKT pathway controls protein synthesis and degradation. These two functions regulate the adaptation in size and strength of muscles. Computational models for muscle adaptation have focused on: the biochemical description of signaling pathways or the mechanical description of muscle function at organ scale; however, an interrelation between these two models should be considered to understand how an adaptation in muscle size affects the protein synthesis rate. In this research, a dynamical model for the IGF1-AKT signaling pathway is linked to a continuum-mechanical model describing the active and passive mechanical response of a muscle; this model is used to study the impact of the adaptive muscle geometry on the protein synthesis at the fiber scale. This new computational model links the signaling pathway to the mechanical response by introducing a growth tensor, and links the mechanical response to the signaling pathway through the evolution of the protein synthesis rate. The predicted increase in cross sectional area (CSA) due to an 8 weeks training protocol excellently agreed with experimental data. Further, our results show that muscle growth rate decreases, if the correlation between protein synthesis and CSA is negative. The outcome of this study suggests that multi-scale models coupling continuum mechanical properties and molecular functions may improve muscular therapies and training protocols.
Keywords: biochemical modeling; biomechanics; cellular signaling pathways; dynamical systems; mechanobiology; muscle adaptation; population dynamics.
Copyright © 2022 Villota-Narvaez, Garzón-Alvarado, Röhrle and Ramírez-Martínez.
Conflict of interest statement
The authors declare that the research was conducted in the absence of any commercial or financial relationships that could be construed as a potential conflict of interest.
Figures


Similar articles
-
A dynamical system for the IGF1-AKT signaling pathway in skeletal muscle adaptation.Biosystems. 2021 Apr;202:104355. doi: 10.1016/j.biosystems.2021.104355. Epub 2021 Jan 14. Biosystems. 2021. PMID: 33453318
-
Mechanobiology in cardiac mechanics.Biophys Rev. 2021 Aug 27;13(5):583-585. doi: 10.1007/s12551-021-00827-4. eCollection 2021 Oct. Biophys Rev. 2021. PMID: 34765042 Free PMC article.
-
Sixteen weeks of testosterone with or without evoked resistance training on protein expression, fiber hypertrophy and mitochondrial health after spinal cord injury.J Appl Physiol (1985). 2020 Jun 1;128(6):1487-1496. doi: 10.1152/japplphysiol.00865.2019. Epub 2020 Apr 30. J Appl Physiol (1985). 2020. PMID: 32352341 Clinical Trial.
-
Intramuscular Anabolic Signaling and Endocrine Response Following Resistance Exercise: Implications for Muscle Hypertrophy.Sports Med. 2016 May;46(5):671-85. doi: 10.1007/s40279-015-0450-4. Sports Med. 2016. PMID: 26666743 Review.
-
Skeletal muscle wasting with disuse atrophy is multi-dimensional: the response and interaction of myonuclei, satellite cells and signaling pathways.Front Physiol. 2014 Mar 17;5:99. doi: 10.3389/fphys.2014.00099. eCollection 2014. Front Physiol. 2014. PMID: 24672488 Free PMC article. Review.
Cited by
-
Multi-scale modeling and simulation of skeletal muscles with different fatigue degrees based on microphysiology.Sci Rep. 2025 Mar 31;15(1):11020. doi: 10.1038/s41598-025-87443-4. Sci Rep. 2025. PMID: 40164674 Free PMC article.
-
A model of anaerobic tissue perfusion during trauma-Lactate trajectory curvature can determine recovery.PLoS Comput Biol. 2025 Aug 11;21(8):e1012820. doi: 10.1371/journal.pcbi.1012820. eCollection 2025 Aug. PLoS Comput Biol. 2025. PMID: 40788942 Free PMC article.
References
-
- Altan E., Zöllner A., Avcı O., Röhrle O. (2016). Towards modelling skeletal muscle growth and adaptation. Proc. Appl. Math. Mech. 16, 921–924. 10.1002/pamm.201610448 - DOI
-
- Brigatto F. A., Braz T. V., da Costa Zanini T. C., Germano M. D., Aoki M. S., Schoenfeld B. J., et al. (2019). Effect of resistance training frequency on neuromuscular performance and muscle morphology after 8 weeks in trained men. J. Strength Cond. Res. 33, 2104–2116. 10.1519/JSC.0000000000002563 - DOI - PubMed
LinkOut - more resources
Full Text Sources
Miscellaneous