. 2022 Oct 6:10:904818.
doi: 10.3389/fbioe.2022.904818. eCollection 2022.

Viscoelastic damage evaluation of the axon

Affiliations

Viscoelastic damage evaluation of the axon

Fuad Hasan et al. Front Bioeng Biotechnol. .

Abstract

In this manuscript, we have studied the microstructure of the axonal cytoskeleton and adopted a bottom-up approach to evaluate the mechanical responses of axons. The cytoskeleton of the axon includes the microtubules (MT), Tau proteins (Tau), neurofilaments (NF), and microfilaments (MF). Although most of the rigidity of the axons is due to the MT, the viscoelastic response of axons comes from the Tau. Early studies have shown that NF and MF do not provide significant elasticity to the overall response of axons. Therefore, the most critical aspect of the mechanical response of axons is the microstructural topology of how MT and Tau are connected and construct the cross-linked network. Using a scanning electron microscope (SEM), the cross-sectional view of the axons revealed that the MTs are organized in a hexagonal array and cross-linked by Tau. Therefore, we have developed a hexagonal Representative Volume Element (RVE) of the axonal microstructure with MT and Tau as fibers. The matrix of the RVE is modeled by considering a combined effect of NF and MF. A parametric study is done by varying fiber geometric and mechanical properties. The Young's modulus and spacing of MT are varied between 1.5 and 1.9 GPa and 20-38 nm, respectively. Tau is modeled as a 3-parameter General Maxwell viscoelastic material. The failure strains for MT and Tau are taken to be 50 and 40%, respectively. A total of 4 RVEs are prepared for finite element analysis, and six loading cases are inspected to quantify the three-dimensional (3D) viscoelastic relaxation response. The volume-averaged stress and strain are then used to fit the relaxation Prony series. Next, we imposed varying strain rates (between 10/sec to 50/sec) on the RVE and analyzed the axonal failure process. We have observed that the 40% failure strain of Tau is achieved in all strain rates before the MT reaches its failure strain of 50%. The corresponding axonal failure strain and stress vary between 6 and 11% and 5-19.8 MPa, respectively. This study can be used to model macroscale axonal aggregate typical of the white matter region of the brain tissue.

Keywords: composite materials; cytoskeleton; finite element analysis; mechanical behavior of axon; mechanical characterization; neuron; representative volume element (RVE); traumatic brain injury.


Conflict of interest statement

The authors declare that the research was conducted in the absence of any commercial or financial relationships that could be construed as a potential conflict of interest.

Figures

FIGURE 1
FIGURE 1
Depicting multiscale hierarchical structure of the brain tissue ranging from macroscale tissue to microscale neuronal cells. (A) Cross-sectional view of the brain tissue (gray and white matter) in the horizontal plane. (B) Reconstruction of the neocortex shows the heterogeneity posed by neuronal cells and ECM (Kasthuri et al., 2015). (C) Anatomy of the neuronal cell (de Rooij et al., 2017). (D) SEM image shows how axially oriented MT are cross-linked with the Tau. (C) A cross-sectional view of the transverse plane shows the hexagonal orientation of MT. (C–E) are adapted from (Chen et al., 1992)).
FIGURE 2
FIGURE 2
(A,B) Axonal microstructural model for analysis (adapted from (Wu et al., 2019)). (C) Geometric properties of the MT-Tau cross-linked network.
FIGURE 3
FIGURE 3
(A) Procedure of defining the Tau properties for ANSYS. (B) Creep response fit of 3-parameter General Maxwell to Kelvin-Voigt.
FIGURE 4
FIGURE 4
(A) Base RVE (RVE-1) for MT and Tau volume fractions of 0.185 and 0.036, respectively. MT is oriented in direction 3. (B) MT-Tau crosslinked network is shown with matrix hidden. (C) The unit cell of hexagonal array of MT is shown on the 1-2 plane.
FIGURE 5
FIGURE 5
(A) General Maxwell viscoelastic model. Typical relaxation test: (B) time history of volume-averaged strain and (C) stress response.
FIGURE 6
FIGURE 6
6 load cases for the viscoelastic characterization.
FIGURE 7
FIGURE 7
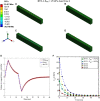
Contour plot of the element normal stress in direction 1 ( [σ1(t)]ρ from Eq. 16). C11(t) estimation for the RVE-1 with EMT=1.5GPa by imposing the load case 1. (A) t1=3ms , δ1(t1)=3nm (B) t2=12ms , δ1(t2)=3nm (C) t3=15ms , δ1(t3)=0nm (D) t4=40ms , δ1(t4)=0nm . (E) Nonlinear regression data fit with 99% confidence interval (c.i.) is shown for volume averaged normal stress in direction 1 for RVE-1, EMT=1.5GPa for load case 1. (F) Comparison of C11(t) for different RVEs.
FIGURE 8
FIGURE 8
Contour plot of the element normal stress in direction 2 ( [σ2(t)]ρ from Eq. 16). C12(t) and C22(t) estimation for the RVE-1 with EMT=1.5GPa by imposing the load case 2. (A) t1=3ms , δ2(t1)=3nm (B) t2=12ms , δ2(t2)=3nm (C) t3=15ms , δ2(t3)=0nm (D) t4=40ms , δ2(t4)=0nm .
FIGURE 9
FIGURE 9
Contour plot of the element normal stress in direction 3 ( [σ3(t)]ρ from Eq. 16). C13(t) , C23(t) and C33(t) estimation for the RVE-1 with EMT=1.5GPa by imposing the load case 3. (A) t1=3ms , δ3(t1)=3nm (B) t2=12ms , δ3(t2)=3nm (C) t3=15ms , δ3(t3)=0nm (D) t4=40ms , δ3(t4)=0nm .
FIGURE 10
FIGURE 10
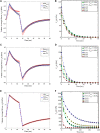
(A) Nonlinear regression data fit with 99% confidence interval (c.i.) is shown for volume averaged normal stress in direction 1 for RVE-1, EMT=1.5GPa for load case 2. (B) Comparison of C12(t) for different RVEs. (C) Nonlinear regression data fit with 99% confidence interval (c.i.) is shown for volume averaged normal stress in direction 2 for RVE-1, EMT=1.5GPa for load case 2. (D) Comparison of C22(t) for different RVEs.
FIGURE 11
FIGURE 11
(A) Nonlinear regression data fit with 99% confidence interval (c.i.) is shown for volume averaged normal stress in direction 1 for RVE-1, EMT=1.5GPa for load case 3. (B) Comparison of C13(t) for different RVEs. (C) Nonlinear regression data fit with 99% confidence interval (c.i.) is shown for volume averaged normal stress in direction 2 for RVE-1, EMT=1.5GPa for load case 3. (D) Comparison of C23(t) for different RVEs. (E) Nonlinear regression data fit with 99% confidence interval (c.i.) is shown for volume averaged normal stress in direction 3 for RVE-1, EMT=1.5GPa for load case 3. (F) Comparison of C33(t) for different RVEs.
FIGURE 12
FIGURE 12
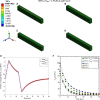
Contour plot of the element shear stress in directions 2 and 3 ( [σ4(t)]ρ from Eq. 16). C44(t) estimation for the RVE-1 with EMT=1.5GPa by imposing the load case 4. (A) t1=3ms , δ4(t1)=3nm (B) t2=12ms , δ4(t2)=3nm (C) t3=15ms , δ4(t3)=0nm (D) t4=40ms , δ4(t4)=0nm . (E) Nonlinear regression data fit with 99% confidence interval (c.i.) is shown for volume averaged shear stress in directions 2 and 3 for RVE-1, EMT=1.5GPa for load case 4. (F) Comparison of C44(t) for different RVEs.
FIGURE 13
FIGURE 13
Contour plot of the element shear stress in directions 1 and 3 ( [σ5(t)]ρ from Eq. 16). C55(t) estimation for the RVE-1 with EMT=1.5GPa by imposing the load case 5. (A) t1=3ms , δ5(t1)=3nm (B) t2=12ms , δ5(t2)=3nm (C) t3=15ms , δ5(t3)=0nm (D) t4=40ms , δ5(t4)=0nm . (E) Nonlinear regression data fit with 99% confidence interval (c.i.) is shown for volume averaged shear stress in directions 1 and 3 for RVE-1, EMT=1.5GPa for load case 5. (F) Comparison of C55(t) for different RVEs.
FIGURE 14
FIGURE 14
Contour plot of the element shear stress in directions 1 and 2 ( [σ6(t)]ρ from Eq. 16). C66(t) estimation for the RVE-1 with EMT=1.5GPa by imposing the load case 6. (A) t1=3ms , δ6(t1)=3nm (B) t2=12ms , δ6(t2)=3nm (C) t3=15ms , δ6(t3)=0nm (D) t4=40ms , δ6(t4)=0nm . (E) Nonlinear regression data fit with 99% confidence interval (c.i.) is shown for volume averaged shear stress in directions 1 and 2 for RVE-1, EMT=1.5GPa for load case 6. (F) Comparison of C66(t) for different RVEs.
FIGURE 15
FIGURE 15
(A) Cross-sectional view of the axon microstructure. (B) The axon’s effective transverse elastic modulus is estimated using the inverse rule of mixture based on the composite theory.
FIGURE 16
FIGURE 16
Contour plot of the maximum principal strain (elemental mean) for the strain rate of 5/sec, at (A) 2.5% strain, (B) 5% strain, (C) 7.5% strain, and (D) 10% strain (the matrix is hidden to show the strain on the Tau proteins).
FIGURE 17
FIGURE 17
Axon cytoskeletal damage evaluation by mapping damage threshold values for (A) axon volume averaged failure strain vs. strain rate, and (B) axon volume averaged failure stress vs. axon volume averaged failure strain for different RVEs. 40% strain is taken as the failure strain of Tau, and corresponding axonal stress and strain are plotted for different loading rates.

References

    1. Adnan A., Qidwai S., Bagchi A. (2018). On the atomistic-based continuum viscoelastic constitutive relations for axonal microtubules. J. Mech. Behav. Biomed. Mat. 86, 375–389. 10.1016/j.jmbbm.2018.06.031 - DOI - PubMed
    1. Ahmadzadeh H., Smith D. H., Shenoy V. B. (2014). Viscoelasticity of tau proteins leads to strain rate-dependent breaking of microtubules during axonal stretch injury: Predictions from a mathematical model. Biophys. J. 106 (5), 1123–1133. 10.1016/j.bpj.2014.01.024 - DOI - PMC - PubMed
    1. al Mahmud K. A. H., Hasan F., Khan M. I., Adnan A. (2020). On the molecular level cavitation in soft gelatin hydrogel. Sci. Rep. 10 (1), 9635. 10.1038/s41598-020-66591-9 - DOI - PMC - PubMed
    1. Ansys R. Academic Research Mechanical and CFD, 19.1.Release.
    1. Arbogast K. B., Margulies S. S. (1999). A fiber-reinforced composite model of the viscoelastic behavior of the brainstem in shear. J. Biomechanics 32 (8), 865–870. 10.1016/S0021-9290(99)00042-1 - DOI - PubMed

LinkOut - more resources