

Emotional Analysis of Tweets About Clinically Extremely Vulnerable COVID-19 Groups
- PMID: 36277589
- PMCID: PMC9580331
- DOI: 10.7759/cureus.29323
Emotional Analysis of Tweets About Clinically Extremely Vulnerable COVID-19 Groups
Abstract
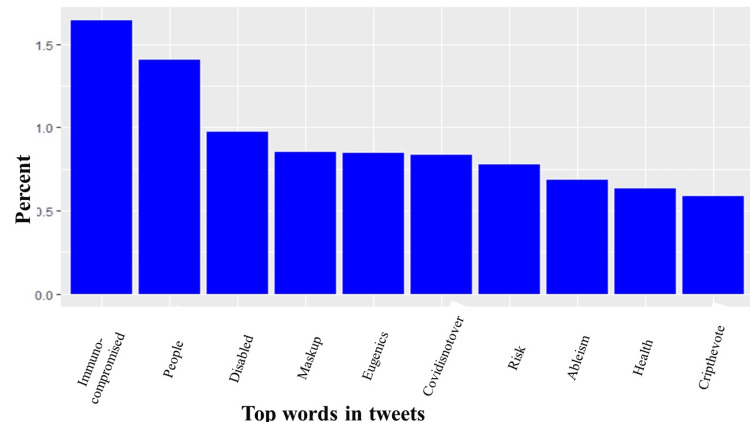
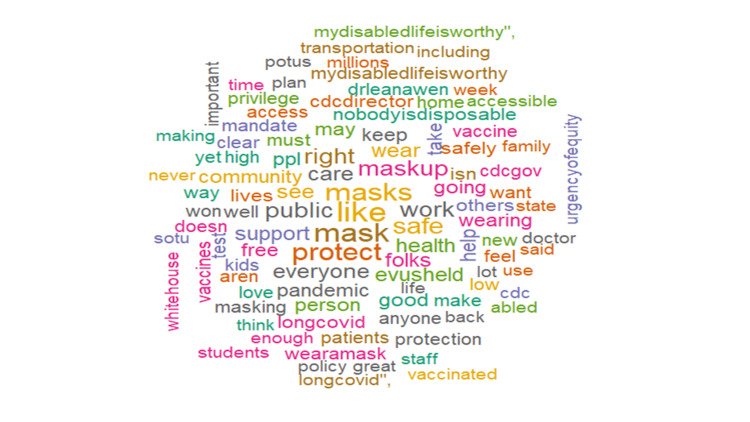
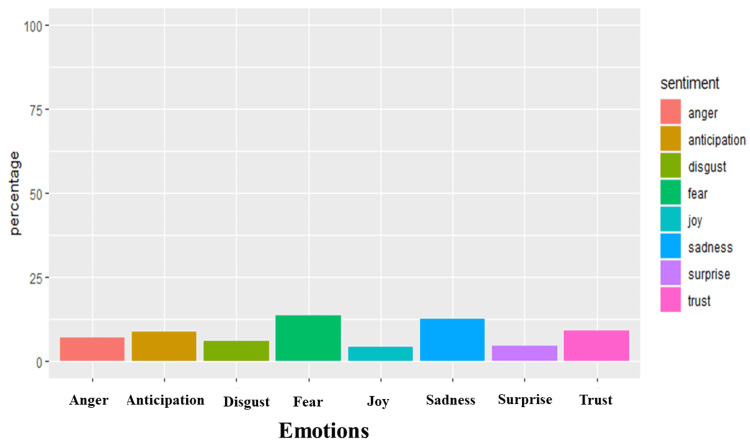
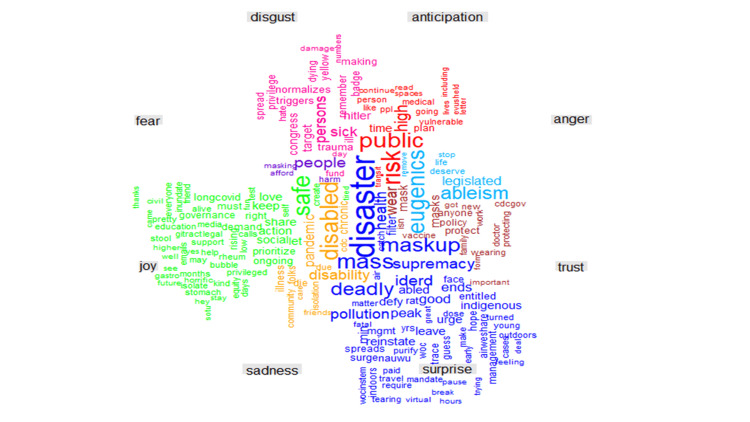
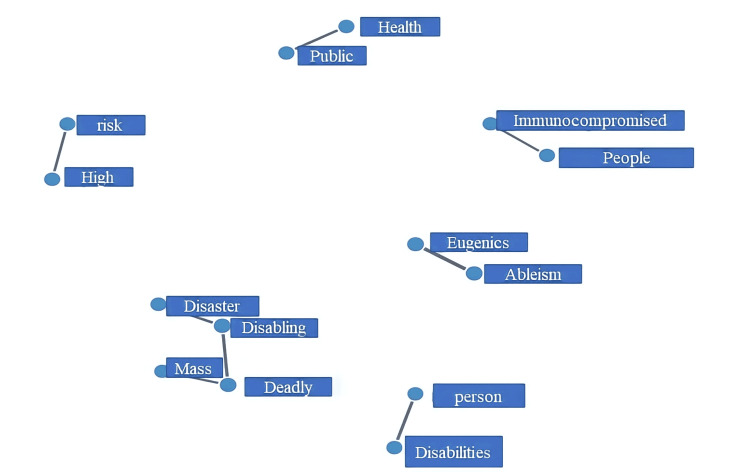
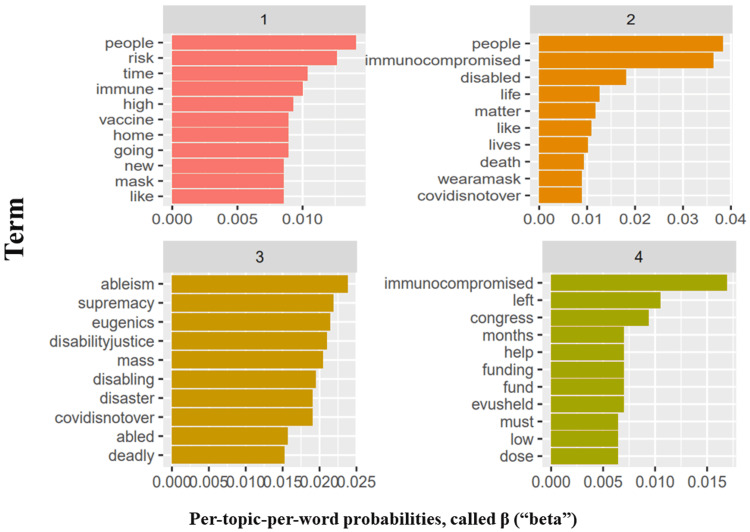
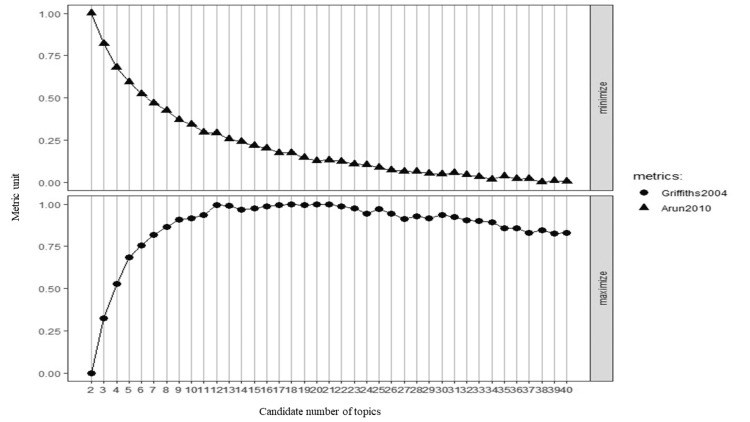
Background Clinically extremely vulnerable (CEV) individuals have a significantly higher risk of morbidity and mortality from coronavirus disease 2019 (COVID-19). This high risk is due to predispositions such as chronic obstructive pulmonary disease (COPD), diabetes mellitus, hypertension, smoking, or extreme age (≥75). The initial COVID-19 preventive measures (use of face masks, social distancing, social bubbles) and vaccine allocation prioritized this group of vulnerable individuals to ensure their continued protection. However, as countries start relaxing the lockdown measures to help prevent socio-economic collapse, the impact of this relaxation on CEVs is once again brought to light. In this study, we set out to understand the impact of policy changes on the lives of CEVs by analyzing Twitter data with the hashtag #highriskcovid used by many high-risk individuals to tweet about and express their opinions and feelings. Methodology Tweets were extracted from the Twitter API between March 01, 2022, and April 21, 2022, using the Twarc2 tool. Extracted tweets were in English and included the hashtag #highriskcovid. We evaluated the most frequently used words and hashtags by calculating term frequency-inverse document frequency, and the location of tweets using the tidygeocoder package (method = osm). We also evaluated the sentiments and emotions depicted by these tweets using the National Research Council sentiment lexicon of the Syuzhet package. Finally, we used the latent Dirichlet allocation algorithm to determine relevant high-risk COVID-19 themes. Results The vast majority of the tweets originated from the United States (64%), Canada (22%), and the United Kingdom (4%). The most common hashtags were #highriskcovid (25.5%), #covid (6.82%), #immunocompromised (4.93%), #covidisnotover (4.0%), and #Maskup (1.40%), and the most frequently used words were immunocompromised (1.64%), people (1.4%), disabled (0.97%), maskup (0.85%), and eugenics (0.85%). The tweets were more negative (19.27%) than positive, and the most expressed negative emotions were fear (13.62%) and sadness (12.47%). At the same time, trust was the most expressed positive emotion and was used in relation to belief in masks, policies, and health workers to help. Finally, we detected frequently co-tweeted words such asmass and disaster, deadly and disabling, high and risk, public and health, immunocompromised and people, mass and disaster, and deadly and disabling. Conclusions The study provides evidence regarding the concerns and fears of high-risk COVID-19 groups as expressed via social media. It is imperative that further policies be implemented to specifically protect the health and mental wellness of high-risk individuals (for example, incorporating sentiment analyses of high-risk COVID-19 individuals such as this paper to inform the evaluation of already implemented preventive measures and policies). In addition, considerable work needs to be done to educate the public on high-risk individuals.
Keywords: cevs; covid-19; face masks; healthcare policy; highriskcovid; sentiment analysis; twitter.
Copyright © 2022, Awoyemi et al.
Conflict of interest statement
The authors have declared that no competing interests exist.
Figures


References
-
- When can we stop wearing face masks? [ May; 2022 ]. 2022. https://www.thesun.co.uk/news/13221751/face-mask-rules-ending/ https://www.thesun.co.uk/news/13221751/face-mask-rules-ending/
-
- Boris Johnson SCRAPS work from home from TODAY and face masks & vaccine passports from next week as he rips up Plan B. [ May; 2022 ]. 2022. https://www.thesun.co.uk/health/17373030/boris-johnson-plan-b-restrictio... https://www.thesun.co.uk/health/17373030/boris-johnson-plan-b-restrictio...
-
- More than 90% of U.S. population can ditch facemasks under CDC Covid guidance. [ May; 2022 ]. 2022. https://www.cnbc.com/2022/03/03/more-than-90percent-of-us-population-can... https://www.cnbc.com/2022/03/03/more-than-90percent-of-us-population-can...
-
- Wearing of face masks no more mandatory in Ghana - Nana Addo. [ May; 2022 ];https://www.msn.com/en-xl/africa/other/wearing-of-face-masks-no-more-man... 2022 2022:23.
LinkOut - more resources
Full Text Sources
Miscellaneous