. 2022 Aug 12;13(35):10395-10405.
doi: 10.1039/d2sc03374g. eCollection 2022 Sep 14.

A CRISPR/Cas12a-responsive dual-aptamer DNA network for specific capture and controllable release of circulating tumor cells

Affiliations

A CRISPR/Cas12a-responsive dual-aptamer DNA network for specific capture and controllable release of circulating tumor cells

Dong-Xia Wang et al. Chem Sci. .

Abstract

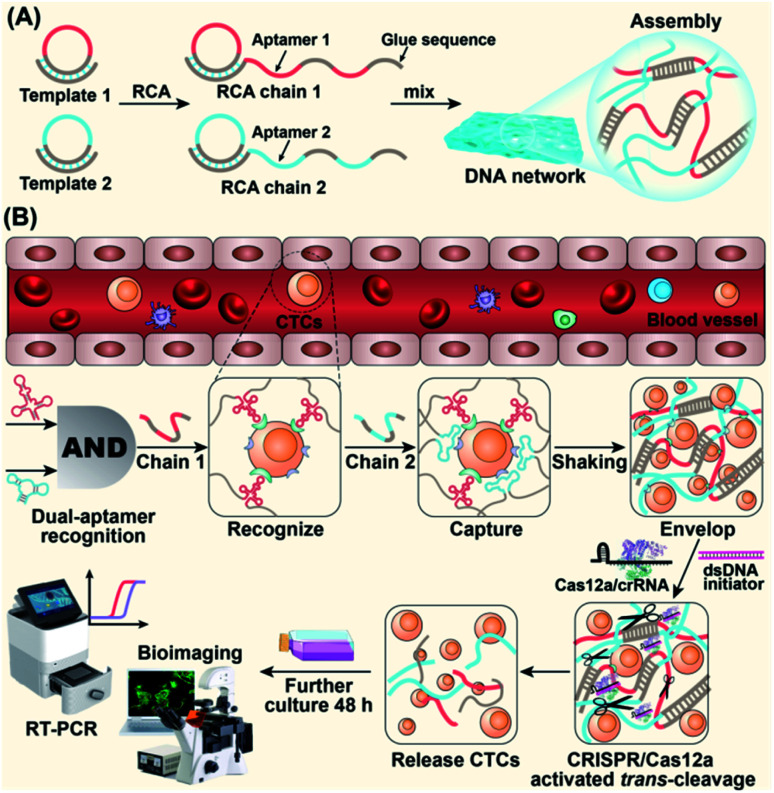
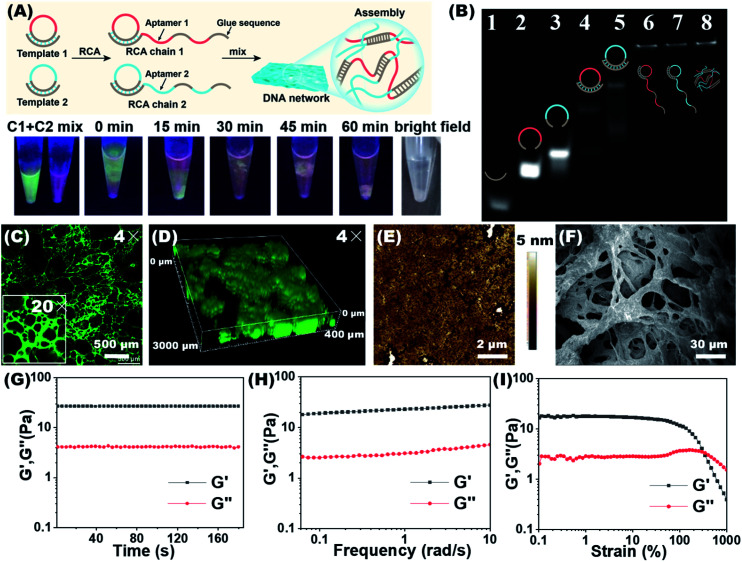
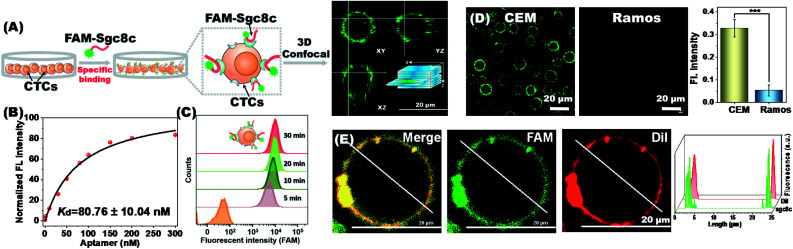
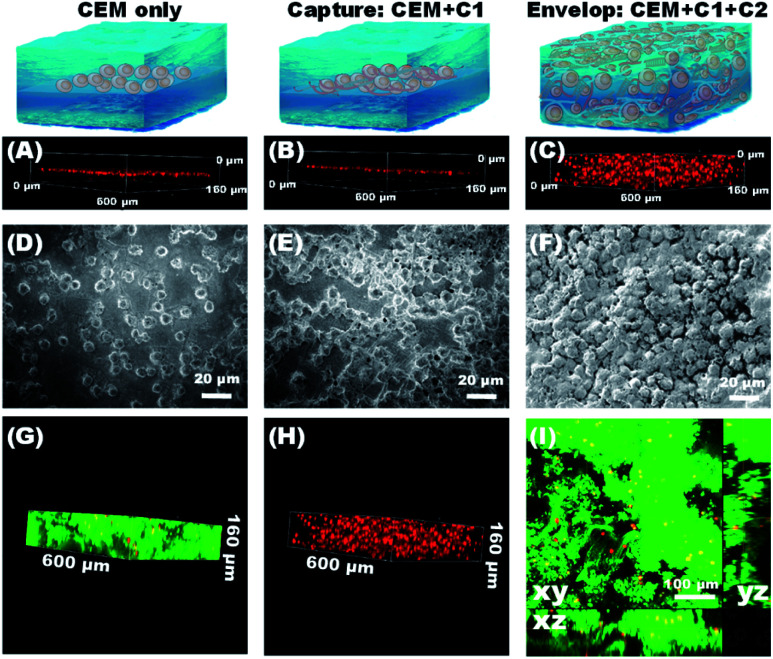
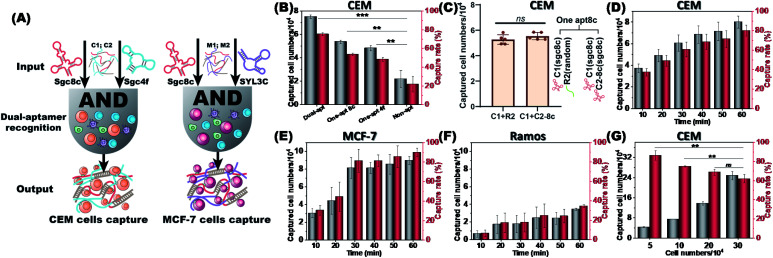
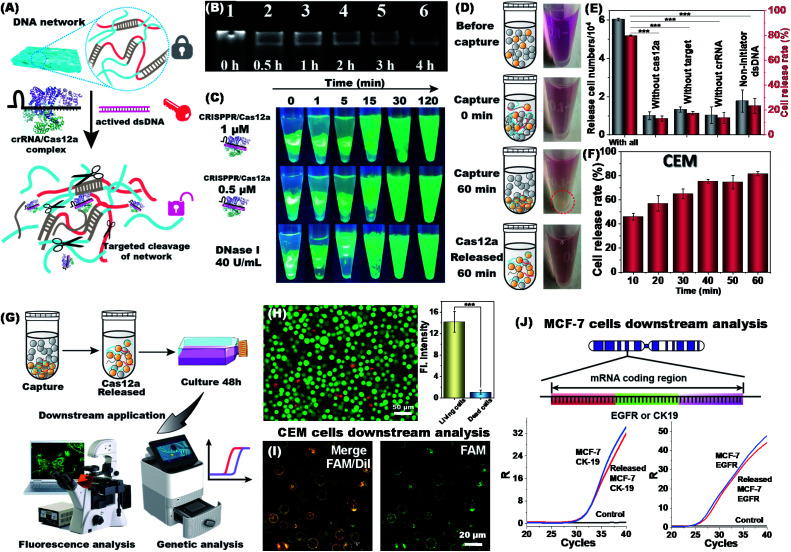
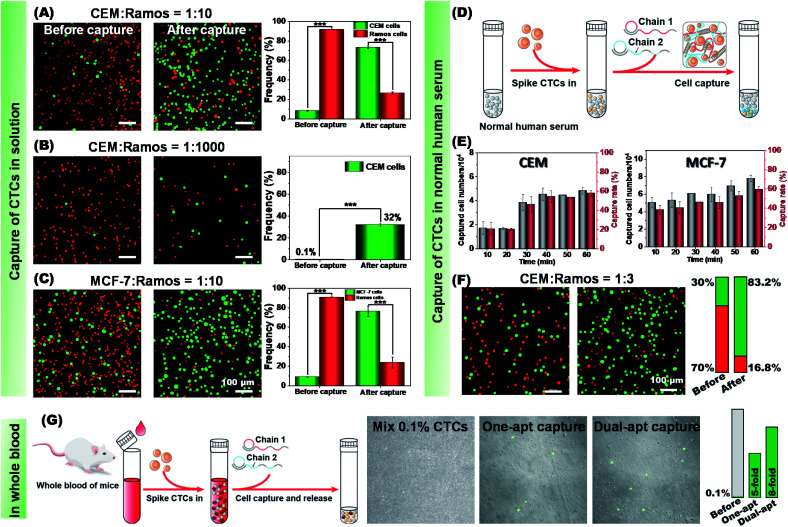
The separation and detection of circulating tumor cells (CTCs) have a significant impact on clinical diagnosis and treatment by providing a predictive diagnosis of primary tumors and tumor metastasis. But the responsive release and downstream analysis of live CTCs will provide more valuable information about molecular markers and functional properties. To this end, specific capture and controllable release methods, which can achieve the highly efficient enrichment of CTCs with strong viability, are urgently needed. DNA networks create a flexible, semi-wet three-dimensional (3D) microenvironment for cell culture, and have the potential to minimize the loss of cell viability and molecular integrity. More importantly, responsive DNA networks can be reasonably designed as smart sensors and devices to change shape, color, disassemble, and giving back to external stimuli. Here, a strategy for specifically collecting cells using a dual-aptamer DNA network is designed. The proposed strategy enables effective capture, 3D encapsulation, and responsive release of CTCs with strong viability, which can be used for downstream analysis of live cells. The programmability of CRISPR/Cas12a, a powerful toolbox for genome editing, is used to activate the responsive release of captured CTCs from the DNA network. After activation by a specified double-strand DNA (dsDNA) input, CRISPR/Cas12a cleaves the single-stranded DNA regions in the network, resulting in molecular to macroscopic changes in the network. Accompanied by the deconstruction of the DNA network into fragments, controllable cell release is achieved. The viability of released CTCs is well maintained and downstream cell analysis can be performed. This strategy uses the enzymatic properties of CRISPR/Cas12a to design a platform to improve the programmability and versatility of the DNA network, providing a powerful and effective method for capturing and releasing CTCs from complex physiological samples.


Conflict of interest statement

There are no conflicts to declare.

Figures

Scheme 1
Scheme 1. Schematic of a CRISPR/Cas12a-responsive DNA network for CTC capture and release. (A) Formation of a 3D DNA network via the cross-linking of ultra-long DNA strands prepared by RCA. (B) The process of cell capture and release is as follows: single-aptamer recognition, dual-aptamer synergetic recognition, DNA network capture, and CRISPR/Cas12a-responsive release of CTCs.
Fig. 1
Fig. 1. Synthesis and characterization of the DNA network. (A) The upper figure shows the synthesis route of a cross-linked DNA network by the RCA reaction. The figure below shows time-dependent changes of the mixture of two RCA chains, from which the formation of the DNA network can be visualized. RCA chain 1 and RCA chain 2 were stained with SYBR Green I and Gel Red, respectively. (B) Non-denaturing PAGE characterization of primer1, padlock1, padlock2, the primer1/circle1 hybrid, the primer2/circle2 hybrid, RCA chain 1, RCA chain 2, and the DNA network. (C) Confocal laser scanning microscopy (CLSM) images of the freeze-dried DNA network (stained with SYBR Green I). (D) CLSM 3D image of the DNA network in an aqueous solution. (E) AFM image of the freeze-dried DNA network. (F) SEM image of the freeze-dried DNA network. (G) Dynamic time sweep rheological test of the DNA network with a fixed strain of 1%. Storage modulus (G′) and loss modulus (G′′) of the DNA network from frequency sweep (H) and strain sweep (I) tests.
Fig. 2
Fig. 2. Aptamer-specific anchoring of CTCs. (A) Targeted recognition and binding of FAM-sgc8c (green) toward CEM cells. (B) Binding affinity of the sgc8c aptamer to CEM cells in a working environment for cell capture. (C) Flow cytometry analysis showed that FAM-sgc8c can be stably immobilized on the CEM cell surface. (D) CLSM and fluorescence analysis images of FAM-sgc8c binding on CEM cells. Ramos cells were used as the control. (Right) Statistical analysis was performed using an unpaired two-tailed t test; ***, P <0.001. The bars represent mean ± SD (n = 3). (E) Colocalization of FAM-sgc8c (green) and cell membrane dye CM-Dil (red). (Right) A representative line was drawn through the center of the cell to show the fluorescence distribution.
Fig. 3
Fig. 3. CLSM and SEM characterization of CTC capture by the DNA network. (A–C) 3D stacking CLSM images of CEM cells only (A), CEM + C1 (B) and CEM + C1 + C2 (C). A total of 15 layers were scanned every 10 μm to obtain a 3D stack. (D–F) SEM images of CEM cells only (D), CEM + C1 (E) and CEM + C1+C2 (F). (G and H) 3D stacking CLSM image (region of interest: 600 × 600 × 160 μm3) of CTCs (stained with CM-DiI, red) enveloped in the DNA network (stained with SYBR Green I, green). (H) The 3D image of CTCs in the DNA network. (I) 3D stacking image showing the uniform spatial distribution of CTCs in the DNA network.
Fig. 4
Fig. 4. Target cell capture efficiency of the dual-aptamer DNA network. (A) The AND logic gate mechanism of the dual-aptamer DNA network for capturing CTCs. (B) Capture rates of CEM cells under different conditions: dual aptamers (sgc8c and sgc4f), single aptamer (sgc8c or sgc4f) and non-aptamer sequence. (C) Capture of CEM cells by two single-aptamer DNA networks: C1 (sgc8c) + R2 (random); C1 (sgc8c) + C2-8c (sgc8c). (D–F) Time dependent-capture rate and captured cell numbers of CEM, MCF-7, and Ramos cells by the DNA network. In (F), the representative results of Ramos cell capture by C1/C2 are given. (G) Cell number-dependent capture rate and captured cell numbers of CEM cells. Incubation time was 60 min. The bars represent mean ± SD (n = 3); statistical analysis was performed using an unpaired two-tailed t-test; ***, P <0.001.
Fig. 5
Fig. 5. CRISPR/Cas12a-responsive release of CTCs for downstream analysis of cells. (A) Working mechanism of CRISPR/Cas12a-controlled disassembly of the DNA network: after activation by the dsDNA initiator, Cas12a cleaves the ssDNA regions in the DNA network. (B) PAGE images of the DNA network after treatment with activated CRISPR/Cas12a for different times. (C) Visual observation of DNA network disassembly by activated CRISPR/Cas12a or DNase I. The DNA network was stained with SYBR Green I. Sample 1: 1 μM Cas12a + 1 μM crRNA + 1 μM dsDNA; sample 2: 0.5 μM Cas12a + 0.5 μM crRNA + 0.5 μM dsDNA; sample 3: 40 U mL−1 DNase I. (D) Visual observation of DNA network-driven cell capture and CRISPR/Cas12a-responsive cell release. (E) Released CEM cell numbers and release rate under different conditions. The bars represent mean ± SD (n = 3). (F) Incubation time-dependent cell release rate of CEM cells from the DNA network. (G) Schematic diagram of using released cells for downstream analysis: fluorescence analysis and genetic analysis. (H) Fluorescence microscopy image of released CEM cells after culturing for 48 h. Alive and dead cells were stained with Calcein-AM (green) and PI (red), respectively. On the right is the average optical density of the fluorescence images. The bars represent mean ± SD (n = 3); statistical analysis was performed using an unpaired two-tailed t-test; ***, P <0.001. (I) CLSM images of FAM-sgc8c binding on released CEM cells. Cell membranes were stained with CM-Dil (red). (J) The comparison of CK19 mRNA and EGFR mRNA expression levels between original MCF-7 and released MCF-7 cells. R: relative fluorescence. The released MCF-7 cells were incubated for 48 hours before RT-PCR analysis.
Fig. 6
Fig. 6. Specific enrichment of target cancer cells from cell mixtures, human serum and mice whole blood samples. (A) Target CEM cells (green) and non-target Ramos cells (red) were mixed at 1 : 10. After the specific capture and controllable release, target CEM cells were significantly enriched. Statistical analysis on the right showed approximate 27-fold enrichment of target CEM cells. (B) Target CEM cells (green) and non-target Ramos cells (red) were mixed at 1 : 1000. The proportion of CTCs was increased from 0.1% to 32% after enrichment. (C) Target MCF-7 cells (green) and non-target Ramos cells (red) were mixed at 1 : 10. After the specific capture and controllable release, targeted MCF-7 cells were significantly enriched. Statistical analysis on the right showed approximate 30-fold enrichment of target MCF-7 cells. Statistical analysis was performed using an unpaired two-tailed t test; ***, P <0.001. (D) Schematic of targeted capture of CTCs from human serum samples. (E) Time-dependent capture rate and captured cell numbers of CEM cells and MCF-7 cells from human serum samples. The bars represent mean ± SD (n = 3). (F) Targeted capture and enrichment of CEM cells from human serum samples containing CEM cells (green) and control Ramos cells (red) with a ratio of 1 : 3. After the specific capture and controllable release, target CEM cells were significantly enriched. Statistical analysis on the right showed approximate 9-fold enrichment of target CEM cells. (G) Schematic of targeted capture of CTCs from mice whole blood samples. Target CEM cells (green) were mixed into whole blood with a ratio to blood cells of 1 : 1000. Single- and dual-aptamer DNA networks gave 5 and 8 time enrichment of CEM cells, respectively.

Similar articles

Cited by

References

    1. Nagrath S. Sequist L. V. Maheswaran S. Bell D. W. Irimia D. Ulkus L. Smith M. R. Kwak E. L. Digumarthy S. Muzikansky A. Ryan P. Balis U. J. Tompkins R. G. Haber D. A. Toner M. Nature. 2007;450:1235–1239. doi: 10.1038/nature06385. - DOI - PMC - PubMed
    1. Poudineh M. Sargent E. H. Pantel K. Kelley S. O. Nat. Biomed. Eng. 2018;2:72–84. doi: 10.1038/s41551-018-0190-5. - DOI - PubMed
    1. Qin W. Chen L. Wang Z. Li Q. Fan C. Wu M. Zhang Y. Adv. Sci. 2020:2000647. doi: 10.1002/advs.202000647. - DOI - PMC - PubMed
    1. Wu L. Ding H. Qu X. Shi X. Yang J. Huang M. Zhang J. Zhang H. Song J. Zhu L. Song Y. Ma Y. Yang C. J. Am. Chem. Soc. 2020;142:4800–4806. doi: 10.1021/jacs.9b13782. - DOI - PubMed
    1. Zhang J. Lin B. Wu L. Huang M. Li X. Zhang H. Song J. Wang W. Zhao G. Song Y. Yang C. J. Angew. Chem., Int. Ed. 2020;59:14115–14119. doi: 10.1002/anie.202005974. - DOI - PubMed