

Multi-omics insights into potential mechanism of SGLT2 inhibitors cardiovascular benefit in diabetic cardiomyopathy
- PMID: 36277768
- PMCID: PMC9579694
- DOI: 10.3389/fcvm.2022.999254
Multi-omics insights into potential mechanism of SGLT2 inhibitors cardiovascular benefit in diabetic cardiomyopathy
Abstract
Background: Metabolic and energy disorders are considered central to the etiology of diabetic cardiomyopathy (DCM). Sodium-glucose cotransporter-2 inhibitors (SGLT2i) can effectively reduce the risk of cardiovascular death and heart failure in patients with DCM. However, the underlying mechanism has not been elucidated.
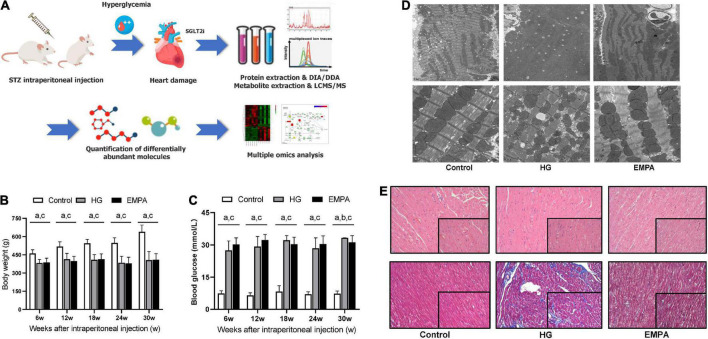
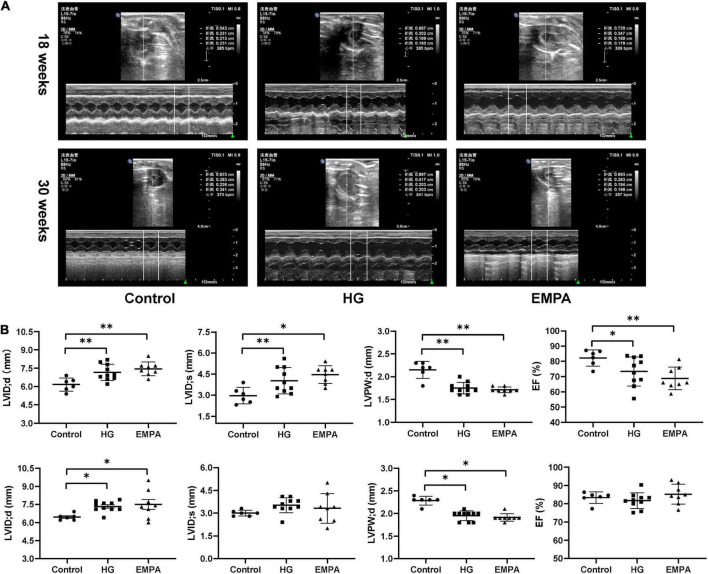
Methods: We established a DCM rat model followed by treatment with empagliflozin (EMPA) for 12 weeks. Echocardiography, blood tests, histopathology, and transmission electron microscopy (TEM) were used to evaluate the phenotypic characteristics of the rats. The proteomics and metabolomics of the myocardium in the rat model were performed to identify the potential targets and signaling pathways associated with the cardiovascular benefit of SGLT2i.
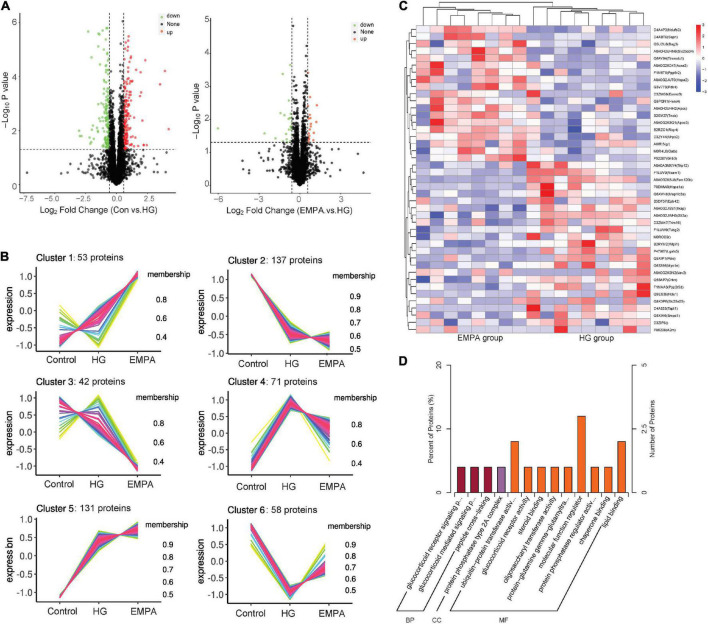
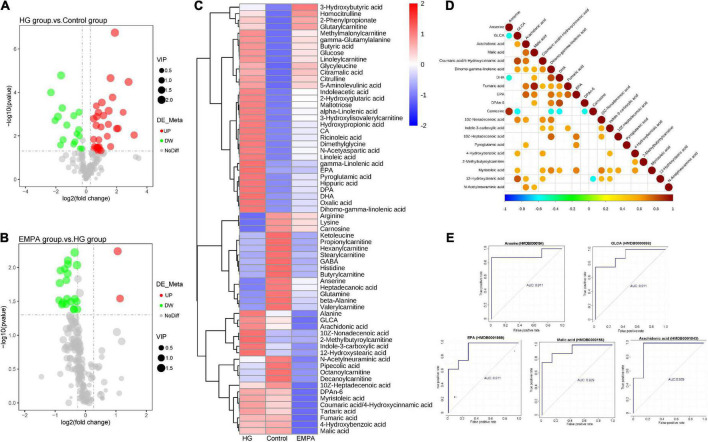
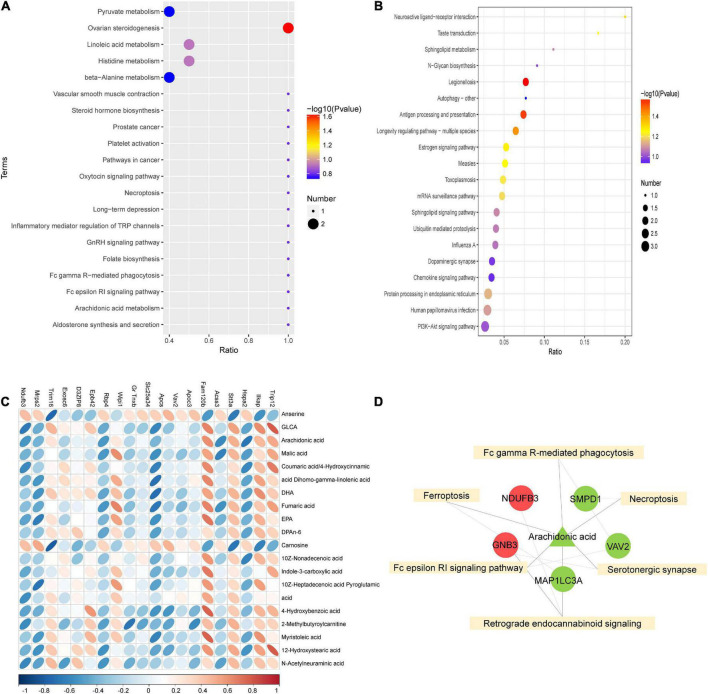
Results: The diabetic rat showed pronounced DCM characterized by mitochondrial pleomorphic, impaired lipid metabolism, myocardial fibrosis, and associated diastolic and systolic functional impairments in the heart. To some extent, these changes were ameliorated after treatment with EMPA. A total of 43 proteins and 34 metabolites were identified as targets in the myocardium of diabetic rats treated with EMPA. The KEGG analysis showed that arachidonic acid is associated with the maximum number of related pathways and may be a potential target of EMPA treatment. Fatty acid (FA) metabolism was enhanced in diabetic hearts, and the perturbation of biosynthesis of unsaturated FAs and arachidonic acid metabolism was a potential enabler for the cardiovascular benefit of EMPA.
Conclusion: SGLT2i ameliorated lipid accumulation and mitochondrial damage in the myocardium of diabetic rats. The metabolomic and proteomic data revealed the potential targets and signaling pathways associated with the cardiovascular benefit of SGLT2i, which provides a valuable resource for the mechanism of SGLT2i.
Keywords: SGLT2 inhibitors; diabetic cardiomyopathy; mechanisms; metabolomics; proteomics.
Copyright © 2022 Xi, Chen, Dong, Zhang, Lam, He, Du, Chen, Guo and Xiao.
Conflict of interest statement
The authors declare that the research was conducted in the absence of any commercial or financial relationships that could be construed as a potential conflict of interest.
Figures
Similar articles
-
Multi-omics analysis reveals attenuation of cellular stress by empagliflozin in high glucose-treated human cardiomyocytes.J Transl Med. 2023 Sep 23;21(1):662. doi: 10.1186/s12967-023-04537-1. J Transl Med. 2023. PMID: 37742032 Free PMC article.
-
Empagliflozin and Liraglutide Differentially Modulate Cardiac Metabolism in Diabetic Cardiomyopathy in Rats.Int J Mol Sci. 2021 Jan 25;22(3):1177. doi: 10.3390/ijms22031177. Int J Mol Sci. 2021. PMID: 33503985 Free PMC article.
-
Empagliflozin Ameliorates Diabetic Cardiomyopathy via Attenuating Oxidative Stress and Improving Mitochondrial Function.Oxid Med Cell Longev. 2022 May 9;2022:1122494. doi: 10.1155/2022/1122494. eCollection 2022. Oxid Med Cell Longev. 2022. PMID: 35585884 Free PMC article.
-
Direct Cardiac Actions of Sodium Glucose Cotransporter 2 Inhibitors Target Pathogenic Mechanisms Underlying Heart Failure in Diabetic Patients.Front Physiol. 2018 Nov 21;9:1575. doi: 10.3389/fphys.2018.01575. eCollection 2018. Front Physiol. 2018. PMID: 30519189 Free PMC article. Review.
-
Direct cardiovascular impact of SGLT2 inhibitors: mechanisms and effects.Heart Fail Rev. 2018 May;23(3):419-437. doi: 10.1007/s10741-017-9665-9. Heart Fail Rev. 2018. PMID: 29322280 Review.
Cited by
-
Identification of potential biomarkers for diabetic cardiomyopathy using LC-MS-based metabolomics.Endocr Connect. 2024 Jan 25;13(3):e230384. doi: 10.1530/EC-23-0384. Print 2024 Mar 1. Endocr Connect. 2024. PMID: 38180052 Free PMC article.
-
Multi-omics analysis reveals attenuation of cellular stress by empagliflozin in high glucose-treated human cardiomyocytes.J Transl Med. 2023 Sep 23;21(1):662. doi: 10.1186/s12967-023-04537-1. J Transl Med. 2023. PMID: 37742032 Free PMC article.
-
Elevated circulating level of β-aminoisobutyric acid (BAIBA) in heart failure patients with type 2 diabetes receiving sodium-glucose cotransporter 2 inhibitors.Cardiovasc Diabetol. 2022 Dec 20;21(1):285. doi: 10.1186/s12933-022-01727-x. Cardiovasc Diabetol. 2022. PMID: 36539818 Free PMC article.
-
Exploring shared therapeutic targets in diabetic cardiomyopathy and diabetic foot ulcers through bioinformatics analysis.Sci Rep. 2024 Jan 2;14(1):230. doi: 10.1038/s41598-023-50954-z. Sci Rep. 2024. PMID: 38168477 Free PMC article.
-
Proarrhythmic Lipid Inflammatory Mediators: Mechanisms in Obesity Arrhythmias.J Cell Physiol. 2025 Feb;240(2):e70012. doi: 10.1002/jcp.70012. J Cell Physiol. 2025. PMID: 39943721 Free PMC article. Review.
References
-
- Saeedi P, Petersohn I, Salpea P, Malanda B, Karuranga S, Unwin N, et al. Global and regional diabetes prevalence estimates for 2019 and projections for 2030 and 2045: results from the International Diabetes Federation Diabetes Atlas, 9(th) edition. Diabetes Res Clin Pract. (2019) 157:107843. 10.1016/j.diabres.2019.107843 - DOI - PubMed
-
- Gregg EW, Cheng YJ, Srinivasan M, Lin J, Geiss LS, Albright AL, et al. Trends in cause-specific mortality among adults with and without diagnosed diabetes in the USA: an epidemiological analysis of linked national survey and vital statistics data. Lancet. (2018) 391:2430–40. 10.1016/S0140-6736(18)30314-3 - DOI - PubMed
-
- Gbd 2017 Causes of Death Collaborators. Global, regional, and national age-sex-specific mortality for 282 causes of death in 195 countries and territories, 1980-2017: a systematic analysis for the Global Burden of Disease Study 2017. Lancet. (2018) 392:1736–88. 10.1016/S0140-6736(18)32203-7 - DOI - PMC - PubMed
LinkOut - more resources
Full Text Sources
Molecular Biology Databases
Research Materials
Miscellaneous