

RATING: Medical knowledge-guided rheumatoid arthritis assessment from multimodal ultrasound images via deep learning
- PMID: 36277816
- PMCID: PMC9583187
- DOI: 10.1016/j.patter.2022.100592
RATING: Medical knowledge-guided rheumatoid arthritis assessment from multimodal ultrasound images via deep learning
Abstract
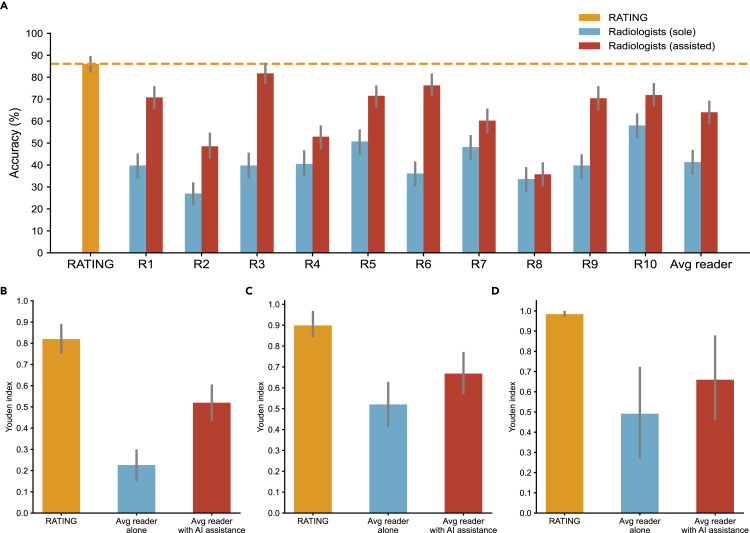
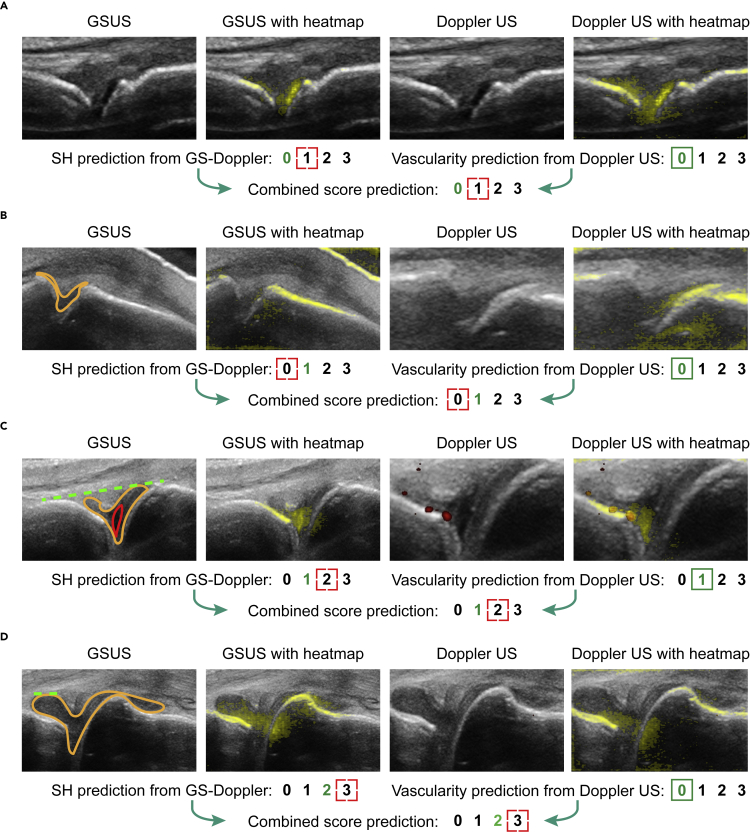
Multimodal ultrasound has demonstrated its power in the clinical assessment of rheumatoid arthritis (RA). However, for radiologists, it requires strong experience. In this paper, we propose a rheumatoid arthritis knowledge guided (RATING) system that automatically scores the RA activity and generates interpretable features to assist radiologists' decision-making based on deep learning. RATING leverages the complementary advantages of multimodal ultrasound images and solves the limited training data problem with self-supervised pretraining. RATING outperforms all of the existing methods, achieving an accuracy of 86.1% on a prospective test dataset and 85.0% on an external test dataset. A reader study demonstrates that the RATING system improves the average accuracy of 10 radiologists from 41.4% to 64.0%. As an assistive tool, not only can RATING indicate the possible lesions and enhance the diagnostic performance with multimodal ultrasound but it can also enlighten the road to human-machine collaboration in healthcare.
Keywords: deep learning; human-machine collaboration; multimodal ultrasound; rheumatoid arthritis.
© 2022 The Author(s).
Conflict of interest statement
The authors declare no competing interests.
Figures

Similar articles
-
A domain knowledge-based interpretable deep learning system for improving clinical breast ultrasound diagnosis.Commun Med (Lond). 2024 May 17;4(1):90. doi: 10.1038/s43856-024-00518-7. Commun Med (Lond). 2024. PMID: 38760506 Free PMC article.
-
Deep learning-based automatic scoring models for the disease activity of rheumatoid arthritis based on multimodal ultrasound images.Rheumatology (Oxford). 2024 Mar 1;63(3):866-873. doi: 10.1093/rheumatology/kead366. Rheumatology (Oxford). 2024. PMID: 37471602
-
Deep learning-enabled pelvic ultrasound images for accurate diagnosis of ovarian cancer in China: a retrospective, multicentre, diagnostic study.Lancet Digit Health. 2022 Mar;4(3):e179-e187. doi: 10.1016/S2589-7500(21)00278-8. Lancet Digit Health. 2022. PMID: 35216752
-
Rheumatoid Arthritis: Atherosclerosis Imaging and Cardiovascular Risk Assessment Using Machine and Deep Learning-Based Tissue Characterization.Curr Atheroscler Rep. 2019 Jan 25;21(2):7. doi: 10.1007/s11883-019-0766-x. Curr Atheroscler Rep. 2019. PMID: 30684090 Review.
-
Machine learning approaches to improve disease management of patients with rheumatoid arthritis: review and future directions.Expert Rev Clin Immunol. 2021 Dec;17(12):1311-1321. doi: 10.1080/1744666X.2022.2017773. Epub 2021 Dec 20. Expert Rev Clin Immunol. 2021. PMID: 34890271 Review.
Cited by
-
Current application, possibilities, and challenges of artificial intelligence in the management of rheumatoid arthritis, axial spondyloarthritis, and psoriatic arthritis.Ther Adv Musculoskelet Dis. 2025 Jun 21;17:1759720X251343579. doi: 10.1177/1759720X251343579. eCollection 2025. Ther Adv Musculoskelet Dis. 2025. PMID: 40547599 Free PMC article. Review.
-
Applications of artificial intelligence in musculoskeletal ultrasound: narrative review.Front Med (Lausanne). 2023 Nov 21;10:1286085. doi: 10.3389/fmed.2023.1286085. eCollection 2023. Front Med (Lausanne). 2023. PMID: 38076232 Free PMC article. Review.
-
STNet: shape and texture joint learning through two-stream network for knowledge-guided image recognition.Front Neurosci. 2023 Jun 15;17:1212049. doi: 10.3389/fnins.2023.1212049. eCollection 2023. Front Neurosci. 2023. PMID: 37397450 Free PMC article.
-
A survey of the impact of self-supervised pretraining for diagnostic tasks in medical X-ray, CT, MRI, and ultrasound.BMC Med Imaging. 2024 Apr 6;24(1):79. doi: 10.1186/s12880-024-01253-0. BMC Med Imaging. 2024. PMID: 38580932 Free PMC article. Review.
References
-
- Atchia I., Brown A.K., Chitale S., Ciechomska A., Estrach C., Karim Z., Wakefield R.J., British Society for Rheumatology Ultrasound Special Interest Group BSRUSSIG British society for Rheumatology ultrasound special interest group (BSRUSSIG) (2021). Recommendations for rheumatology ultrasound training and practice in the UK. Rheumatology. 2021;60:2647–2652. doi: 10.1093/rheumatology/keaa656. - DOI - PubMed
-
- Colebatch A.N., Edwards C.J., Østergaard M., van der Heijde D., Balint P.V., D'Agostino M.A., Forslind K., Grassi W., Haavardsholm E.A., Haugeberg G., et al. EULAR recommendations for the use of imaging of the joints in the clinical management of rheumatoid arthritis. Ann. Rheum. Dis. 2013;72:804–814. doi: 10.1136/annrheumdis-2012-203158. - DOI - PubMed
-
- Avramidis G.P., Avramidou M.P., Papakostas G.A. Rheumatoid arthritis diagnosis: deep learning vs. Appl. Sci. 2021;12:10. doi: 10.3390/app12010010. - DOI
LinkOut - more resources
Full Text Sources
Research Materials
