. 2022 Oct 7:13:970616.
doi: 10.3389/fphar.2022.970616. eCollection 2022.

Calycosin attenuates renal ischemia/reperfusion injury by suppressing NF-κB mediated inflammation via PPARγ/EGR1 pathway

Affiliations

Calycosin attenuates renal ischemia/reperfusion injury by suppressing NF-κB mediated inflammation via PPARγ/EGR1 pathway

Ningxin Zhang et al. Front Pharmacol. .

Abstract

Renal ischemia reperfusion injury (IRI) is a leading and common cause of acute kidney injury (AKI), and inflammation is a critical factor in ischemic AKI progression. Calycosin (CAL), a major active component of Radix astragali, has been reported to have anti-inflammatory effect in multiple organs. However, whether CAL can alleviate renal IRI and its mechanism remain uncertain. In the present study, a renal IRI model is established by bilateral renal pedicles occlusion for 35 min in male C57BL/6 mice, and the effect of CAL on renal IRI is measured by serum creatinine and pathohistological assay. Hypoxia/reoxygenation (H/R) stimulated human renal tubular epithelial cells HK-2 were applied to explore the regulatory mechanisms of CAL. Luciferase reporter assay and molecular docking were applied to identify the CAL's target protein and pathway. In the mice with renal IRI, CAL dose dependently alleviated the renal injury and decreased nuclear factor kappa B (NF-κB) mediated inflammatory response. Bioinformatics analysis and experiments showed that early growth response 1 (EGR1) increased in mice with renal IRI and promoted NF-κB mediated inflammatory processes, and CAL dose-dependably reduced EGR1. Through JASPAR database and luciferase reporter assay, peroxisome proliferator-activated receptor γ (PPARγ) was predicted to be a transcription factor of EGR1 and repressed the expression of EGR1 in renal tubular epithelial cells. CAL could increase PPARγ in a dose dependent manner in mice with renal IRI and molecular docking predicted CAL could bind stably to PPARγ. In HK-2 cells after H/R, CAL increased PPARγ, decreased EGR1, and inhibited NF-κB mediated inflammatory response. However, PPARγ knockdown by siRNA transfection abrogated the anti-inflammation therapeutic effect of CAL. CAL produced a protective effect on renal IRI by attenuating NF-κB mediated inflammatory response via PPARγ/EGR1 pathway.

Keywords: acute kidney injury; calycosin; early growth response 1; ischemia/reperfusion injury; peroxisome proliferator-activated receptor γ.


Conflict of interest statement

The authors declare that the research was conducted in the absence of any commercial or financial relationships that could be construed as a potential conflict of interest.

Figures
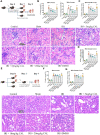
FIGURE 1
FIGURE 1
CAL protected the kidney from IRI. (A) The pattern diagram of the animal research design for CAL pre-treatment. (B) SCr and BUN levels in kidney samples of different groups. (C) Renal tubular damage index and H and E staining images of kidney tissue samples in different groups. Scale bar, 100 µm. (D) KIM-1 mRNA level in kidney samples of different groups. ** p < 0.01 vs. sham group. ## p < 0.01 vs. IRI group. n = 8 per group. (E) The pattern diagram of the animal research design for CAL post-surgery administration. (F) SCr level in kidney samples of different groups. (G) Renal tubular damage index and H and E staining images of kidney tissue samples in different groups. Scale bar, 100 µm. ** p < 0.01 vs. sham group. # p < 0.05, ## p < 0.01 vs. IRI group. n = 8 per group. The data are presented as the mean ± SD.
FIGURE 2
FIGURE 2
CAL ameliorated inflammation response in mice after IRI and H/R-induced HK-2 cells. (A) IL-1β, IL-6, and TNF-α mRNA levels in kidney samples and IL-1β, IL-6, and TNF-α concentrations in mice serum of different groups. (B) The protein levels of p-NF-κB/NF-κB and p-IκBα/IκBα in kidney samples of different groups. ** p < 0.01 vs. sham group. ## p < 0.01 vs. IRI group. n = 8 per group. (C) Results of CCK-8 testing of different concentrations of CAL on HK-2 cells. * p < 0.05, ** p < 0.01 vs. control cells. (D) The HIF-1α mRNA level in different cell groups. (E) IL-1β, IL-6, and TNF-α mRNA levels in cell lysates and IL-1β, IL-6, and TNF-α concentrations in supernatant of different groups. (F) The protein levels of p-NF-κB/NF-κB and p-IκBα/IκBα in cell lysates of different groups. ** p < 0.01 vs. control group. ## p < 0.01 vs. H/R group. n = 4 per group. The data are presented as the mean ± SD.
FIGURE 3
FIGURE 3
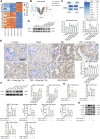
EGR1 involved in the anti-inflammatory effect of CAL. (A) Heatmap of GSE52004. Absolute log2FC > 3 with adj. p < 0.05 was considered the threshold of DEGs (orange: high expression; blue: low expression). (B) Volcanic plot of the DEGs (orange: up-regulated; blue: down-regulated). (C) PPI network of top 10 hub genes selected by the Maximal Clique Centrality method via Cytoscape. (D) The EGR1 protein and mRNA levels in kidney samples of different groups. (E) Immunohistochemistry showed the expression of EGR1 of kidney tissue samples in different groups. Scale bar, 50 µm. ** p < 0.01 vs. sham group. ## p < 0.01 vs. IRI group. n = 8 per group. (F) The protein and mRNA expression of EGR1 in HK-2 cells transfected with EGR1 siRNA or PPARγ siRNA. ** p < 0.01 vs. control group (G) IL-1β, IL-6, and TNF-α mRNA levels in cell lysates and IL-1β, IL-6, and TNF-α concentrations in cell supernatant of different groups. (H) The protein levels of p-NF-κB/NF-κB and p-IκBα/IκBα in cell lysates of different groups. ** p < 0.01 compared with control group. ## p < 0.01 compared with the H/R group. n = 4 per group. The data are presented as the mean ± SD.
FIGURE 4
FIGURE 4
PPARγ targeted and inhibited EGR1. (A) The binding sites of PPARγ between EGR1 promoter region predicted by JASPAR website. (B) Immunohistochemistry showed the expression level PPARγ of kidney tissue samples in normal control group and 20 mg/kg CAL group. Scale bar, 50 µm. ** p < 0.01 vs. control group. n = 3 per group. (C) The PPARγ mRNA and protein levels in kidney samples of different groups. (D) Immunohistochemistry showed the expression level PPARγ of kidney tissue samples in different groups. Scale bar, 50 µm. ** p < 0.01 vs. sham group. ## p < 0.01 vs. IRI group. n = 8 per group. (E) The mRNA and protein levels of PPARγ in HK-2 cells transfected with PPARγ siRNA or control siRNA. ** p < 0.01 vs. control siRNA group. n = 4 per group. (F) Luciferase reporter assay showed the effect of CAL and PPARγ on the activities of EGR1 promoters. ** p < 0.01 vs. pGL3-EGR1 without PPARγ-OE group. ## p < 0.01 vs. pGL3-EGR1 with PPARγ-OE group. n = 3 per group. The data are presented as the mean ± SD.
FIGURE 5
FIGURE 5
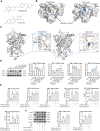
CAL inhibited inflammation via PPARγ/EGR1. (A) Chemical structure of troglitazone and CAL. (B) Structure of PPARγ revealed troglitazone and CAL is located in the orthosteric pocket of PPARγ. Troglitazone and CAL are shown as the spheres structure, and PPARγ is shown as the surfaces structure. (C) Troglitazone and CAL (ligand) bound to PPARγ (receptor) via hydrogen bonds. Ligand are shown as the stick structure, and PPARγ is shown as the cartoon structure. Hydrogen bonds are shown as dotted lines (yellow). ILE, isoleucine; SER, serine; GLU, glutamate. (D) The PPARγ and EGR1 mRNA and protein levels in different cell groups. (E) IL-1β, IL-6, and TNF-α mRNA levels in cell lysates and IL-1β, IL-6, and TNF-α concentrations in supernatant of different groups. (F) The protein levels of p-NF-κB/NF-κB and p-IκBα/IκBα in cell lysates of different groups. ** p < 0.01 vs. control group. ## p < 0.01 vs. H/R group. n = 4 per group. The data are presented as the mean ± SD.

References

    1. Andrade-Oliveira V., Foresto-Neto O., Watanabe I. K. M., Zatz R., Câmara N. O. S. (2019). Inflammation in renal diseases: New and old players. Front. Pharmacol. 10, 1192. 10.3389/fphar.2019.01192 - DOI - PMC - PubMed
    1. Bernardo A., Plumitallo C., De Nuccio C., Visentin S., Minghetti L. (2021). Curcumin promotes oligodendrocyte differentiation and their protection against TNF-α through the activation of the nuclear receptor PPAR-γ. Sci. Rep. 11 (1), 4952. 10.1038/s41598-021-83938-y - DOI - PMC - PubMed
    1. Cao X. J., Zhang M. J., Zhang L. L., Yu K., Xiang Y., Ding X., et al. (2018). TLR4 mediates high-fat diet induced physiological changes in mice via attenuating PPARγ/ABCG1 signaling pathway. Biochem. Biophys. Res. Commun. 503 (3), 1356–1363. 10.1016/j.bbrc.2018.07.048 - DOI - PubMed
    1. Chen C., Cui J., Ji X., Yao L. (2020). Neuroprotective functions of calycosin against intracerebral hemorrhage-induced oxidative stress and neuroinflammation. Future Med. Chem. 12 (7), 583–592. 10.4155/fmc-2019-0311 - DOI - PubMed
    1. Chin C. H., Chen S. H., Wu H. H., Ho C. W., Ko M. T., Lin C. Y. (2014). cytoHubba: identifying hub objects and sub-networks from complex interactome. BMC Syst. Biol. 8, S11. 10.1186/1752-0509-8-s4-s11 - DOI - PMC - PubMed