. 2022 Nov 11;131(11):926-943.
doi: 10.1161/CIRCRESAHA.121.318988. Epub 2022 Oct 24.

SIRT6 Mitigates Heart Failure With Preserved Ejection Fraction in Diabetes

Affiliations

SIRT6 Mitigates Heart Failure With Preserved Ejection Fraction in Diabetes

Xiaoqian Wu et al. Circ Res. .

Erratum in

Abstract

Background: Heart failure with preserved ejection fraction (HFpEF) is a growing health problem without effective therapies. Epidemiological studies indicate that diabetes is a strong risk factor for HFpEF, and about 45% of patients with HFpEF are suffering from diabetes, yet the underlying mechanisms remain elusive.

Methods: Using a combination of echocardiography, hemodynamics, RNA-sequencing, molecular biology, in vitro and in vivo approaches, we investigated the roles of SIRT6 (sirtuin 6) in regulation of endothelial fatty acid (FA) transport and HFpEF in diabetes.

Results: We first observed that endothelial SIRT6 expression was markedly diminished in cardiac tissues from heart failure patients with diabetes. We then established an experimental mouse model of HFpEF in diabetes induced by a combination of the long-term high-fat diet feeding and a low-dose streptozocin challenge. We also generated a unique humanized SIRT6 transgenic mouse model, in which a single copy of human SIRT6 transgene was engineered at mouse Rosa26 locus and conditionally induced with the Cre-loxP technology. We found that genetically restoring endothelial SIRT6 expression in the diabetic mice ameliorated diastolic dysfunction concurrently with decreased cardiac lipid accumulation. SIRT6 gain- or loss-of-function studies showed that SIRT6 downregulated endothelial FA uptake. Mechanistically, SIRT6 suppressed endothelial expression of PPARγ through SIRT6-dependent deacetylation of histone H3 lysine 9 around PPARγ promoter region; and PPARγ reduction mediated SIRT6-dependent inhibition of endothelial FA uptake. Importantly, oral administration of small molecule SIRT6 activator MDL-800 to diabetic mice mitigated cardiac lipid accumulation and diastolic dysfunction.

Conclusions: The impairment of endothelial SIRT6 expression links diabetes to HFpEF through the alteration of FA transport across the endothelial barrier. Genetic and pharmacological strategies that restored endothelial SIRT6 function in mice with diabetes alleviated experimental HFpEF by limiting FA uptake and improving cardiac metabolism, thus warranting further clinical evaluation.

Keywords: HFpEF; PPARγ; diabetes; endothelial cells; fatty acid transport; heart failure; sirtuins.


Conflict of interest statement

Disclosures

A patent application related to this work has been filed. Z.G.J. is a founder of Bailey Pharmaceutical Technologies, Inc. No other competing interests.

Figures
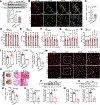
Figure 1.
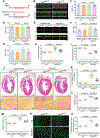
Figure 1.. Endothelial SIRT6 expression was reduced in the vasculature of humans and mice under diabetic conditions.
A, Representative immunoblotting image and quantification of SIRT6 protein level in the cardiac tissues from diabetic patients with heart failure (n = 6) and healthy controls (n = 3). B, Immunofluorescence staining SIRT6 expression (red) and EC marker CD31 (cyan) on cardiac specimens from diabetic patients with heart failure and healthy controls. Scale bars, 30 μm. C, Quantification of SIRT6 positive endothelial cells per mm2 of area based on Immunostaining in B using Image J software. n = 4 patients. D, Percentage of left ventricular ejection fraction (LVEF). E, Percentage of left ventricular fraction shortening (LVFS). F, Ratio between mitral E wave and A wave (E/A). G, Ratio between mitral E wave and E′ wave (E/E′). H, Isovolumic relaxation time (IVRT). I, Ratio between wet and dry lung weight. J, Running distance during exercise exhaustion test. n = 8 mice per group in D through J. K, Representative images of general view, hematoxylin and eosin (H&E), and Masson’s Trichrome staining of the left ventricle section. Scale bars, 1000 μm (general view), 600 μm (H&E), and 100 μm (Masson). L, SIRT6 mRNA expression in the fresh isolated aortic intima tested by real-time PCR. GAPDH is used as a loading control for mRNA measurement. n = 6 mice per group. M, Immunofluorescence staining of SIRT6 and CD31 on cross sections of the cardiac tissues from mice under HFD/STZ insult and mice under normal diet. Scale bars, 30 μm. N, Quantification of SIRT6 positive endothelial cells per mm2 of area based on Immunostaining in M. n = 4 repeated experiments. O, mRNA level of SIRT6 in HUVECs treated with high glucose (HG) or normal glucose (NG) tested by real-time PCR. P, Representative image and quantification of SIRT6 protein in HUVECs treated with HG or NG for 24 h tested by Immunoblotting assay. Q, mRNA level of SIRT6 in HUVECs treated with palmitic acid (PA) or vehicle control (CTL) tested by real-time PCR. R, Representative image and quantification of SIRT6 protein in HUVECs treated with PA or CTL tested by Immunoblotting assay. n = 5 repeated experiments in P and R; n = 6 repeated experiments in O and Q. Statistical analysis was performed by unpaired Student’s t-test (I, J, L, O, Q) and non-parametric unpaired Mann-Whitney test (A, C, N, P, R), two-way ANOVA plus Bonferroni’s multiple comparisons test (D through H). ns, no significance.
Figure 2.
Figure 2.. Generation and characterization of endothelial-specific human SIRT6 overexpression transgenic (Sirt6ecTG) mice.
A, Construction of the humanized Sirt6ecTG mice. The transgenic CTV vector with SIRT6 (human Sirt6 cDNA, blue box) was coupled to the Rosa26 locus. B, PCR of tail genomic DNA to differentiate Sirt6ecWT and Sirt6ecTG mice. C, Representative images of immunofluorescence staining of SIRT6 (red) and CD31 (cyan) on the heart tissues from the Sirt6ecWT and Sirt6ecTG mice. Scale bars, 20 μm. D, SIRT6 mRNA expression in the primarily isolated mouse coronary ECs (MCECs) of the Sirt6ecWT and Sirt6ecTG mice. GAPDH is used as a loading control for mRNA measurement. n = 6 repeated experiments. E, SIRT6 protein expression in the isolated MCECs of the Sirt6ecWT and Sirt6ecTG mice. n = 5 repeated experiments. F, Immunofluorescence staining of SIRT6 (red) and CD31 (cyan) in the isolated MCECs from the Sirt6ecWT and Sirt6ecTG mice. Scale bars, 20 μm. Statistical analysis was performed by unpaired Student’s t-test in D and non-parametric unpaired Mann-Whitney test in E.
Figure 3.
Figure 3.. Endothelial SIRT6 overexpression protected against cardiac dysfunction in diabetic mice.
A, Schematic of the experimental setup. B, Representative left ventricular M-mode echocardiographic tracings in short-axis view. C, Percentage of LVEF. n = 8, 8, 11, 12 mice for Sirt6ecWT ND, Sirt6ecTG ND, Sirt6ecWT HFD/STZ, and Sirt6ecTG HFD/STZ, respectively. D, Percentage of LVFS. n = 8, 8, 11, 12 mice, respectively. E, Representative pulsed-wave Doppler tracings. F, Ratio between mitral E wave and E′ wave (E/E′). n = 8, 9, 10, 11 mice, respectively. G, Isovolumic relaxation time. n = 8, 9, 9, 9 mice, respectively. H, Ratio between wet and dry lung weight. n = 8, 8, 11, 11 mice, respectively. I, Running distance from exercise exhaustion tests. n = 6, 6, 8, 8 mice, respectively. J, Representative images of H&E and Sirius red (SR) staining in longitudinal sections of mouse left ventricle. Scale bars, 800 μm (H&E) and 100 μm (SR). K, Quantification of fibrosis by assessing the SR-positive areas. n = 5, 5, 8, 8 replicates, respectively. L, Ratio of heart weight to body weight (HW/BW). n = 6, 6, 9, 8 mice, respectively. M, Ratio of heart weight to tibia length (HW/TL). n = 6, 7, 10, 8 mice, respectively. N, Representative images of wheat germ agglutinin (WGA) staining. O, Quantification of cardiomyocyte cross-sectional area based on WGA staining. n = 5, 5, 6, 6 replicates, respectively, with 150–300 myocytes analyzed per image. Scale bars, 20 μm. Statistics were performed using two-way ANOVA plus Tukey’s multiple comparisons test for C, D, F, G, H, I, L and M, and non-parametric Kruskal-Wallis test with the Conover-Iman method for post hoc pairwise comparison and Benjamini-Hochberg correction for K and O.
Figure 4.
Figure 4.. Endothelial SIRT6 overexpression reduced cardiac lipid accumulation in diabetic mice.
A, Representative images and quantification of Oil Red O-staining of the cardiac sections of mouse left ventricle. Scale bars, 50 μm. B, Quantification of Oil Red O positive area in the heart sections (expressed as a percentage) measured by Image J software. n = 6 repeated experiments per group. C, Representative images of electron micrographs (original magnification ×15,000) of myocardial tissue showing lipid droplets (red arrows) within the sarcoplasm of cardiomyocytes. D, Lipid droplet size (expressed as μm2) and lipid droplet numbers (expressed per 100 μm2) in heart sections. n = 3 replicates per group. Scale bars, 1 μm. E, Cardiac TG or FA contents in diabetic Sirt6ecWT and Sirt6ecTG mice. n = 6 mice per group. F, Liver TG or FA contents in diabetic Sirt6ecWT and Sirt6ecTG mice. n = 6, 8 mice for Sirt6ecWT and Sirt6ecTG, respectively. G, Plasma TG or FA levels in the diabetic mice fasted for 12 h. n = 6, 8 mice, respectively. Statistical analysis was performed by two-way ANOVA plus Tukey’s multiple comparisons test (B), non-parametric unpaired Mann-Whitney test (D), and unpaired Student’s t-test (E through G).
Figure 5.
Figure 5.. SIRT6 epigenetically repressed PPARγ transcription via deacetylating H3K9.
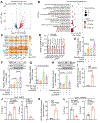
A, Volcano plot of differentially expressed genes. Downregulation and upregulation were shown in the blue and red dots, respectively. Data were submitted to GEO database (GSE 213425). B, Gene Ontology (GO) enrichment analysis of 67 altered metabolism-relevant genes showing the top 20 regulated GO terms in SIRT6 overexpressed-HUVECs. The significantly enriched GO terms in differentially expressed genes compared to the genome background were defined by hypergeometric test followed by Benjamini-Hochberg correction. P values were shown by a different color, the size of the bubble indicates the gene count of each term. C, Heat map of representative differentially expressed metabolic genes in SIRT6 overexpressed HUVECs. D, Validation of RNA-seq data by real-time PCR in the SIRT6-overexpressed HUVECs compared with that of Ad-LacZ treated cells, normalized to the loading control GAPDH. E and F, Real-time PCR and Western blots showing PPARγ expression in PA-treated HUVECs with or without SIRT6 knockdown by small interfering RNA. G and H, The expression of PPARγ in PA-treated HUVECs with or without SIRT6 overexpression. I, ChIP assays with a SIRT6-specific antibody or IgG control in the HUVECs detected SIRT6 binding to the promoter of PPARγ. J, ChIP assay detected SIRT6 binding to the promoter of PPARγ in the SIRT6-overexpressed or -depleted HUVECs. The occupancy of SIRT6 to promoters was shown relative to background signals with IgG control. K, ChIP analysis detected H3K9 acetylation at the promoter of PPARγ in HUVECs compared with IgG control. L, ChIP analysis detected H3K9 acetylation at the promoter of PPARγ in the SIRT6-overexpressed or -deleted HUVECs. n = 5 (D) and n = 4 (E-L) repeated experiments. Statistical analysis was performed by non-parametric unpaired Mann-Whitney test (D, I, J, K and L), and non-parametric Kruskal-Wallis test with Conover-Iman method for post hoc pairwise comparison and Benjamini-Hochberg correction (E, F, G, and H).
Figure 6.
Figure 6.. Endothelial SIRT6 inhibited FA uptake both in vitro and in vivo.
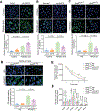
A, Representative images and quantification of BODIPY-C16 493/503 uptake in the SIRT6-depleted HUVECs in the presence or absence of palmitic acid (PA). Scale bars, 20 μm. B, Representative images and quantification of BODIPY-C16 493/503 uptake in the SIRT6-overexpressed HUVECs in the presence or absence of PA. Scale bars, 20 μm. C, Representative images and analytical results of BODIPY-C16 493/503 uptake in the lung microvascular ECs isolated from the Sirt6ecWT or Sirt6ecTG mice with or without HFD/STZ insult. Scale bars, 20 μm. n = 6 repeated experiments in A through C. D, En face immunofluorescence imaging of the thoracic aortae freshly isolated from Sirt6ecWT or Sirt6ecTG mice with HFD/STZ insult and incubated with BODIPY-C16 493/503 for 30 min. Scale bars, 10 μm. n = 3 mice. E and F, Uptake of oleic acid in Sirt6ecWT and Sirt6ecTG mice after HFD/STZ insult. Mice were fasted for 12 hours and then given a tail i.v. injection of [3H] oleic acid. E, Plasma [3H] radioactivity in Sirt6ecWT and Sirt6ecTG mice were measured at the indicated time points after injection. F, [3H] content in the different tissues 5 min after the injection of [3H] oleic acid. n = 6 mice per group in E and F. Statistical analysis was performed by two-way ANOVA plus Tukey’s multiple comparisons test in A-C, E, and F, non-parametric Kruskal-Wallis test followed by Dunn’s multiple comparison tests in D. * P=0.025, # P=0.0089 Sirt6ecWT HFD/STZ vs. Sirt6ecWT ND in E.
Figure 7.
Figure 7.. SIRT6 orchestrated endothelial fatty acid uptake in a PPARγ-dependent pathway.
A and B, Representative images and quantification results of FAs uptake in the SIRT6-overexpressed HUVECs in the presence or absence of Ad-PPARγ infection. Scale bars, 20 μm. n = 4 repeated experiments. C and D, Representative images and quantification results of FAs uptake in the SIRT6-overexpressed HUVECs in the presence or absence of rosiglitazone. Scale bars, 20 μm. n = 4 repeated experiments. E, CD36 mRNA expression in the SIRT6-overexpressed HUVECs in the presence or absence of Ad-PPARγ measured by real-time PCR. n = 5 repeated experiments. F, FABP4 mRNA expression in the SIRT6-overexpressed HUVECs in the presence or absence of Ad-PPARγ measured by real-time PCR. n = 5 repeated experiments. G and H, Representative images and quantification results of FAs uptake in the SIRT6-depleted HUVECs with or without PPARγ depletion by siRNA. Scale bars, 20 μm. n = 4 repeated experiments. (I) CD36 and (J) FABP4 mRNA expression in the SIRT6-depleted HUVECs with or without PPARγ depletion by siRNA measured by real-time PCR. n = 4 repeated experiments I and J. Statistical analysis was performed non-parametric Kruskal-Wallis test with the Conover-Iman method for post hoc pairwise comparison and Benjamini-Hochberg correction.
Figure 8.
Figure 8.. SIRT6 activator MDL-800 alleviated diabetes-associated HFpEF in the murine model.
A, Schematic of the experimental setup. After HFD/STZ challenge for 24 weeks, MDL-800 (50 mg/kg, p.o.) or vehicle was orally given per day concurrently with continuous HFD feeding for 4 weeks. B, Percentage of LVEF, n = 8, 7, 7 mice per group. C, Percentage of LVFS, n = 8, 7, 7 mice per group. D, Representative pulsed-wave Doppler tracing images. E, Ratio between mitral E wave and E’ wave, n = 8 mice per group. F, Running distance from exercise exhaustion tests. n = 7 mice per group. G, Ratio between wet and dry lung weight, n = 7 mice per group. H, Ratio of heart weight to body weight (HW/BW), n = 7 mice per group. I, Representative images of H&E in longitudinal sections of left ventricles from mice. Scale bars, 800 μm. J and K, TG, or FA contents in the cardiac tissues. n = 6 mice per group. L and M, Representative images and quantification of Oil Red O-staining of the longitudinal sections of the left ventricles. n = 4, 6, 6 repeated experiments, respectively. N and O, Representative images and analytical results of BODIPY-C16 493/503 uptake in HUVECs in the presence or absence of MDL-800 (20 μM), with or without PA insult. Scale bars, 20 μm, n = 6 repeated experiments. P, Tissue [3H] oleic acid uptake in mice after HFD/STZ insult with or without MDL-800 treatment. n = 6 mice per group. Statistical analysis was performed one-way ANOVA plus Tukey’s multiple comparisons test (B, C, E, F, G, H, J and K), non-parametric Kruskal-Wallis test with the Conover-Iman method for post hoc pairwise comparison and Benjamini-Hochberg correction (M), and two-way ANOVA plus Tukey’s multiple comparisons test (O and P).

References

    1. Dunlay SM, Roger VL, Redfield MM. Epidemiology of heart failure with preserved ejection fraction. Nat Rev Cardiol. 2017;14:591–602. doi: 10.1038/nrcardio.2017.65. - DOI - PubMed
    1. Shah SJ, Borlaug BA, Kitzman DW, McCulloch AD, Blaxall BC, Agarwal R, Chirinos JA, Collins S, Deo RC, Gladwin MT, et al. Research priorities for heart failure with preserved ejection fraction: National heart, lung, and blood institute working group summary. Circulation. 2020;141:1001–1026. doi: 10.1161/CIRCULATIONAHA.119.041886. - DOI - PMC - PubMed
    1. Paulus WJ, Tschöpe C. A novel paradigm for heart failure with preserved ejection fraction: Comorbidities drive myocardial dysfunction and remodeling through coronary microvascular endothelial inflammation. J Am Coll Cardiol. 2013;62:263–271. doi: 10.1016/j.jacc.2013.02.092. - DOI - PubMed
    1. Roh J, Hill JA, Singh A, Valero-Munoz M, Sam F. Heart failure with preserved ejection fraction: Heterogeneous syndrome, diverse preclinical models. Circ Res. 2022;130:1906–1925 - PMC - PubMed
    1. McHugh K, DeVore AD, Wu J, Matsouaka RA, Fonarow GC, Heidenreich PA, Yancy CW, Green JB, Altman N, Hernandez AF. Heart failure with preserved ejection fraction and diabetes: Jacc state-of-the-art review. J Am Coll Cardiol. 2019;73:602–611. doi: 10.1016/j.jacc.2018.11.033. - DOI - PubMed

Publication types