

Adoptive T cell therapy cures mice from active hemophagocytic lymphohistiocytosis (HLH)
- PMID: 36278424
- PMCID: PMC9728053
- DOI: 10.15252/emmm.202216085
Adoptive T cell therapy cures mice from active hemophagocytic lymphohistiocytosis (HLH)
Abstract
Primary hemophagocytic lymphohistiocytosis (HLH) is a hyperinflammatory syndrome caused by impaired lymphocyte cytotoxicity. First-line therapeutic regimens directed against activated immune cells or secreted cytokines show limited efficacy since they do not target the underlying immunological problem: defective lymphocyte cytotoxicity causing prolonged immune stimulation. A potential rescue strategy would be the adoptive transfer of ex vivo gene-corrected autologous T cells. However, transfusion of cytotoxicity-competent T cells under conditions of hyperinflammation may cause more harm than benefit. As a proof-of-concept for adoptive T cell therapy (ATCT) under hyperinflammatory conditions, we transferred syngeneic, cytotoxicity-competent T cells into mice with virally triggered active primary HLH. ATCT with functional syngeneic trigger-specific T cells cured Jinx mice from active HLH without life-threatening side effects and protected Perforin-deficient mice from lethal HLH progression by reconstituting cytotoxicity. Cured mice were protected long-term from HLH relapses. A threshold frequency of transferred T cells with functional differentiation was identified as a predictive biomarker for long-term survival. This study is the first proof-of-concept for ATCT in active HLH.
Keywords: adoptive T cell therapy; hemophagocytic lymphohistiocytosis; hyperinflammation; virus-specific T cells.
© 2022 The Authors. Published under the terms of the CC BY 4.0 license.
Figures

- A, B
Bodyweight (A) and survival (B) of mice were monitored for 5 weeks (n (A) = 43 Jinx, 52 WT; n (B) = 88 Jinx, 73 WT).
- C
Spleen and liver sections (day 15–21 post infection (p.i.)) were stained with hematoxylin and eosin (HE) (n = 6–7 mice per group).
- D, E
Spleen and liver weight in relation to bodyweight were analyzed on day 15 p.i. (n = 17 Jinx, 9 WT).
- F, G
Degranulation capacity of CD8 T cells on day 8 p.i. after restimulation with LCMV‐GP33–41: Frequency of CD107a+ of all IFNγ+ CD8 T cells. The following analyses were performed on day 15 p.i. (n = 12 Jinx, 14 WT).
- H–K
Ear temperature, frequency of white blood cells (WBC), concentration of hemoglobin (HGB), and frequency of platelets (PLT) in blood (n = 15–17 Jinx, 7–8 WT).
- L–Q
Serum concentration of ferritin, soluble CD25, triglycerides, glutamate‐pyruvate transaminase (GPT), lactate dehydrogenase (LDH) and interferon γ (IFNγ) (n = 15–17 Jinx, 6–9 WT).
- R
Virus titres of spleen, liver, lung, brain, and kidney (n = 15 Jinx, 9 WT).

- A
Bodyweight was monitored for 5 weeks p.i. (n = 42–52 per group).
- B, C
Analyses performed on day 35 p.i.: (B) Liver sections stained with hematoxylin and eosin (HE) (n = 3–5 in 1 experiment) and (C) ear temperature (n = 12 Jinx, 10 Jinx + ATCT, 15 WT).
- D–F
Frequency of white blood cells (WBC), concentration of hemoglobin (HGB), and frequency of platelets (PLT) in blood (n = 17 Jinx, 16 Jinx + ATCT, 21 WT).
- G–L
Serum concentration of ferritin, soluble CD25, triglycerides, GPT, LDH, and IFNγ (n = 8–15 Jinx, 10–13 Jinx + ATCT, 9–15 WT).
- M, N
Spleen and liver weight in relation to bodyweight (n = 17 Jinx, 16 Jinx + ATCT, 22 WT).
- O
Virus titres in liver, lung, brain, and kidney (n = 19 Jinx, 16 Jinx + ATCT, 24 WT).

- A, B
The frequency of CD8 T cells double negative for KLRG1 and CD127 (KLRG1−CD127−) was determined (A) in blood of 1°HLH patients, HD and (B) in the spleen of 1°HLH mouse models, as well as noninfected WT mice (n = 17 1°HLH patients, n = 11 HD, n = 30 1°HLH mice, n = 13 WT mice).
- C, D
Frequency of CD8 T cells expressing PD‐1 was determined (C) in blood of 1°HLH patients in comparison to HD (D) and in the spleen of 1°HLH mouse models, as well as noninfected WT mice (n = 17 1°HLH patients, n = 11 HD, n = 21 1°HLH mice, n = 11 WT mice).
- E
Expression of CD45RA and CCR7 on CD8 T cells was determined in blood of 1°HLH patients and HD and four populations were distinguished: CD45RA+CCR7+ termed “naïve”, CD45RA−CCR7+ termed “TCM”, CD45RA−CCR7− termed “TEM” and CD45RA+CCR7− (n = 17 1°HLH patients, n = 11 HD).
- F
Expression of CD62L and CD44 on CD8 T cells was determined in the spleen of 1°HLH mouse models, and noninfected WT mice and four populations were distinguished: CD44−CD62L+ termed “naïve”, CD44+CD62L+ termed “TCM”, CD44+CD62L− termed “TEM” and CD44−CD62L− (n = 19 1°HLH mice, n = 9 WT mice).

- A–C
On day 35 p.i., endogenous and transferred CD8 T cells (columns I and II), as well as LCMV‐GP33–41‐specific CD8 T cells (column III) in the spleen, were analyzed by flow cytometry: (A) frequency of KLRG1+ and/or CD127+, (B) PD‐1+/LAG3+ and (C) TCF‐1−/TIM3+ CD8 T cells (C) The same analyses were performed more than 100 days after therapy/115 days after infection (column IV).

Purified CD3 T cells used for ATCT were analyzed regarding the frequency of CD4 and CD8 T cells and the frequency of LCMV‐GP33–41‐specific CD8 T cells among CD8 T cells. Individual dots represent separate transfers/experiments (n = 7).
Jinx mice (Jinx) and heterozygous littermates (WT) were infected with 200 pfu LCMV‐WE intravenously. On day 5–15 p.i., mice remained untreated (Jinx, n = 8; WT, n = 10) or 1 × 10⁷ purified CD3 T cells/lymphocytes were transferred to Jinx mice (Jinx + eff, n = 9). Alternatively, Jinx mice received on day 15 p.i. a transfer with 1 × 10⁷ CD3 T cells from uninfected wild‐type mice (Jinx + naïve, n = 4).

- A
Mouse survival was followed for 22 weeks p.i. or postchallenge (n = 88 Jinx, 43 Jinx + ATCT, 7 Jinx + ATCT + challenge; n (survival until week 22 p.i./challenge) = 2/38 Jinx, 21/22 Jinx + ATCT, 7/7 Jinx + ATCT + challenge in ≥ 2 experiments).
- B, C
Bodyweight and virus titres in week 17 p.i. or postchallenge (n = 12 Jinx, 21 Jinx + ATCT, 7 Jinx + ATCT + challenge, 17 WT).
- D
Frequency of transferred CD8 T cells in the spleens of recipients 1 day (n = 4), 3 weeks (n = 16) and 15 weeks (n = 21) after therapy or 15 weeks after challenge (n = 7).

- A, B
On day 20 after therapy, endogenous and transferred CD8 T cells (column II), as well as LCMV‐GP33–41‐specific CD8 T cells (column III), were analyzed by flow cytometry: frequency of TCF‐1+ or TOX+. The same analyses were performed more than 100 days after therapy (column IV).
- C
Splenocytes were restimulated with LCMV‐GP33–41. The frequencies of transferred WT CD8 T cells in Jinx recipients and WT CD8 T cells expressing IFNγ and TNFα or IFNγ and CD107a after restimulation were determined on day 20 or > 100 days after therapy start (C, columns II, IV).

- A, B
On day 15 p.i., mice remained untreated or received 1 × 10⁷ total lymphocytes (Jinx + lym), 4 × 10⁶ purified CD3 T cells (Jinx + CD3), or 4 × 10⁶ purified CD8 T cells (Jinx + CD8) from LCMV‐immune wild‐type mice. (A) Virus titres (n = 19 Jinx, 5 Jinx + lymph, 16 Jinx + CD3, 8 Jinx + CD8) and (B) bodyweight on day 20 after therapy (n = 43 Jinx, 19 Jinx + lym, 42 Jinx + CD3, 11 Jinx + CD8).
- C, D
On day 15 p.i., Jinx mice remained untreated or received a transfer of 4 × 10⁶, 1 × 10⁶, or 1 × 10⁵ purified CD3 T cells from LCMV‐immune wild‐type mice. (C) Virus titres and (D) bodyweight on day 20 after therapy (n = 7 Jinx, 8 Jinx + 40 × 105, 9 Jinx + 10 × 105, 8 Jinx + 1 × 10⁵).

- A–D
Jinx mice were infected with 200 pfu LCMV‐WE i.v. Pooled data from ATCT experiments irrespective of the number and composition of the transferred cell population analyzed ≥ day 20 after therapy. (A) Frequency of “functional” transferred CD8 T cells (funct. trsf. CD8; KLRG1+ and/or CD127+) of all lymphocytes in the spleen was correlated with virus clearance to determine therapy success. Cured (LCMV‐free) recipients (gray bars) versus not cured (persistently infected) recipients (black bars; n = 99). (B) Procedure described in (A) was repeated for “functional” transferred CD8 T cells, which are PD‐1lowLAG3low (n = 92). (C, D) Jinx mice received on day 15 p.i. 1 × 10⁷ lymphocytes (Jinx + lym), 4 × 10⁶ purified CD3 (Jinx + CD3), or 4 × 10⁶ purified CD8 T cells (Jinx + CD8) from LCMV‐immune wild‐type mice. Alternatively, Jinx mice received effector T cells from acutely LCMV‐infected WT mice (day 5–15 p.i.; Jinx + eff). Frequency of transferred “functional” CD8 T cells (PD‐1lowLAG3low or CD127+ and/or KLRG1+) in recipient Jinx mice at the indicated time points after therapy in (C) spleen and (D) blood. Successful LCMV clearance from all organs (cured, open symbol) versus no LCMV clearance (not cured, filled symbol). (n (C) = 10 Jinx + eff. – day 20, 13 Jinx + CD3 – day 20, 15 Jinx + CD3 > day 100, 7 Jinx + lym. > day 100, 4 Jinx + CD8 > day 100). (n (D) = 5 Jinx + eff. – day 20–35, 7 Jinx + lym. – day 20–35, 5 Jinx + CD3 – day 20–35, 12 Jinx + CD3 > day 100, 3 Jinx + CD8 > day 100).
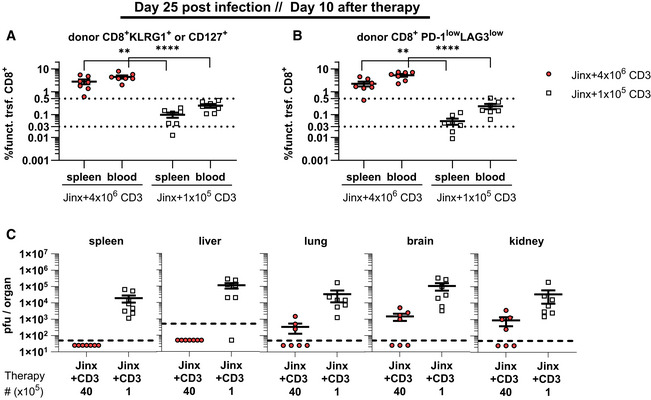
Frequency of “functional” transferred CD8 T cells (funct. trsf. CD8), (KLRG1+ and/or CD127+ of all lymphocytes) in recipients 10 days after therapy (n = 7 mice per group).
Procedure of (A) was repeated for transferred CD8 T cells with low expression of PD‐1 and LAG3 (n = 7 mice per group).
Virus titers were determined 10 days after therapy (n = 7 mice per group).

- A
Bodyweight of PKO, PKO + ATCT and WT mice for 5 weeks after infection (n = 9 PKO, 9 PKO + ATCT, 7 WT).
- B
Cell frequency of “functional” (PD‐1lowLAG3low) transferred CD8 T cells in the spleen and blood of PKO + ATCT that eliminated LCMV (cured) compared with PKO recipients with insufficient therapy (transfer of 1 × 10⁵ purified CD3 T cells transferred on day 7 p.i., analysis on day 12–19 p.i.) that did not eliminate LCMV (not cured). (n (spleen) = 9 PKO + 4 × 10⁶, n = 6 PKO + 1 × 10⁵), (n (blood) = 5 PKO + 4 × 10⁶, n = 6 PKO + 1 × 10⁵).
- C
Virus titres in liver, lung, brain, and kidney (n = 9 PKO, 9 PKO + ATCT, 7 WT).
- D
Ear temperature (n = 9 PKO, 9 PKO + ATCT, 7 WT).
- E–G
Frequency of white blood cells (WBC), concentration of hemoglobin (HGB) and frequency of platelets (PLT) in blood (n = 9 PKO, 9 PKO + ATCT, 7 WT).
- H–M
Serum concentration of ferritin, soluble CD25, triglycerides, glutamate‐pyruvate transaminase (GPT), lactate dehydrogenase (LDH) and interferon γ (IFNγ) (n = 7–9 PKO, 6–9 PKO + ATCT, 6–7 WT).
- N, O
Spleen and liver weight were analyzed in relation to bodyweight of mice (n = 8–9 PKO, 9 PKO + ATCT, 7 WT).

- A, B
On day 15 p.i., different numbers of lymphocytes, CD3, CD4, or CD8 T cells were transferred. Analyses ≥ day 20 after therapy. (A) Frequency of “functional” transferred CD8 T cells (funct. trsf. CD8; KLRG1+ and/or CD127+) of all lymphocytes in recipients that cleared LCMV (cured) or not (not cured; n = 62 “cured”, n = 37 “not cured” in 18 experiments). (B) Procedure of (A) was repeated for “functional” transferred CD8 T cells with low expression of PD‐1 and LAG3. (C, D) On day 15 p.i., Jinx mice remained untreated or received a transfer of 4 × 10⁶, 1 × 10⁶, or 1 × 10⁵ purified CD3 T cells from LCMV‐immune wild‐type mice (n = 60 “cured”, n = 32 “not cured” in 18 experiments).
- C
Frequency of “functional” transferred CD8 T cells (funct. trsf. CD8), (KLRG1+ and/or CD127+ of all lymphocytes) in recipients that cleared LCMV (cured) or not (not cured) 20 days after therapy (n = 8–9 mice per group).
- D
Procedure of (C) was repeated for transferred CD8 T cells with low expression of PD‐1 and LAG3 (n = 5–7 mice per group).

- A–D
Endogenous and transferred CD8 T cells were analyzed by flow cytometry: KLRG1+ and/or CD127+ (A), PD‐1+LAG3+ (B), TIM3+TCF‐1− (C) and TOX+ (D) (n = 9 PKO, 9 PKO + ATCT, 7 WT). Data information: Data are mean ± SEM with n (A–D) 7–9 mice in 3 experiments. Statistics: Mann–Whitney test (A–D). ****P ≤ 0.0001.
- E
Exemplary gating strategy: (1) gating on lymphocytes; (2) exclusion of doublets; (3) determination of the frequency of CD4 and CD8 T cells, gating on CD8 T cells; (4) discrimination of CD45.1+ and CD45.2+ CD8 T cells; (5) analysis of CD45.1+ or CD45.2+ LCMV‐GP33–41‐specific CD8 T cells.
References
-
- Battegay M, Cooper S, Althage A, Bänziger J, Hengartner H, Zinkernagel RM (1991) Quantification of lymphocytic choriomeningitis virus with an immunological focus assay in 24‐ or 96‐well plates. J Virol Methods 33: 191–198 - PubMed
Publication types
MeSH terms
LinkOut - more resources
Full Text Sources
Molecular Biology Databases
Research Materials
