

Lactate dehydrogenases promote glioblastoma growth and invasion via a metabolic symbiosis
- PMID: 36278433
- PMCID: PMC9728051
- DOI: 10.15252/emmm.202115343
Lactate dehydrogenases promote glioblastoma growth and invasion via a metabolic symbiosis
Abstract
Lactate is a central metabolite in brain physiology but also contributes to tumor development. Glioblastoma (GB) is the most common and malignant primary brain tumor in adults, recognized by angiogenic and invasive growth, in addition to its altered metabolism. We show herein that lactate fuels GB anaplerosis by replenishing the tricarboxylic acid (TCA) cycle in absence of glucose. Lactate dehydrogenases (LDHA and LDHB), which we found spatially expressed in GB tissues, catalyze the interconversion of pyruvate and lactate. However, ablation of both LDH isoforms, but not only one, led to a reduction in tumor growth and an increase in mouse survival. Comparative transcriptomics and metabolomics revealed metabolic rewiring involving high oxidative phosphorylation (OXPHOS) in the LDHA/B KO group which sensitized tumors to cranial irradiation, thus improving mouse survival. When mice were treated with the antiepileptic drug stiripentol, which targets LDH activity, tumor growth decreased. Our findings unveil the complex metabolic network in which both LDHA and LDHB are integrated and show that the combined inhibition of LDHA and LDHB strongly sensitizes GB to therapy.
Keywords: antiepileptic drug; energy metabolism; glioblastoma; invasion; lactate dehydrogenases.
© 2022 The Authors. Published under the terms of the CC BY 4.0 license.
Figures
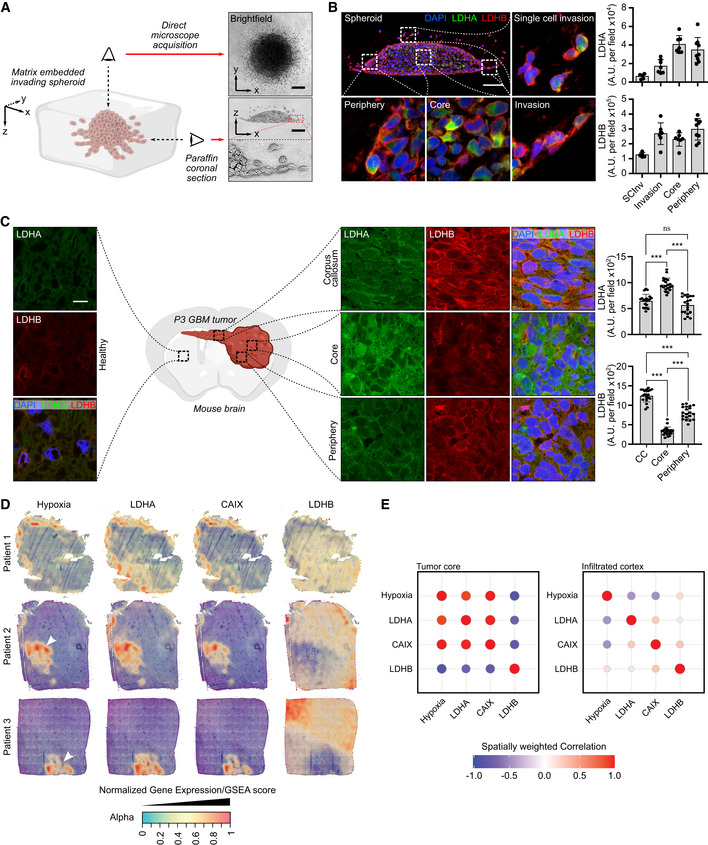
Left, 3D representation of an invading P3 spheroid embedded in a collagen I matrix. Right, upper view: brightfield microscope image, lower view: coronal section of an invading spheroid. Scale bar: 100 μm.
Coronal section of a P3 spheroid embedded with paraffin and stained with DAPI (blue), LDHA (green), and LDHB (red). Magnification boxes show different areas as depicted in the main image. Quantification of LDHA and LDHB staining was performed on the spheroid areas as indicated in the graphs. Scale bar: 100 μm. Data are represented as mean ± s.d. (5–8 fields per area of interest, one representative spheroid of three independent invading spheroids).
Coronal section of P3 tumors in a mouse brain, embedded with paraffin and stained with DAPI (blue), LDHA (green), and LDHB (red). Magnification shows areas as depicted in the central illustration. Quantification of LDHA and LDHB staining was performed on the tumor areas as indicated in the graphs. Scale bar: 15 μm. Data are represented as mean ± s.d. (20 fields per area of interest, one representative brain of two independently implanted mouse brains) and analyzed using one‐way ANOVA followed by Tukey's multiple comparisons test. LDHA: CC vs. Core, P < 0.0001; CC vs. Periphery, P = 0.18; Core vs. Periphery, P < 0.0001. LDHB: CC vs. Core, P < 0.0001; CC vs. Periphery, P < 0.0001; Core vs. Periphery, P < 0.0001.
Surface plots of the expression of LDHA, LDHB, CA9, and gene set enrichment for hypoxia, in various stRNA samples (patients 1–3). The transparency of the spots is indicative of the expression/enrichment for the genes, with an additional layer of color based on expression/enrichment.
Spatially weighted correlation analysis of LDHA, LDHB, CAIX, and gene set enrichment for hypoxia, separated between the tumor core and the infiltrating areas.
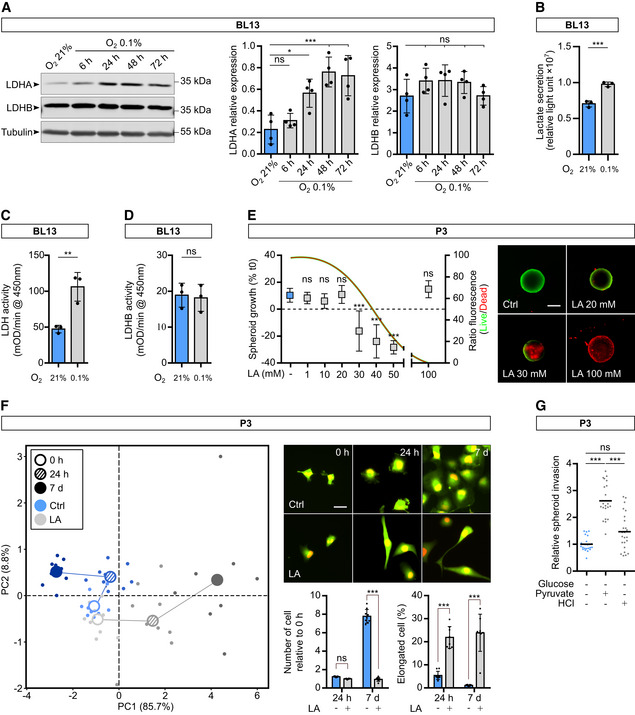
Western blot analysis of LDHA and LDHB from BL13 cells upon exposure to 21% or 0.1% O2 during 6, 24, 48, and 72 h. The graphs represent densitometry quantification of the immunoblots normalized to tubulin (n = 4 independent experiments). Data are represented as mean ± s.d. and analyzed using one‐Way ANOVA following Dunnett's multiple comparisons test. LDHA: O2 21% vs. O2 0.1% 6 h, P = 0.81; O2 21% vs. O2 0.1% 24 h, P = 0.01; O2 21% vs. O2 0.1% 48 h, P = 0.0002; O2 21% vs. O2 0.1% 72 h, P = 0.0004. LDHB: O2 21% vs. O2 0.1% 6 h, P = 0.35; O2 21% vs. O2 0.1% 24 h, P = 0.34; O2 21% vs. O2 0.1% 48 h, P = 0.44; O2 21% vs. O2 0.1% 72 h, P > 0.99.
Lactate secretion of BL13 cells exposed to 21% or 0.1% O2 measured by bioluminescent assay using a pro‐luciferin reductase substrate converted to luciferin in the presence of NADH (n = 3 independent experiments). Data are represented as mean ± s.d. and analyzed using unpaired t‐test: P = 0.0009.
Enzymatic assays for the activity of LDH enzymes in BL13 cells (n = 3 independent experiments). Data are represented as mean ± s.d. and analyzed using unpaired t‐test: P = 0.008.
Enzymatic assays for the activity of immune‐captured LDHB in BL13 cells (n = 3 independent experiments). Data are represented as mean ± s.d. and analyzed using unpaired t‐test: P = 0.81.
P3 spheroid cytotoxicity assay was recorded over 24 h when incubated with or without lactic acid at different concentrations (1, 10, 20, 30, 40, 50, and 100 mM). Area of spheroids was measured at 0 and 24 h. Growth is represented as a percentage of the spheroid area when compared to time 0, and viability is estimated with live/dead fluorescence ratio at 24 h and represented as a fitted curve (n = 3 independent experiments, one experiment including 8–10 spheroids per condition). Data are represented as mean ± s.d. and growth at 72 h are analyzed using Kruskal–Wallis test followed by Dunn's multiple comparison test: Control vs. LA 1 mM, P > 0.99; Control vs. LA 10 mM, P = 0.27; Control vs. LA 20 mM, P > 0.99; Control vs. LA 30 mM, P < 0.0001; Control vs. LA 40 mM, P < 0.0001; Control vs. LA 50 mM, P < 0.0001; Control vs. LA 100 mM, P = 0.77. Images of representative spheroids in each condition (in green, calcein; in red, ethidium homodimer‐1). Scale bar: 250 μm.
Principal component analysis of morphologic data on P3 cells incubated 7 days with or without lactate (20 mM). Cell number and morphology were measured at 0 h, 24 h, and 7 days (n = 3 independent experiments, one experiment including 2–3 independent cell dishes). Images of representative adherent cells in each condition (in green, GFP; in red, nuclear Tomato). Scale bar: 40 μm. The graphs represent quantification of the cell number and elongated cells (Aspect ratio > 2:5; n = 3). Data are represented as mean ± s.d. and analyzed using two‐way ANOVA followed by Sidak's multiple comparisons test. Number of cell: 24 h, P = 0.43; 7 days, P < 0.0001. Elongated cell: 24 h, P < 0.0001; 7 days, P < 0.0001.
P3 spheroid invasion in collagen I gel incubated 24 h at 21% O2 and treated with 20 mM pyruvate or 1.5 mM HCl. Invasion rate is expressed as a fold change of the control (n = 3 independent experiments, one experiment including 6–8 spheroids per condition). Data are represented as mean ± s.d. and analyzed using Kruskal–Wallis test followed by Dunn's multiple comparison test: Control vs. Pyruvate, P < 0.0001; Control vs. HCL, P = 0.09; Pyruvate vs. HCL, P = 0.0002.
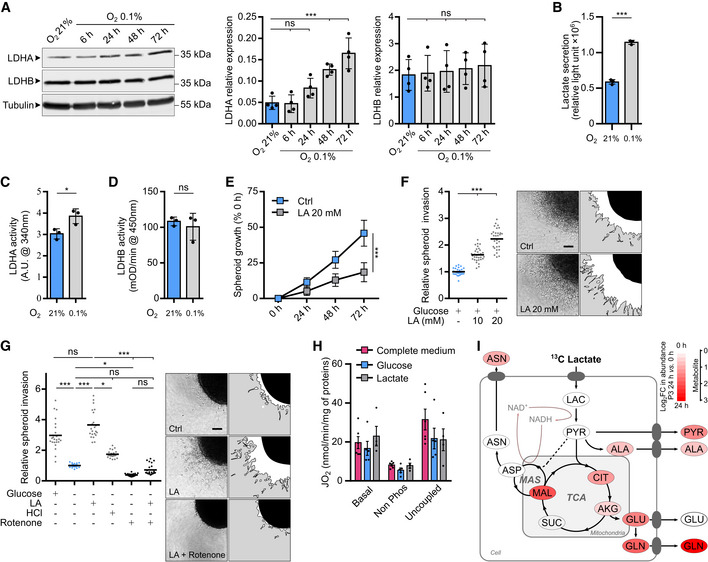
Western blot analysis of LDHA and LDHB from P3 cells upon exposure to 21% or 0.1% O2 for 6, 24, 48, and 72 h. The graphs represent densitometry quantification of immunoblots normalized to tubulin (n = 4 independent experiments). Data are represented as mean ± s.d. and analyzed using one‐Way ANOVA following Dunnett's multiple comparisons tests. LDHA: O2 21% vs. O2 0.1% 6 h, P > 0.99; O2 21% vs. O2 0.1% 24 h, P = 0.15; O2 21% vs. O2 0.1% 48 h, P = 0.0009; O2 21% vs. O2 0.1% 72 h, P < 0.0001. LDHB: O2 21% vs. O2 0.1% 6 h, P > 0.99; O2 21% vs. O2 0.1% 24 h, P > 0.99; O2 21% vs. O2 0.1% 48 h, P = 0.97; O2 21% vs. O2 0.1% 72 h, P = 0.88.
Lactate secretion of P3 cells exposed to 21 or 0.1% O2 was measured with a bioluminescent assay using a pro‐luciferin reductase substrate converted to luciferin in the presence of NADH (n = 3 independent experiments). Data are represented as mean ± s.d. and analyzed using unpaired t‐test: P < 0.0001.
Enzymatic assays for the activity of LDHA in P3 cells (n = 3 independent experiments). Data are represented as mean ± s.d. and analyzed using unpaired t‐test: P = 0.03.
Enzymatic assays for the activity of immune‐captured LDHB in P3 cells (n = 3 independent experiments). Data are represented as mean ± s.d. and analyzed using unpaired t‐test: P = 0.54.
P3 spheroid growth was recorded over 72 h during incubation with or without 20 mM lactate. Area of spheroids was measured at 0, 24, 48, and 72 h, and growth is represented as a percentage of spheroid area compared to time 0 (n = 3 independent experiments, one experiment including 9–10 spheroids per condition). Data are represented as mean ± s.d., and growth at 72 h is analyzed using unpaired t‐test: P < 0.0001.
P3 spheroid invasion in collagen I gel incubated 24 h at 21% O2 and incubated with 10 or 20 mM lactate (LA). Invasion rate is expressed as a fold change to the control (n = 4 independent experiments, one experiment including 6–8 spheroids per condition). Data are represented as mean and analyzed using Kruskal–Wallis test followed by Dunn's multiple comparisons test: Control vs. LA 10 mM, P < 0.0001; Control vs. LA 20 mM, P < 0.0001; LA 10 mM vs. LA 20 mM, P = 0.0009. Images of representative invasive spheroids in each condition. Scale bar: 100 μm.
P3 spheroid invasion in collagen I gel incubated 24 h at 0.1% O2 and incubated with 20 mM lactate, 20 μM rotenone, and 1.5 mM HCl. Invasion rate is expressed as a fold change of the control (n = 4 independent experiments, one experiment including 6–8 spheroids per condition). Data are represented as mean and analyzed using Kruskal–Wallis test followed by Dunn's multiple comparisons tests: Control vs. Control + Glucose, P < 0.0001; Control vs. LA, P < 0.0001; Control vs. HCL, P = 0.11; Control vs. Rotenone, P = 0.01; Control vs. Rotenone + LA, P > 0.99; Control + Glucose vs. LA, P > 0.99; LA vs. HCL, P = 0.02; LA vs. Rotenone, P < 0.0001; LA vs. Rotenone + LA, P < 0.0001. Images of representative invasive spheroids in each condition. Scale bar: 100 μm.
P3 cell mass‐specific respiration obtained by oxygraphy analysis. Cells were cultured in (i) complete medium or in medium without glucose and pyruvate supplemented with either (ii) 10 mM glucose or (iii) 20 mM lactate (n = at least four independent experiments). Data are represented as mean ± s.e.m. and analyzed using two‐way ANOVA followed by Tukey's multiple comparisons test (no statistical difference between conditions, P∈[0.6; 0.9999]). JO2 Basal: baseline mitochondrial respiration (oxygen consumption rate), JO2 non‐phosphorylating (non‐phos): minimal respiratory capacity, and JO2 uncoupled: maximal respiratory capacity.
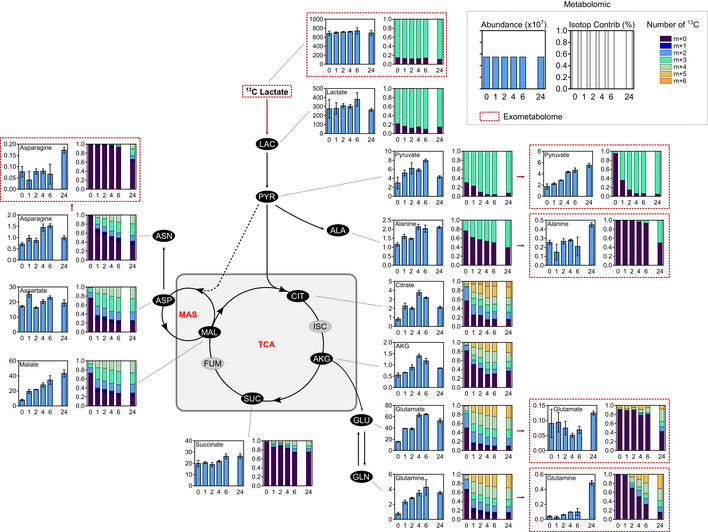
Metabolic changes of central carbon metabolism on P3 cells infused with [13C3] lactate for 24 h. Metabolites are labeled with a colored oval whose color corresponds to log2 fold changes between 24 h and 0 h (red, increase in 24 h) (n = 3 independent cell dishes). AKG, alpha‐ketoglutarate; ALA, alanine; ASN, asparagine; ASP, aspartate; CIT, citrate; GLN, glutamine; GLU, glutamate; LAC, lactate; MAL, malate; MAS, Malate–Aspartate Shuttle; PYR, pyruvate; SUC, succinate; TCA, TriCarboxylic Acid cycle. See also Appendix Figs S4 and S5.
- A
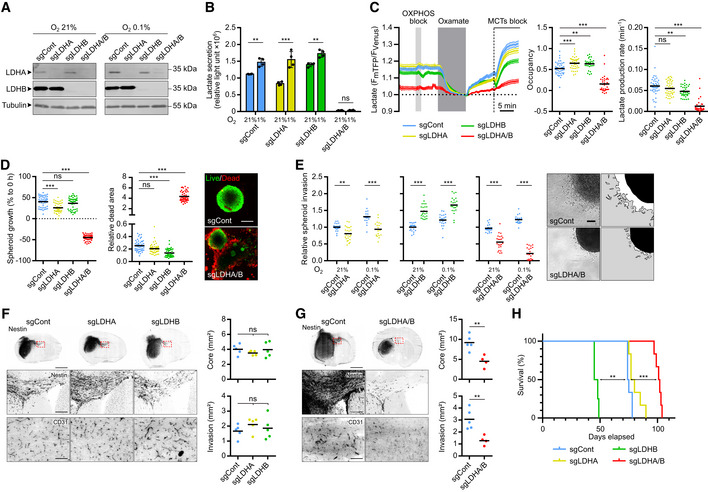
Western blot analysis of LDHA and LDHB expression in P3 cells transduced with CRISPR‐Cas9 lentiviral vectors with scramble sequence (sgControl) or against LDHA (sgLDHA), LDHB (sgLDHB) or both (sgLDHA/B). Knockout (KO) cells were exposed to 21% or 1% O2 for 48 h.
- B
Lactate secretion of P3 cells KO for LDHA, LDHB, or both, exposed to 21% or 1% (n = 4 independent experiments). Data are represented as mean ± s.d. and analyzed using two‐way ANOVA followed by Tukey's multiple comparisons test: sgCont 21% vs. sgCont 1%, P = 0.002; sgLDHA 21% vs. sgLDHA 1%, P < 0.0001; sgLDHB 21% vs. sgLDHB 1%, P = 0.004; sgLDHA/B 21% vs. sgLDHA/B 1%, P > 0.99; sgCont/sgLDHA/sgLDHB vs. sgLDHA/B, P < 0.0001.
- C
Intracellular lactate level analyzed with a fluorescent biosensor in P3 cells (control, KO for LDHA, LDHB, or both). Left, lactate level monitored in basal condition, followed by sequential exposure to OXPHOS block (5 mM sodium azide), 6 mM oxamate, and MCTs blockers (1 μM AR‐C1558585 + 1 mM diclofenac). The response to oxamate and MCTs blockers was used to determine, Middle, the basal lactate level (expressed as biosensor occupancy) and, Right, the lactate production rate (n = 4, 33–44 cells analyzed per condition). Data are represented as mean ± s.e.m. (Left) or as mean (Middle and Right) and analyzed using one‐way ANOVA following Tukey's multiple comparisons test. Occupancy: sgCont vs. sgLDHA, P = 0.001; sgCont vs. sgLDHB, P = 0.005; sgCont vs. sgLDHA/B, P < 0.0001. Lactate production: sgCont vs. sgLDHA, P = 0.32; sgCont vs. sgLDHB, P = 0.01; sgCont vs. sgLDHA/B, P < 0.0001. See Materials and Methods for analysis details and see also Fig EV3D.
- D
Left: P3 spheroid growth recorded over 1 week at 1% O2 (n = 3 independent experiments, one experiment including 16 spheroids per condition). Data are represented as mean and analyzed using Kruskal–Wallis test followed by Dunn's multiple comparisons test. Spheroid growth: sgCont vs. sgLDHA, P = 0.0003; sgCont vs. sgLDHB, P = 0.78; sgCont vs. sgLDHA/B, P < 0.0001. Dead area: sgCont vs. sgLDHA, P = 0.19; sgCont vs. sgLDHB, P < 0.0001; sgCont vs. sgLDHA/B, P < 0.0001. Right: Viability of spheroids at 1 week, incubated with calcein (green) or ethidium homodimer‐1 (red). Scale bar: 200 μm.
- E
P3 spheroid invasion in collagen I gel, incubated 24 h at 21% or 0.1% O2. Invasion rate is expressed as fold change from controls (n = 4 independent experiments, one experiment including 6–8 spheroids per condition). Data are represented as mean and analyzed using two‐way ANOVA followed by Tukey's multiple comparisons test: sgCont 21% vs. sgLDHA 21%, P = 0.003; sgCont 0.1% vs. sgLDHA 0.1%, P < 0.0001; sgCont 21% vs. sgLDHB 21%, P < 0.0001; sgCont 0.1% vs. sgLDHB 0.1%, P < 0.0001; sgCont 21% vs. sgLDHA/B 21%, P < 0.0001; sgCont 0.1% vs. sgLDHA/B 0.1%, P < 0.0001. Images of representative of control or LDHA/B KO spheroids. Scale bar: 100 μm.
- F, G
A first cohort of mice was sacrificed when one mouse reached a limit point, brains were extracted, snap‐frozen in liquid nitrogen, sliced, and stained. For the second cohort, each mouse was sacrificed when it reached a limit point allowing the draw of survival curves. Left: Immunofluorescence staining of Nestin (top and middle) and CD31 (bottom) of control and LDHA/B KO P3 tumor section. Scale bars: 2 mm (top), 250 μm (middle) and 100 μm (bottom). Right: Graphs represent tumor core and invasion area of control and LDHA/B KO P3 tumors in mm2 (n = 5 mice per group, average of 5–6 sections per tumor). Data are represented as mean. For (F), data are analyzed using one‐way ANOVA followed by Dunnett's multiple comparisons test. Core: sgCont vs. sgLDHA, P = 0.48; sgCont vs. sgLDHB, P = 0.99. Invasion: sgCont vs. sgLDHA, P = 0.40; sgCont vs. sgLDHB, P = 0.81. For G, data are analyzed using unpaired t‐test. Core: sgCont vs. sgLDHA/B, P = 0.005. Invasion: sgCont vs. sgLDHA/B, P = 0.01.
- H
Kaplan–Meier survival curves of xenotransplanted mice with P3 cells KO for LDHA (yellow), LDHB (green), LDHA/B (red), or control (blue) (n = 8 mice per group). Data are analyzed using Log‐rank (Mantel‐Cox) test: sgCont vs. sgLDHA, P = 0.06; sgCont vs. sgLDHB, P = 0.001; sgCont vs. sgLDHA/B, P = 0.0007.
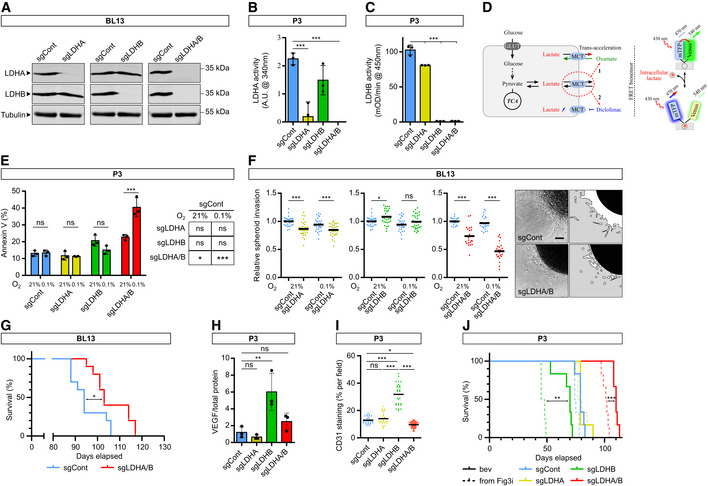
Western blot analysis of LDHA and LDHB from BL13 cells knockout by CRISPR‐Cas9 lentiviral vectors against LDHA, LDHB, or both, and upon exposure to 21% O2.
Enzymatic assays for the activity of LDHA in P3 cells (n = 3 independent experiments). Data are represented as mean ± s.d. and analyzed using one‐way ANOVA followed by Dunnett's multiple comparison test: sgCont vs. sgLDHA, P = 0.0005; sgCont vs. sgLDHB, P = 0.1; sgCont vs. sgLDHA/B, P < 0.0001.
Enzymatic assays for the activity of immune‐captured LDHB in P3 cells (n = 3 independent experiments). Data are represented as mean ± s.d. and analyzed using one‐way ANOVA followed by Dunnett's multiple comparison test: sgCont vs. sgLDHA, P = 0.0002; sgCont vs. sgLDHB, P < 0.0001; sgCont vs. sgLDHA/B, P < 0.0001.
Schematic representation of the intracellular lactate level monitoring with a fluorescent biosensor. The presence of the lactate changes the conformation of the biosensor and fluorescence emission. Known as an accelerated‐exchange transport (trans‐acceleration), oxamate was used to quickly release the lactate out of the cells for the determination of the lactate basal level. Then, diclofenac was used to block the lactate transporter for the quantification of the lactate production rate.
Cells incubated during 48 h at 21% or 0.1% O2, labeled with Annexin‐V FITC, and analyzed by cytometry (n = 3 independent experiments). Data are represented as mean ± s.d. and analyzed using two‐way ANOVA followed by Tukey's multiple comparison test: sgCont 21% vs. sgCont 0.1%, P > 0.99; sgLDHA 21% vs. sgLDHA 0.1%, P > 0.99; sgLDHB 21% vs. sgLDHB 0.1%, P = 0.3, sgLDHA/B 21% vs. sgLDHA/B 0.1%, P < 0.0001. Table of statistical comparisons of Annexin‐V signal in sgLDHA, sgLDHB and sgLDHA/B cells with respective control (either 21 or 0.1% O2): sgCont 21% vs. sgLDHA 21%, P > 0.99; sgCont 0.1% vs. sgLDHA 0.1%, P = 0.98; sgCont 21% vs. sgLDHB 21%, P = 0.07; sgCont 0.1% vs. sgLDHB 0.1%, P > 0.99; sgCont 21% vs. sgLDHA/B 21%, P = 0.01; sgCont 0.1% vs. sgLDHA/B 0.1%, P < 0.0001.
BL13 spheroid invasion in collagen I gel incubated 24 h at 21 or 0.1% O2. Invasion rate is expressed as a fold change of the control (n = 4 independent experiments, one experiment including 7–8 spheroids per condition). Data are represented as mean and analyzed using two‐way ANOVA test followed by Tukey's multiple comparison test: sgCont 21% vs. sgLDHA 21%, P < 0.0001; sgCont 0.1% vs. sgLDHA 0.1%, P = 0.001; sgCont 21% vs. sgLDHB 21%, P = 0.03; sgCont 0.1% vs. sgLDHB 0.1%, P = 0.29; sgCont 21% vs. sgLDHA/B 21%, P < 0.0001; sgCont 0.1% vs. sgLDHA/B 0.1%, P < 0.0001. Images of representative invasive sgControl or sgLDHA/B spheroids. Scale bar: 100 μm.
Kaplan–Meier survival curves of xenotransplanted mice with BL13 cells KO for LDHA/B (red) or control (blue) (n = 10 mice per group). Data are analyzed using log‐rank (Mantel‐Cox) test: P = 0.02.
Supernatants were collected from each cell line and analyzed by using ELISA to detect VEGF (n = 3 independent experiments). Data are represented as mean ± s.d. and analyzed using one‐way ANOVA followed by Dunnett's multiple comparison test: sgCont vs. sgLDHA, P = 0.91; sgCont vs. sgLDHB, P = 0.004; sgCont vs. sgLDHA/B, P = 0.5.
Tumor blood vessels were stained with anti‐CD31 antibodies and CD31 staining area was calculated over tumor area (related to Figs 3F and G). Data are represented as mean and analyzed using one‐way ANOVA followed by Tukey's multiple comparison test: sgCont vs. sgLDHA, P = 0.81; sgCont vs. sgLDHB, P < 0.0001; sgCont vs. sgLDHA/B, P = 0.034; sgLDHA vs. sgLDHB, P < 0.0001; sgLDHB vs. sgLDHA/B, < 0.0001.
Kaplan–Meier survival curves complement of Fig 3H where xenotransplanted mice with LDHA/B KO P3 spheroids were treated by bevacizumab (n = 8 mice per group). Data are analyzed using log‐rank (Mantel‐Cox) test: sgLDHB vs. sgLDHB + bevacizumab, P = 0.001; sgLDHA/B vs. sgLDHA/B + bevacizumab, P = 0.0005.
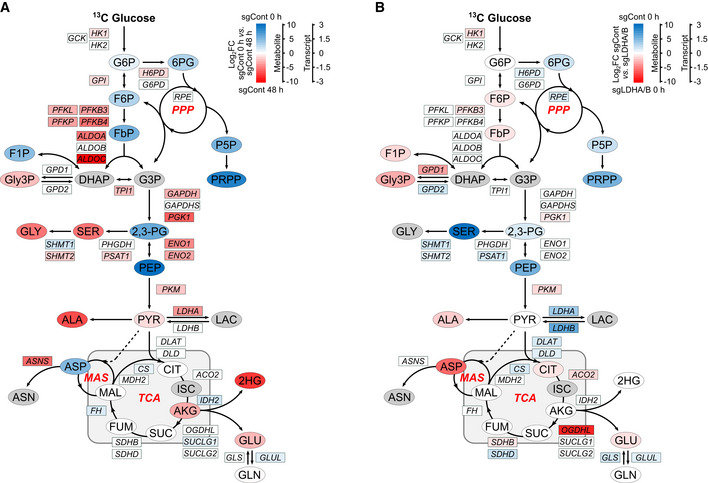
sgCont 0 h and sgCont 48 h at 0.1% O2 (blue, increase in sgCont 0 h; red, increase in sgCont 48 h; gray, not measured or not computable).
sgCont 0 h and sgLDHA/B 0 h (blue, increase in sgCont 0 h; red, increase in sgLDHA/B 0 h; gray, not measured or not computable). For details, see also Figs 4 and EV5.
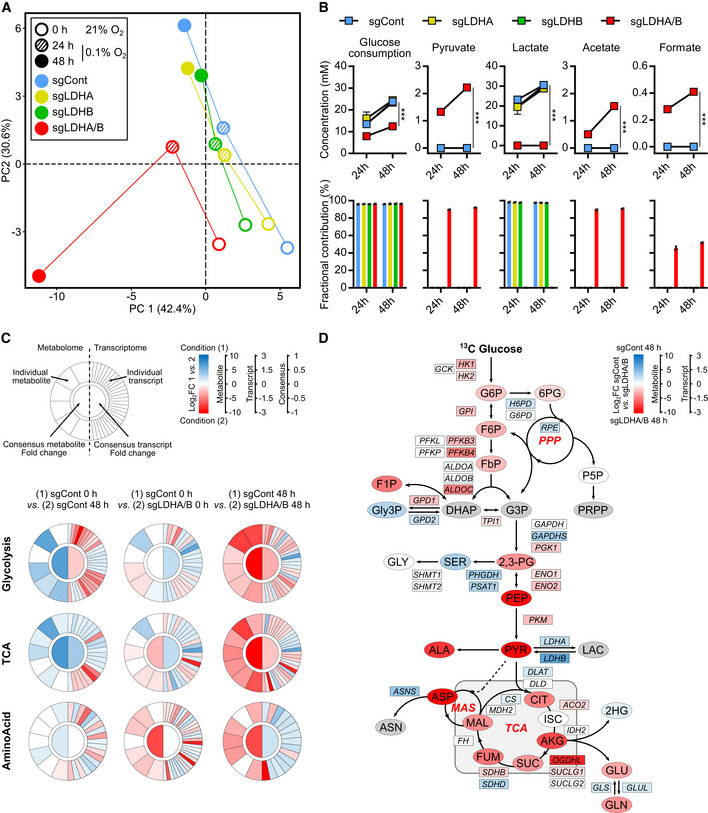
Principal component analysis of metabolomic data from cell extracts.
Metabolites from cell medium. Top, concentration of metabolite consumed ([13C] glucose) or secreted (pyruvate, lactate, acetate, formate) by cells. Data are represented as mean ± s.d. and analyzed using two‐way ANOVA followed by Sidak's multiple comparisons test: for all metabolites, sgCont/sgLDHA/sgLDHB vs. sgLDHA/B, P < 0.0001. Bottom, amount of labeled isotopes relative to the total amount of this element, expressed as a percentage (fractional contribution) Data are represented as mean ± s.d.
Circular metabologram illustrating metabolic and transcriptomic differences in metabolite pathways between LDH KO P3 cells. The metabologram is divided in two parts, the left corresponds to metabolomic analysis and the right to the transcriptomic analysis. The outer circle corresponds to the log2 fold change for each metabolite (left) and transcripts (right). The central circle displays the average fold change of all analytes.
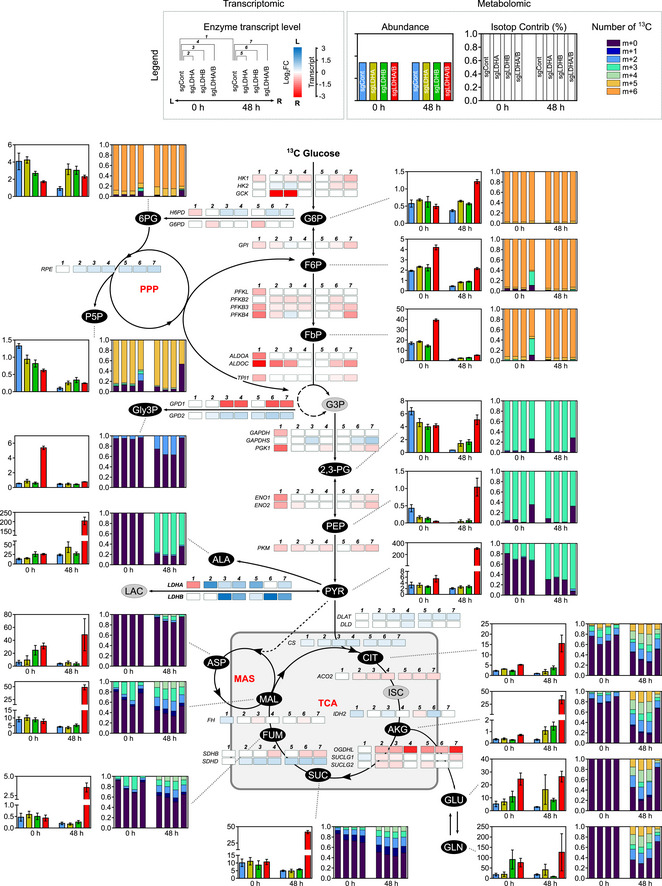
Metabolic changes of central 13‐labeled‐carbon metabolism in LDH KO P3 cells infused with [13C6] glucose at 1% O2 for 48 h. Metabolites are labeled with a colored oval and enzyme transcripts with a colored square, colors correspond to the log2 fold changes between sgControl and sgLDHA/B (blue, increase in sgControl; red, increase in sgLDHA/B; gray, not measured or not computable). For legend, see also Fig 2I; 2,3‐PG: 2,3‐Phosphoglycerate; 2HG: 2‐Hydroxyglutarate; 6PG: 6‐Phosphogluconate; DHAP: Dihydroxyacetone Phosphate; F1P: Fructose‐1‐Phosphate; F6P: Fructose‐6‐Phosphate; FbP: Fructose‐bisPhosphate; G3P: Glyceraldehyde‐3‐Phosphate; G6P: Glucose‐6‐Phosphate; GLY: Glycine, SER: Serine; Gly3P: Glycerol‐3‐Phosphate; P5P: Pyridoxal‐5‐Phosphate; PEP: Phosphoenolpyruvate; PPP: Pentose Phosphate Pathway; PRPP: Phosphoribosylpyrophosphate.
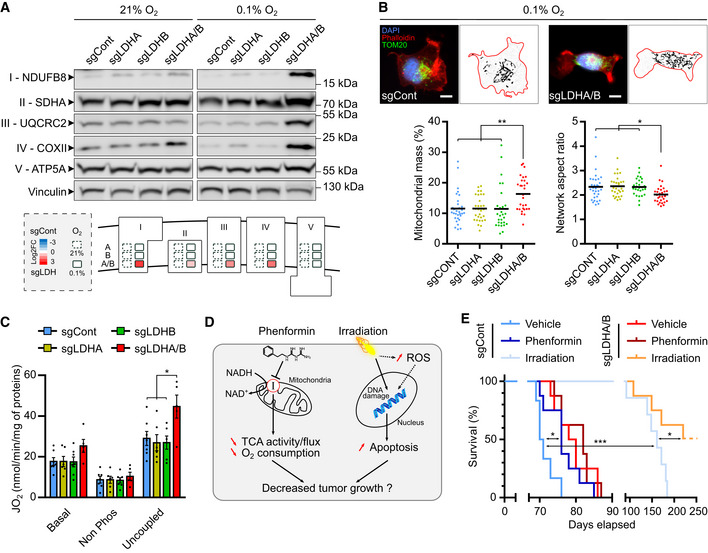
Western blot analysis of mitochondrial respiratory chain subunits from LDH KO P3 cells upon exposure to 21% or 0.1% O2. Roman numbers indicate the respiratory complex number. The diagram below represents densitometry quantification of the immunoblots normalized to vinculin and expressed as log2 foldchange to control cells in 21% and 0.1% O2 (n = 3 independent experiments).
Epifluorescence (top) and quantitative image analysis (bottom) of immune‐stained mitochondria (TOM20, green) from LDH KO P3 cells (Phalloidin, red; DAPI, blue) upon exposure to 0.1% O2 (n = 2 independent experiments, 28–32 cells per group). Data are represented as mean and analyzed using one‐way ANOVA followed by Tukey's multiple comparisons test. Mitochondrial mass: sgCont vs. sgLDHA/B, P = 0.005; sgLDHA/sgLDHB vs. sgLDHA/B, P = 0.006. Network aspect ratio: sgCont vs. sgLDHA/B, P = 0.03; sgLDHA vs. sgLDHA/B, P = 0.02; sgLDHB vs. sgLDHA/B, P = 0.04. Mitochondrial mass corresponds to the area covered by the mitochondria relative to the entire cell area. Network aspect ratio is the ratio of the major axis to minor axis of the mitochondrial network. Scale bar: 10 μm.
LDH KO P3 cell mass‐specific respiration obtained by oxygraphy analysis (n = 4 independent experiments). Data are represented as mean ± s.e.m. and analyzed using two‐way ANOVA followed by Tukey's multiple comparisons test: sgCont vs. sgLDHA/B, P = 0.015; sgLDHA/sgLDHB vs. sgLDHA/B, P = 0.005. For details, see Fig 2H.
Schematic representation of phenformin or irradiation effects on tumor cells.
Kaplan–Meier survival curves of xenotransplanted mice with LDHA/B KO (red) or control (blue) P3 cells, treated with phenformin or irradiated with 10 Gy (n = 6–8 mice per group). Data are analyzed using Log‐rank (Mantel‐Cox) test: sgCont Vehicle vs. sgCont Phenformin, P = 0.019; sgCont Vehicle vs. sgCont Irradiation, P = 0.0002; sgCont Irradiation vs. sgLDHA/B Irradiation, P = 0.024.
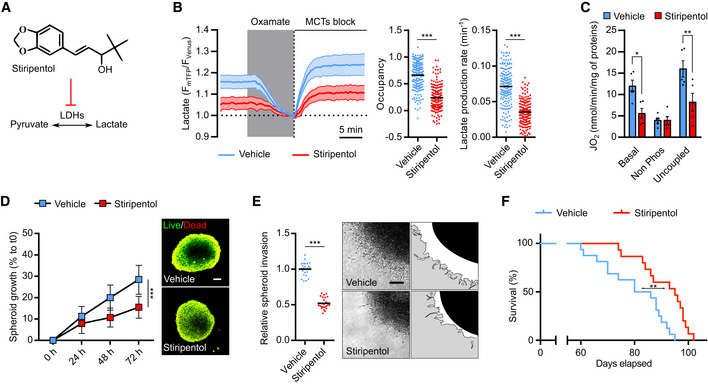
Stiripentol, an aromatic allylic alcohol drug that inhibits LDH.
Intracellular lactate level was analyzed with a fluorescent biosensor in P3 cells treated with vehicle or 500 μM stiripentol. Left, lactate level monitored in basal condition, followed by sequential exposure to 6 mM oxamate and MCTs block (1 μM AR‐C1558585 + 1 mM diclofenac). The response to oxamate and MCTs block was used to determine, Middle, the basal lactate level (expressed as biosensor occupancy) and, Right, the lactate production rate (n = 4, 33–45 cells analyzed per condition). Data are represented as mean ± s.e.m. (Left) or as mean (Middle and Right) and analyzed using unpaired t‐test (Occupancy) and Mann–Whitney test (Lactate production). For both analyses, P < 0.0001.
P3 cell mass‐specific respiration in cells treated with 500 μM stiripentol, obtained by high‐resolution oxygraphy analysis (n = 5 independent experiment). Data are represented as mean ± s.d. and analyzed using two‐way ANOVA followed by Sidak's multiple comparisons test: Basal, P = 0.013; Non‐Phos, P > 0.99; Uncoupled, P = 0.003 For details, see Fig 2H.
Left: P3 spheroid growth recorded over 72 h during incubation with stiripentol at 0.1% O2 (n = 3 independent experiments, one experiment including eight spheroids per condition). Data are represented as mean ± s.d., and growth at 72 h is analyzed using unpaired t‐test: P < 0.0001. Right: Viability of spheroids at 72 h, incubated with calcein (green) or ethidium homodimer‐1 (red). Scale bar: 100 μm.
Left: P3 spheroid invasion in collagen I gel, incubated 24 h with 500 μM stiripentol at 0.1% O2. Invasion rate is expressed as fold change from control (n = 3 independent experiments, one experiment including eight spheroids per condition). Data are represented as mean and analyzed using unpaired t‐test: P < 0.0001. Right: Representative images of invasive spheroids for each condition. Scale bar: 100 μm.
Kaplan–Meier survival curves of xenotransplanted mice with P3 cells. Mice were treated either with vehicle (blue) or stiripentol at 150 mg/kg (red) (n = 15–16 mice per group). Data are analyzed using Log‐rank (Mantel‐Cox) test: P = 0.002.
References
-
- Altenberg B, Greulich KO (2004) Genes of glycolysis are ubiquitously overexpressed in 24 cancer classes. Genomics 84: 1014–1020 - PubMed
-
- Bittar PG, Charnay Y, Pellerin L, Bouras C, Magistretti PJ (1996) Selective distribution of lactate dehydrogenase isoenzymes in neurons and astrocytes of human brain. J Cereb Blood Flow Metab 16: 1079–1089 - PubMed
-
- Brisson L, Bański P, Sboarina M, Dethier C, Danhier P, Fontenille M‐J, Van Hée VF, Vazeille T, Tardy M, Falces J et al (2016) Lactate dehydrogenase B controls lysosome activity and autophagy in cancer. Cancer Cell 30: 418–431 - PubMed
Publication types
MeSH terms
Substances
LinkOut - more resources
Full Text Sources
Medical
Research Materials
Miscellaneous
