

The extracellular matrix fibulin 7 maintains epidermal stem cell heterogeneity during skin aging
- PMID: 36278510
- PMCID: PMC9724670
- DOI: 10.15252/embr.202255478
The extracellular matrix fibulin 7 maintains epidermal stem cell heterogeneity during skin aging
Abstract
Tissue stem cells (SCs) divide infrequently as a protective mechanism against internal and external stresses associated with aging. Here, we demonstrate that slow- and fast-cycling SCs in the mouse skin epidermis undergo distinct aging processes. Two years of lineage tracing reveals that Dlx1+ slow-cycling clones expand into the fast-cycling SC territory, while the number of Slc1a3+ fast-cycling clones gradually declines. Transcriptome analysis further indicate that the molecular properties of each SC population are altered with age. Mice lacking fibulin 7, an extracellular matrix (ECM) protein, show early impairments resembling epidermal SC aging, such as the loss of fast-cycling clones, delayed wound healing, and increased expression of inflammation- and differentiation-related genes. Fibulin 7 interacts with structural ECM and matricellular proteins, and the overexpression of fibulin 7 in primary keratinocytes results in slower proliferation and suppresses differentiation. These results suggest that fibulin 7 plays a crucial role in maintaining tissue resilience and epidermal SC heterogeneity during skin aging.
Keywords: epidermal stem cells; extracellular matrix; skin aging; slow-cycling cell; stem cell aging.
© 2022 The Authors.
Figures
- A
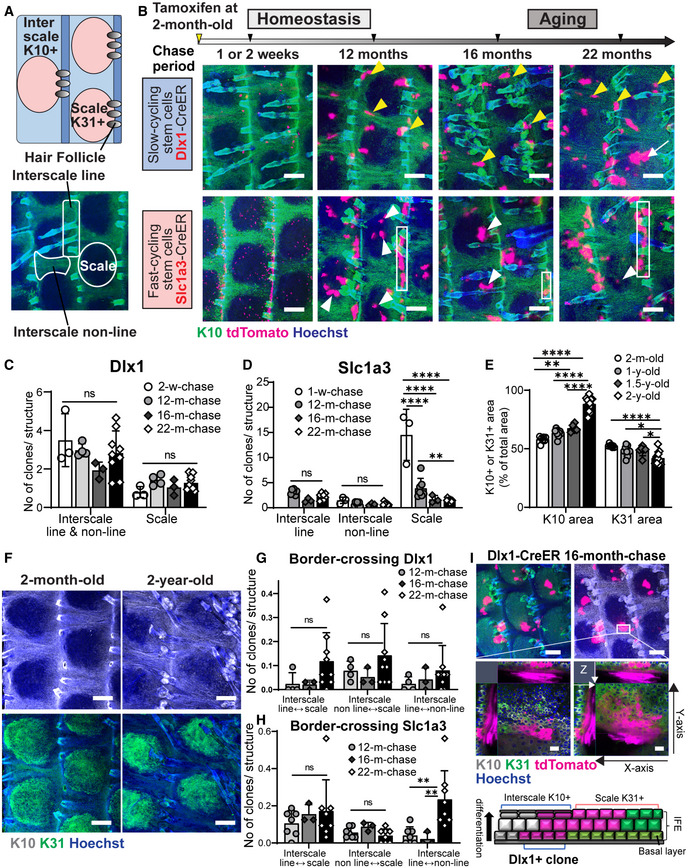
Upper diagram describes the interscale and scale localizations in the interfollicular epidermis (IFE), marked by keratin (K) 10 and K31, respectively. The lower wholemount (WM) tail epidermis image shows delineations of areas defined as scale, interscale line, and interscale non‐line.
- B
Low‐dose tamoxifen was administered once at 2 months of age for single‐cell labeling and samples were collected after 1–2‐week‐, 12‐, 16‐, and 22‐month‐chases. WM staining of the tail epidermis with tdTomato, K10, and Hoechst. Scale: bar: 200 μm. Yellow and white arrowheads are examples of Dlx1CreER+ interscale and Slc1a3CreER+ scale clones, respectively. White boxes indicate examples of Slc1a3CreER+ interscale line clones. A white arrow indicates a clone that is crossing the boundary.
- C
The number of Dlx1CreER+ clones per interscale or scale structure. ns., not significant. The number of mice and chase time: N = 3 (2 weeks), N = 4 (12 months), N = 3 (16 months), and N = 9 (22 months). w, week; m, month. ns, not significant.
- D
The number of Slc1a3CreER+ clones per interscale or scale structure. ****P < 0.0001. **P < 0.01. The number of mice and chase time: N = 3 (1 week), N = 7 (12 months), N = 3 (16 months), and N = 8 (22 months).
- E
Quantitation of K10+ or K31+ areas normalized to total IFE areas. The number of mice at age 2 months N = 7, 1 year N = 9, 1.5 years N = 6, 2 years N = 12. *P < 0.05. y, year.
- F
WM staining of K10 and K31 in 2‐month‐old compared with 2‐year‐old mice. Scale bar: 200 μm.
- G, H
The number of Dlx1CreER+ and Slc1a3CreER+ clones crossing the interscale–scale boundaries. The number of mice used is the same as in (C–D). **P < 0.01.
- I
Confocal imaging of representative clones at 1.5‐year‐chase, stained with K10 and K31. White box indicates area that is enlarged in the lower panel. Z‐stack images show the clone originating from the basal layer and expanding into the upper differentiated layers. Cartoon summarizes the sagittal view of the clones. Scale bars: 200 μm (upper panel), 20 μm (lower panel).
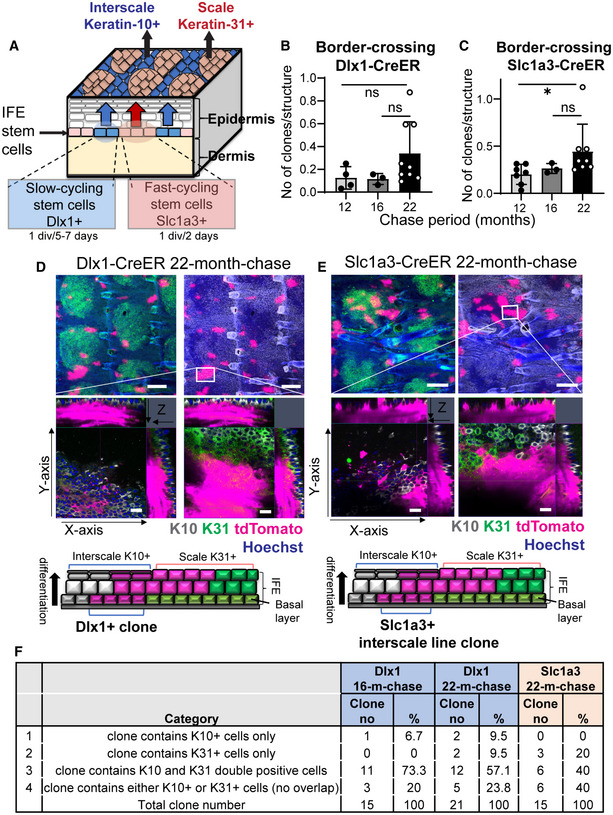
- A
Illustration of a mouse tail skin showing the slow‐ and fast‐cycling stem cells in the interfollicular epidermis (IFE) and their distinct differentiation program, giving rise to the interscale and scale regions, respectively.
- B, C
The total number of boundary‐crossing clones in Dlx1CreER and Slc1a3CreER lineage‐tracing mice. Dlx1CreER mice and chase time: N = 4 (12 months), N = 3 (16 months), and N = 9 (22 months). Slc1a3CreER mice and chase time: N = 7 (12 months), N = 3 (16 months), and N = 8 (22 months). One‐way ANOVA, Dunn's multiple comparisons test. ns, not significant; *P < 0.05. Data show mean ± SD. N reflects biological replicates, which are summarized from at least two independent experiments.
- D, E
Confocal imaging of representative clones at 2‐year‐chase, stained with K10 and K31. White boxes indicate areas that are enlarged in the lower panels. Z‐stack images show that the clones are originating from the basal layer and expanding into the upper differentiated layers. Cartoons summarize the sagittal view of the clones. Scale bar: 200 μm (upper panels), 20 μm (lower panels). K10 and K31 intensities were adjusted to similar levels between samples.
- F
Classification of the border‐crossing clones from Dlx1CreER and Slc1a3CreER lineage‐tracing mice at 16‐month‐ and 22‐month‐chases. Images of these clones were represented in Fig 1I and EV1D and E.
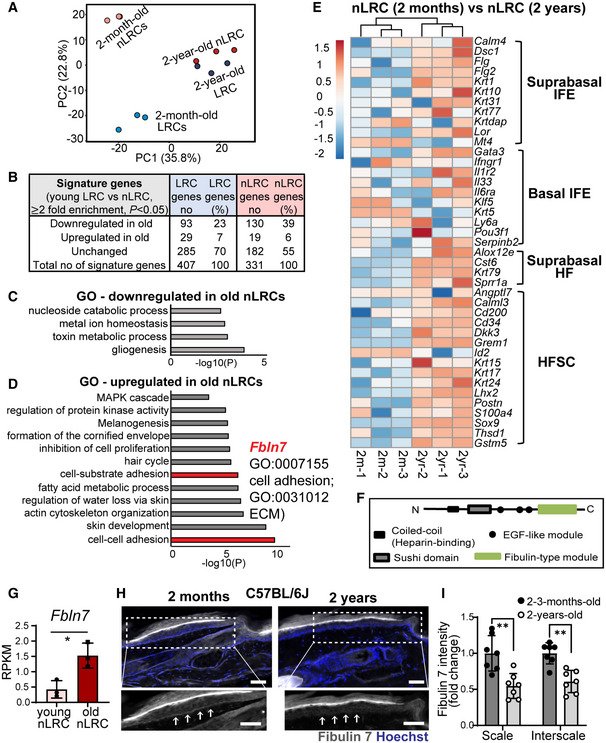
- A
Principal component analysis map describes the transcriptomic clustering of label‐retaining cells (LRCs) and non‐label retaining cells (nLRCs) constructed from threefold differentially expressed genes among 2‐month‐ (N = 3) and 2‐year‐old (N = 3) mice.
- B
Table summarizes the number of signature genes in young LRCs versus nLRCs and their respective changes in 2‐year‐old tail skin.
- C, D
Gene ontology (GO) analysis obtained from ≥twofold differentially regulated genes (P < 0.05) in 2‐year‐old nLRCs compared with 2‐month‐old mice.
- E
Heatmap shows basal and suprabasal signature genes of epidermal stem cells and HFSCs (Ge et al, 2020) in 2‐month‐old versus 2‐year‐old nLRCs. Scale bar reflects Z‐score. IFE, interfollicular epidermis; HF, hair follicle; HFSCs, hair follicle stem cells.
- F
Schematic of fibulin 7 protein structure.
- G
Fbln7 gene expression in 2‐month‐ versus 2‐year‐old nLRCs. N = 3 mice per group (t‐test). *P < 0.05. Data show mean ± SD.
- H, I
Fibulin 7 immunostaining in 2‐month‐ versus 2‐year‐old tail section (H) and its intensity quantification per basal epidermal stem cell/basement membrane (normalized to 2‐month‐old) (I). Dotted box areas were enlarged in the lower panels. White arrows indicate fibulin 7 basement membrane staining. Scale bar: 50 μm. Data show mean ± SD. **P < 0.01 (Mann–Whitney test). N = 7 mice per age group (biological replicates).
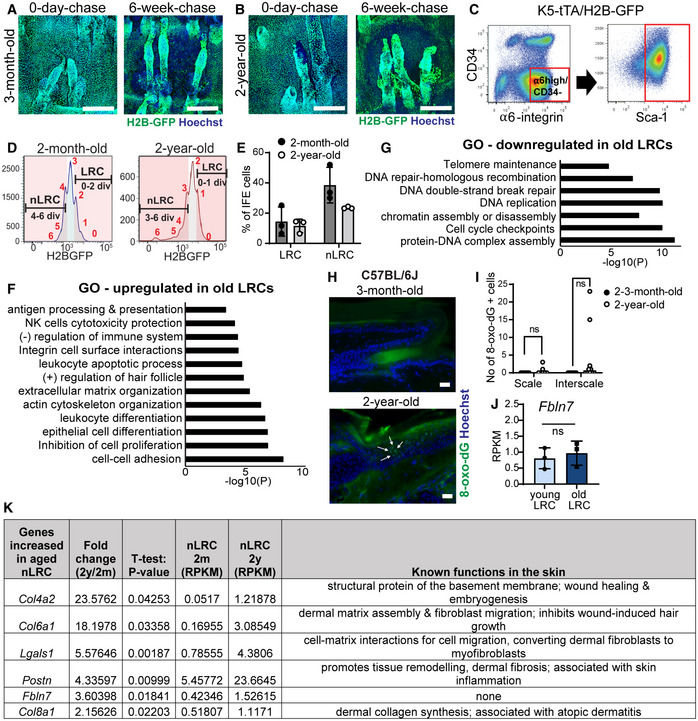
- A, B
Confocal imaging from wholemount tail epidermis showing GFP expression level in the basal cells before and after 6 weeks of doxycycline chase in the 3‐month‐old (A) and 2‐year‐old mice (B). Scale bar: 200 μm.
- C
FACS plots show isolation strategy of epidermal basal cells (α6‐integrinhigh/CD34−/Sca‐1+).
- D
FACS histograms illustrate isolation of label‐retaining cells (LRCs) and non‐label‐retaining cells (nLRCs) based on their GFP signal peaks representative of the number of cell divisions from young (2‐month‐old) and old (2‐year‐old) H2B‐GFP mice at 2 weeks doxycycline chase.
- E
Graph describes LRC or nLRC defined from their GFP dilution in (D) as percentages of basal interfollicular epidermal (IFE) cells in young and old H2B‐GFP mice. N = 3 mice per group.
- F, G
Gene ontology (GO) analysis obtained from ≥twofold differentially regulated genes (P < 0.05) in 2‐year‐old LRCs compared to 2‐month‐old mice.
- H
Immunostaining of DNA oxidation marker 8‐oxo‐dG in tail epidermis of 3‐month‐old versus 2‐year‐old C57BL6J mice. White arrows indicate positively stained cells in the interscale region. Scale bar: 20 μm.
- I
Graph summarizes the number of 8‐oxo‐dG positively stained cells in the scale or interscale regions of 2–3‐month‐old (N = 7) or 2‐year‐old mice (N = 10). Mann–Whitney test. ns, not significant. N reflects number of biological replicates summarized from two independent experiments.
- J
Fbln7 gene expression in 2‐month‐ versus 2‐year‐old LRCs. N = 3 mice per group (t‐test). Data show mean ± SD.
- K
Table shows 6 ECM genes significantly upregulated in the 2‐year‐old (aged) nLRCs and their known function in the skin (Abreu‐Velez & Howard, ; Theocharidis et al, ; Kuwatsuka & Murota, ; Pasmatzi et al, ; Strafella et al, 2019). These genes were shortlisted from the 466 genes increased in the aged nLRC (Dataset EV1) according to ECM structural protein and matricellular protein category and RPKM values of ≥1 in 2‐year‐old nLRC. 2 y; 2‐year‐old. 2 m; 2‐month‐old.
- A
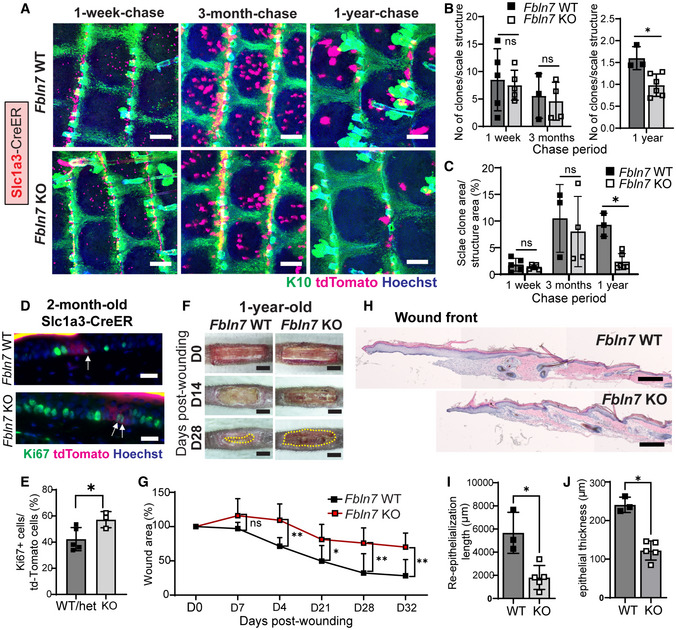
Slc1a3CreER lineage tracing in the Fbln7 WT and KO mice. Low‐dose tamoxifen was administered once at 2 months of age and samples were collected after 1‐week, 3‐month, and 1‐year chases. Wholemount staining of tail epidermis with tdTomato, K10, and Hoechst. Scale bar: 200 μm. WT, wild‐type; KO, knock‐out.
- B
The number of Slc1a3CreER+ clones per scale structure in 1‐week and 3‐month chases (left panel) and 1‐year chase (right panel).
- C
Quantitation of the area of Slc1a3CreER+ clones per total area of scale structure. Fbln7 WT mice for 1‐week (N = 5), 3‐month (N = 3), and 1‐year chases (N = 3). Fbln7 KO mice for 1‐week (N = 5), 3‐month (N = 4), and 1‐year chases (N = 6).
- D, E
Ki67 immunostaining in 1‐week‐chase mice (D) and its quantitation (E). White arrows show Ki67 and tdTomato double positive cells, which were counted and summarized in (E). Scale bar: 20 μm. N = 5 WT/het and 3 KO mice. Welch's t‐test.
- F
Representative pictures from tail wounds of 1‐year‐old Fbln7 WT and KO mice. Scale Bar: 4 mm.
- G
Measurements of wound area over time in Fbln7 WT (N = 5) and KO (N = 7) mice. Two‐way ANOVA, Tukey's multiple comparisons test.
- H–J
Hematoxylin and eosin staining from tail sections of wounded Fbln7 WT versus KO mice (H) and quantitation of the re‐epithelialization length (I) and thickness at the healing front (J). Scale bar: 200 μm. N = 3 WT and 5 KO mice.
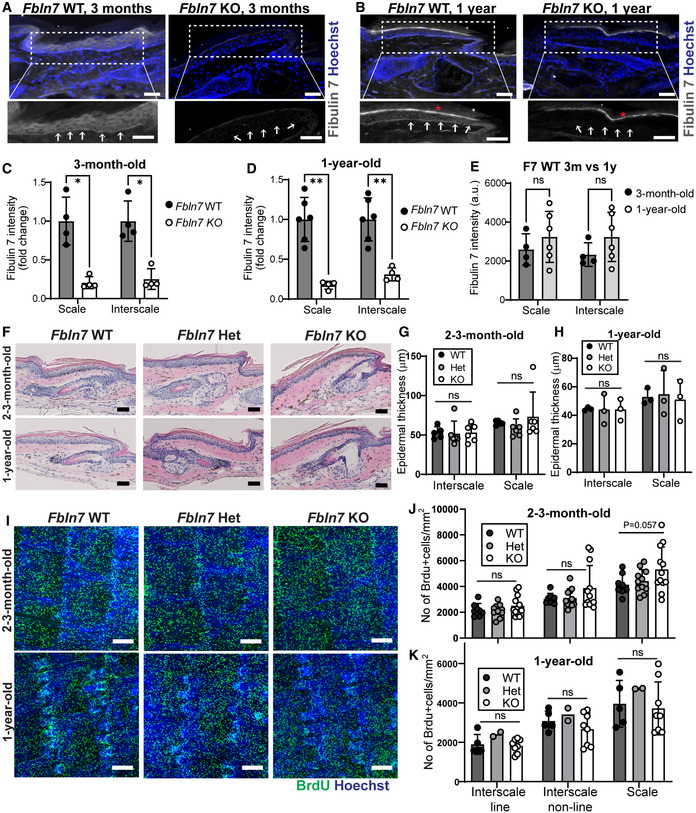
- A, B
Fibulin 7 immunostaining in 3‐month‐ (A) and 1‐year‐old tail section (B) in Fbln7 WT versus KO mice. Dotted box areas were enlarged in the lower panels. White arrows indicate fibulin 7 basement membrane staining. Signal in the uppermost stratum corneum is background (asterisk). Scale bar: 50 μm.
- C–E
Fibulin 7 intensity quantification per basal epidermal stem cell/basement membrane, normalized to WT (C, D) or in plain intensity measurement (E). a.u., arbitrary unit. Data show mean ± SD. **P < 0.01; *P < 0.05; ns, not significant (Mann–Whitney test). N = 4 mice per group in 3‐month‐old, N = 6 WT and 4 KO in 1‐year‐old mice (C, D). N = 4 (3‐month‐old) and 6 WT mice (1‐year‐old) (E).
- F
Hematoxylin and eosin staining from tail sections of 2‐month‐ and 2‐year‐old mice. Scale bar: 50 μm. Het, heterozygous.
- G, H
Epidermal thickness measurements from the scale and interscale areas of 2‐ to 3‐month‐old (G) and 1‐year‐old (H) mice. No significant changes were observed among the Fbln7 WT, het, and KO mice (N = 5 WT, N = 6 het, N = 6 KO in 2‐ to 3‐month‐old mice; and N = 3 in 1‐year‐old WT/het/KO). Data show mean ± SD. Mann–Whitney test.
- I
Wholemount immunostaining from tail epidermis labeled with BrdU and Hoechst nuclear staining. Scale bar: 200 μm.
- J, K
Quantitation of BrdU+ cells per mm2 structure area in 2‐ to 3‐month‐old mice (J) and 1‐year‐old mice (K). For 2‐ to 3‐month‐old mice, N = 8 (WT), N = 11 (het), N = 12 (KO). For 1‐year‐old mice, N = 5 (WT), N = 2 (het), and N = 8 (KO). P = 0.057 in 2‐ to 3‐month‐old Fbln7 WT versus KO mice from Welch's t‐test.
- A
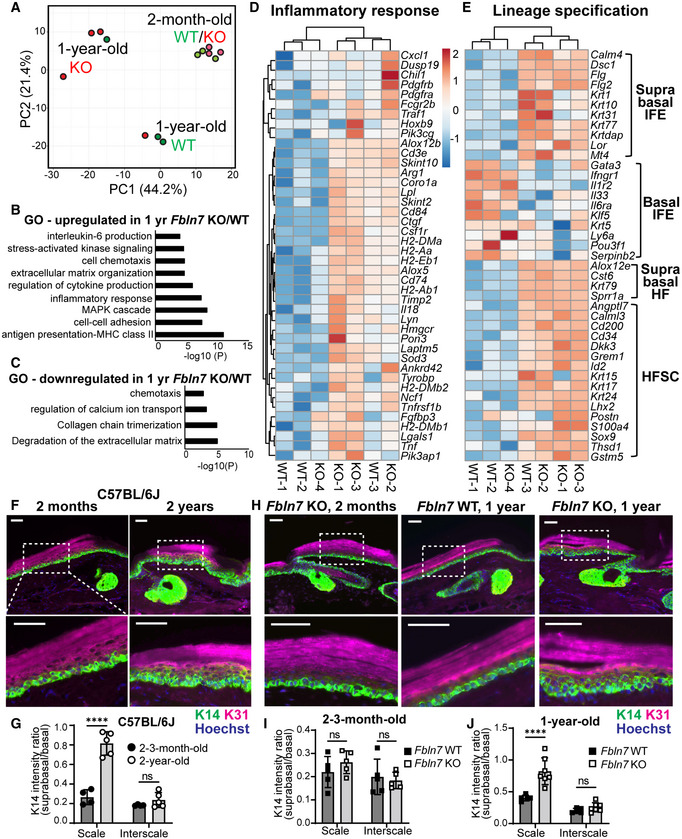
Principal component analysis map constructed from threefold differentially expressed genes in epidermal stem cells from Fbln7 WT versus KO dorsal skin in 2‐month‐ and 1‐year‐old mice. Each dot represents one mouse (N = 3 per group, except 1‐year‐old Fbln7 KO N = 4).
- B, C
Gene ontology (GO) analysis from ≥twofold upregulated (B) or downregulated (C) genes in 1‐year‐old Fbln7 KO mice compared with WT.
- D, E
Heatmap illustrating changes in inflammatory response genes (D) and basal or suprabasal signature genes of epidermal stem cells (IFEs) and HFSCs (Ge et al, 2020) (E) in 1‐year‐old Fbln7 WT versus KO mice, constructed from ≥twofold differentially expressed genes obtained from GO analysis in (B). Scale: Z‐score.
- F, G
K31 and K14 immunostaining in tail sections of 2‐month‐ versus 2‐year‐old C57BL/6J WT mice (F) and the quantification (G). Dotted box areas are enlarged in the lower panels. Scale bar: 50 μm. Quantification of K14 intensity in the suprabasal area was normalized to basal area per cell. N = 4 (2–3‐month‐old) and N = 5 (2‐year‐old) C57BL/6J mice (G).
- H–J
K31 and K14 immunostaining in tail sections of 1‐year‐old Fbln7 WT versus KO compared with 2‐month‐old Fbln7 KO mice (H) and the quantitation (I, J). Scale bar: 50 μm. N = 5 for both WT and KO of 2–3‐month‐old mice (I). N = 5 and N = 7 for 1‐year‐old WT versus KO, respectively (J).
- A
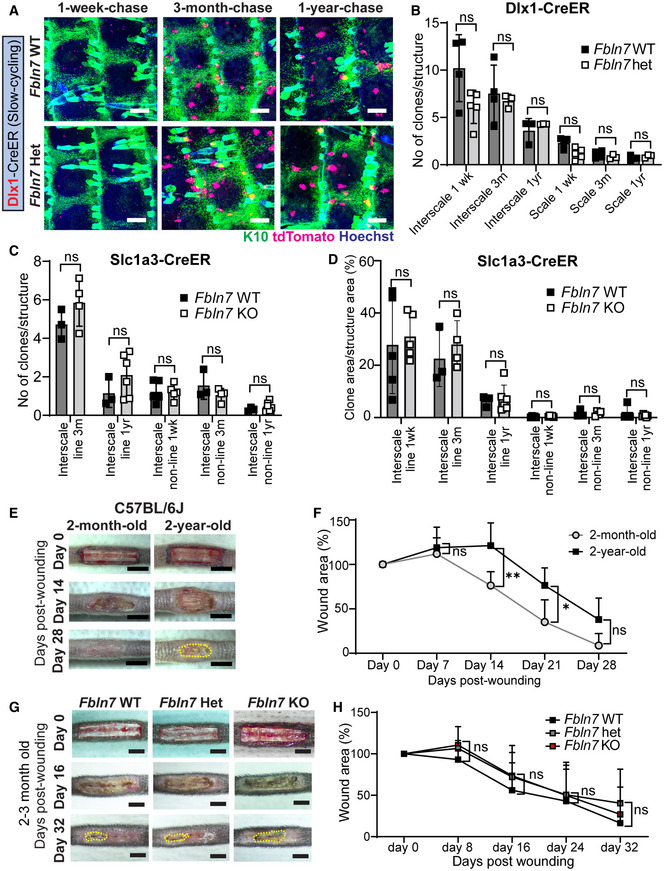
Dlx1CreER lineage tracing in the Fbln7 WT and Het backgrounds. Low‐dose tamoxifen was administered once at 2 months of age and samples were collected after 1‐week, 3‐month, and 1‐year chases. Wholemount staining of tail epidermis with tdTomato, K10, and Hoechst. Scale bar: 200 μm.
- B
The number of Dlx1CreER clones in the scale or interscale (both line and non‐line) of Fbln7 WT mice for 1‐week (N = 4), 3‐month (N = 4), 1‐year chase (N = 3) and Fbln7 het mice for 1‐week (N = 5), 3‐month (N = 3), and 1‐year (N = 3) chase. ns, not significant. Mann–Whitney test.
- C
The number of Slc1a3CreER clones in the interscale non‐line or interscale line regions for 1‐week, 3‐month or 1‐year chase. Fbln7 WT mice for 1‐week (N = 5), 3‐month (N = 3), and 1‐year chase (N = 3). Fbln7 KO mice for 1‐week (N = 5), 3‐month (N = 4), and 1‐year (N = 6) chase.
- D
Quantitation of the area of Slc1a3CreER clones per structural area from the same experiment as in (C).
- E, F
Representative pictures from tail wounds of 2‐month versus 2‐year‐old C57BL/6J wild‐type mice (E) and measurements of wound area over time (F). N = 6 (2‐month‐old) and N = 5 (2‐year‐old). Scale bar: 4 mm. **P < 0.01; *P < 0.05.
- G, H
Representative pictures from tail wound healing experiment in 2‐ to 3‐month‐old Fbln7 mice (G) and the wound area quantitation over time (H). N = 4 (WT), N = 8 (Het), and N = 7 (KO). Scale bar: 4 mm.
- A
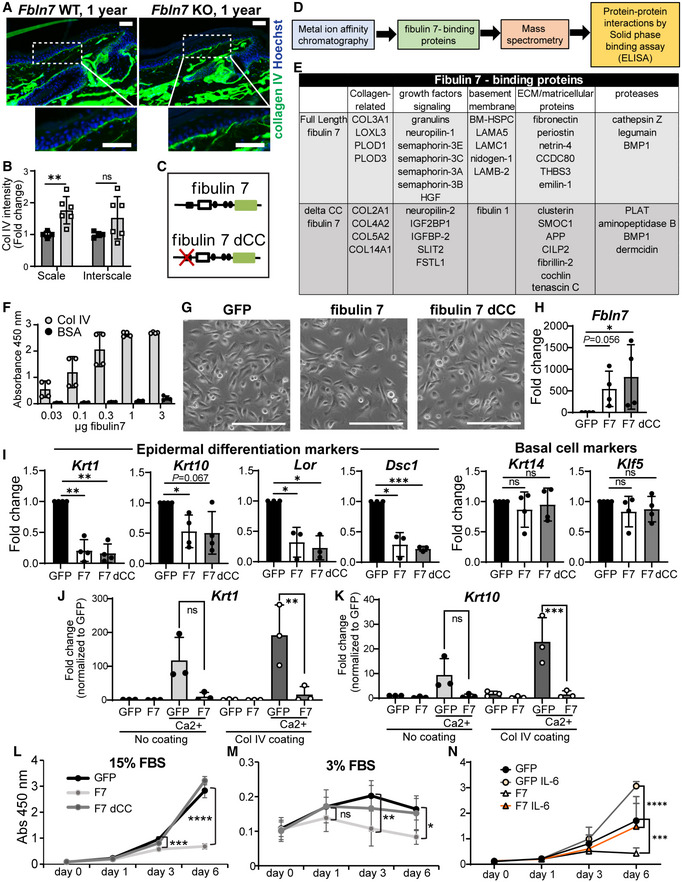
Collagen IV immunostaining in tail sections of 1‐year‐old Fbln7 WT versus KO. Dotted box regions are enlarged. Scale bar: 50 μm.
- B
Quantification of Collagen IV basement membrane intensity per cell in Fbln7 KO mice normalized to WT mice. N = 4 WT and N = 6 KO mice. Graphs show mean SD. Mann–Whitney test. **P < 0.01, ns, not significant.
- C–E
Diagram of proteins binding to full‐length fibulin 7 or fibulin 7 with coiled‐coil deletion mutant (delta CC) (C) and workflow chart of screening experiments to investigate secreted fibulin 7‐interacting proteins (D). List of the fibulin‐7 binding proteins obtained from mass‐spectrometry (E).
- F
Solid‐phase binding assay using recombinant fibulin 7 as liquid phase and purified collagen IV protein as solid phase. X‐axis shows increasing doses of fibulin 7 (μg/well). Bovine serum albumin (BSA) was used at the same amounts as control liquid phase. Graph shows mean SD from four technical repeats in two independent experiments.
- G
Brightfield images of mouse primary keratinocytes overexpressing GFP, full‐length fibulin 7 (F7), or coiled‐coil deletion mutant (F7 dCC) as shown in (C). Scale bar: 200 μm.
- H–K
Quantitative RT–PCR shows fold changes in gene expression of F7 or F7 dCC compared with GFP control. Keratinocytes were induced with CaCl2 for 1 day with or without Collagen IV coating prior to quantitative RT–PCR (J, K). N = at least three biological repeats. Statistical test: One‐way ANOVA with Dunn's multiple comparison test (H); Welch's t‐test. ***P < 0.001. **P < 0.01. *P < 0.05; ns, not significant (I). One‐way ANOVA (Tukey's multiple comparisons test) was used for (J, K).
- L, M
Cell proliferation assays comparing growth rates of GFP overexpression control with F7 and F7 dCC over 6 days in 15% FBS growth medium (L) or 3% reduced growth medium (M). FBS, fetal bovine serum. Abs, absorbance.
- N
Cell proliferation assay comparing GFP or F7 overexpressing keratinocytes treated with 5 ng/ml IL‐6 over 6 days. Statistical test two‐way ANOVA (Tukey's multiple comparisons test). ****P < 0.0001; **P < 0.01. *P < 0.05; ns, not significant (L–N).
- A
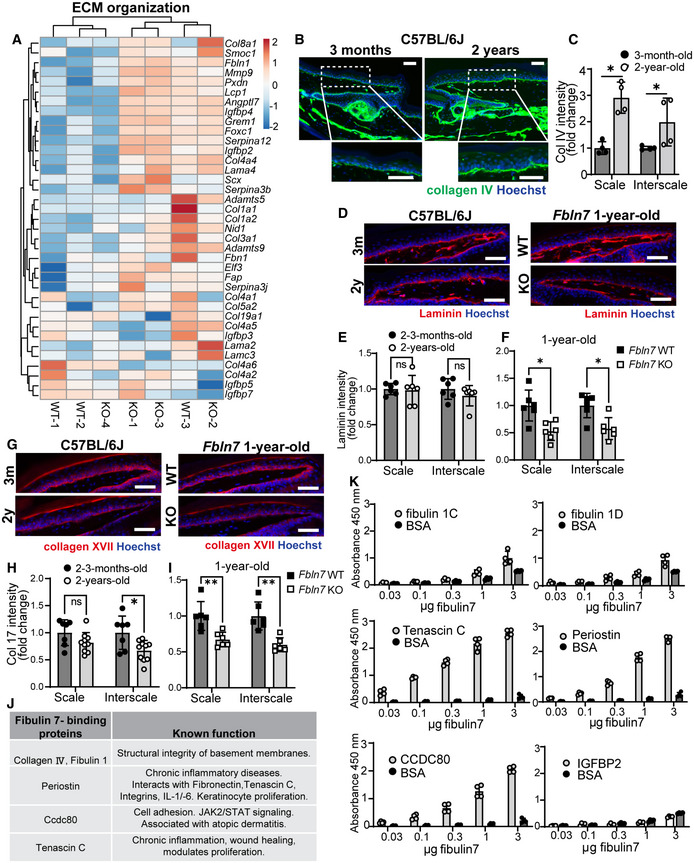
Heatmap of ≥twofold upregulated or downregulated genes related to ECM from gene ontology analysis in Fig 4B and C. Scale reflects Z‐score.
- B
Collagen IV immunostaining in tail sections of 3‐month‐old versus 2‐year‐old C57BL/6J mice. Dotted box regions are enlarged.
- C
Quantification of Collagen IV basement membrane intensity per cell in 2‐year‐old mice normalized to 3‐month‐old mice in C57BL/6J mice (B). *P < 0.05. N = 4 mice per age group (biological replicates).
- D
Laminin immunostaining in tail sections of 3‐month‐old versus 2‐year‐old C57BL/6J mice (left panels) and 1‐year‐old Fbln7 WT versus KO (right panels).
- E, F
Quantification of laminin basement membrane intensity per cell in 2‐year‐old mice normalized to 3‐month‐old mice in C57BL/6J mice (E) or in Fbln7 KO mice normalized to WT mice (F). N = 6 per group for all mice. ns; not significant.
- G
Collagen XVII immunostaining in tail sections of 3‐month‐old versus 2‐year‐old C57BL/6J mice (left panels) and 1‐year‐old Fbln7 WT versus KO (right panels).
- H, I
Quantification of Collagen XVII intensity per cell in 2‐year‐old mice normalized to 3‐month‐old mice in C57BL/6J mice (H) or in Fbln7 KO mice normalized to WT mice (I). N = 7 (2–3 month‐old) and N = 10 (2‐year‐old) C57BL/6J mice; N = 6 per group in Fbln7 mice. **P < 0.01.
- J
Shortlisted fibulin 7‐binding protein candidates (from Fig 5D and E) and their reported functions.
- K
Solid‐phase binding assays using recombinant fibulin 7 as liquid phase and purified or recombinant ECM proteins as solid phase. X‐axis shows increasing doses of fibulin 7 (μg/well). Bovine serum albumin (BSA) was used as the control liquid phase and added in the same amounts as fibulin 7. Data are from four technical repeats in two independent experiments.
Similar articles
-
Matricellular Proteins in the Homeostasis, Regeneration, and Aging of Skin.Int J Mol Sci. 2023 Sep 19;24(18):14274. doi: 10.3390/ijms241814274. Int J Mol Sci. 2023. PMID: 37762584 Free PMC article. Review.
-
The aging skin microenvironment dictates stem cell behavior.Proc Natl Acad Sci U S A. 2020 Mar 10;117(10):5339-5350. doi: 10.1073/pnas.1901720117. Epub 2020 Feb 24. Proc Natl Acad Sci U S A. 2020. PMID: 32094197 Free PMC article.
-
Reduced fibulin-2 contributes to loss of basement membrane integrity and skin blistering in mice lacking integrin α3β1 in the epidermis.J Invest Dermatol. 2014 Jun;134(6):1609-1617. doi: 10.1038/jid.2014.10. Epub 2014 Jan 3. J Invest Dermatol. 2014. PMID: 24390135 Free PMC article.
-
Latent transforming growth factor beta-binding protein-3 and fibulin-1C interact with the extracellular domain of the heparin-binding EGF-like growth factor precursor.BMC Cell Biol. 2002;3:2. doi: 10.1186/1471-2121-3-2. Epub 2002 Jan 22. BMC Cell Biol. 2002. PMID: 11846885 Free PMC article.
-
Extracellular Matrix as a Regulator of Epidermal Stem Cell Fate.Int J Mol Sci. 2018 Mar 27;19(4):1003. doi: 10.3390/ijms19041003. Int J Mol Sci. 2018. PMID: 29584689 Free PMC article. Review.
Cited by
-
CD4 expression controls epidermal stem cell balance.Sci Rep. 2025 Feb 4;15(1):4185. doi: 10.1038/s41598-025-87915-7. Sci Rep. 2025. PMID: 39905055 Free PMC article.
-
ECM and epithelial stem cells: the scaffold of destiny.Front Cell Dev Biol. 2024 Mar 20;12:1359585. doi: 10.3389/fcell.2024.1359585. eCollection 2024. Front Cell Dev Biol. 2024. PMID: 38572486 Free PMC article. Review.
-
Matricellular Proteins in the Homeostasis, Regeneration, and Aging of Skin.Int J Mol Sci. 2023 Sep 19;24(18):14274. doi: 10.3390/ijms241814274. Int J Mol Sci. 2023. PMID: 37762584 Free PMC article. Review.
-
The Effects of Lipid Extracts from Microalgae Chlorococcum amblystomatis and Nannochloropsis oceanica on the Proteome of 3D-Cultured Fibroblasts Exposed to UVA Radiation.Antioxidants (Basel). 2025 Apr 30;14(5):545. doi: 10.3390/antiox14050545. Antioxidants (Basel). 2025. PMID: 40427427 Free PMC article.
-
Fibulin-7 and its bioactive fragments: emerging immunomodulatory roles in disease.Inflamm Res. 2025 Jul 7;74(1):101. doi: 10.1007/s00011-025-02067-8. Inflamm Res. 2025. PMID: 40622395 Review.
References
-
- Barrientos S, Stojadinovic O, Golinko MS, Brem H, Tomic‐Canic M (2008) Growth factors and cytokines in wound healing. Wound Repair Regen 16: 585–601 - PubMed
Publication types
MeSH terms
Substances
LinkOut - more resources
Full Text Sources
Medical
Molecular Biology Databases
