. 2022 Sep 27;11(4):61.
doi: 10.3390/antib11040061.

Yeast Surface Display Platform for Rapid Selection of an Antibody Library via Sequential Counter Antigen Flow Cytometry

Affiliations

Yeast Surface Display Platform for Rapid Selection of an Antibody Library via Sequential Counter Antigen Flow Cytometry

Bhupal Ban et al. Antibodies (Basel). .

Abstract

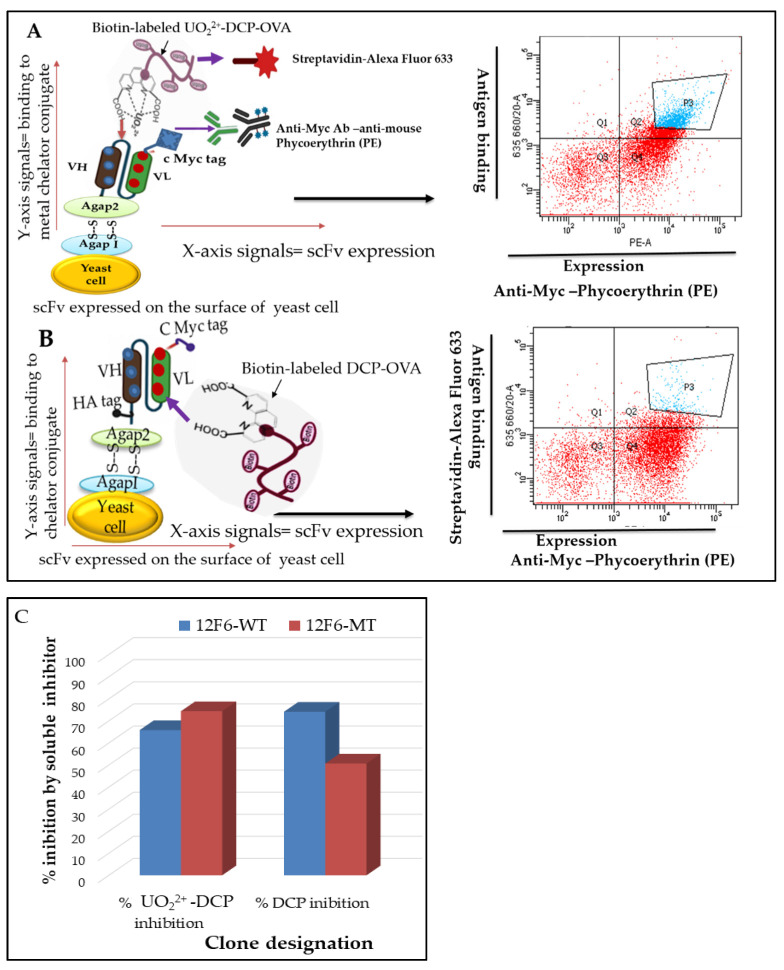
Yeast surface display techniques have been increasingly employed as a tool for both the discovery and affinity maturation of antibodies. In this study, we describe the use of yeast surface display for the selection and affinity maturation of antibodies targeted to small molecules (haptens). In this approach, we coupled 4 to 15 sequential cycles of error-prone PCR to introduce heterogeneity into the sequence of an 12F6 scFv antibody that binds to chelated uranium; the resulting full-length constructs were combined to create a yeast-displayed scFv-library with high diversity. We also developed a stringent selection technique utilizing fluorescence-activated cell sorting; this was based on sequentially dropping the target antigen concentration, while concomitantly increasing the concentration of potential cross-reactive haptens in subsequent selection cycles. As a proof of the efficacy this approach, we confirmed that the antibodies identified via this approach retained binding to the target antigen (UO22+ complexed to a chelator), while binding with lesser affinity than the parental scFv to a structurally related haptens (the same chelator complexed to other metal ions). As will be described in this report, these scFv variants perform more efficiently in sensor-based assay than the parental 12F6 antibody. Combining the generation of scFv libraries via error-prone PCR with selection of yeast-displayed antibodies by fluorescence activated cell sorting will provide an efficient new method for the isolation of scFvs and other binding proteins with high affinity and specificity.

Keywords: affinity maturation; antibody-based biosensors; equilibrium binding constants; error prone PCR; flow cytometry; hexavalent uranium (UO22+); single chain variable fragments (scFv); yeast surface display.


Conflict of interest statement

The authors declare that there is no conflict of interest regarding the publications of this paper.

Figures

Figure 1
Figure 1
Schematic diagram for mutants’ generation, screening, and selection of selective with desirable affinity antibody using yeast surface display. Step-1 represents the general protocol to generate a quality mutagenesis library using error-prone PCR, and the subsequent packaging of the library into yeast cells. Step-2 represents the screening of specific target antibodies after induction of the surface-displayed scFv library and incubation with the biotinylated protein antigens. Step-3 represents for selection of a single clone yeast surface display antibody with low cross-reactivity to chelator. The fusion protein is tethered to the yeast cell wall via disulfide bridges between the Aga2p protein and the Aga1p protein (which is covalently attached to the cell wall). The fusion protein also contains c-myc affinity tag (EQKLISEEDL) at the C-terminus can be used to monitor the full-length expression of the gene on the yeast surface by flow cytometry. Yeast displays functional antibodies that bind ligand can be identified and isolated by differential fluorescent staining of the antibodies and ligand.
Figure 2
Figure 2
The flow cytometry-based method for assessing induced yeast surface display scFv activities and assessed competitive inhibition by free chelator. In 12F6Ab binding to uranium-chelator assay, positive results occur when binding of biotinylated antigen to induced yeast cells. In the epitope binding assay, a positive result is detected when distinct epitopes are bound by distinct yeast-bound induced scFv, resulting in an scFv antibody detectable by appropriate monoclonal antibodies (mAbs) with phycoerythrin (mAb-PE) and Alexa-635 streptavidin. Light scatter and fluorescence properties of yeast populations aimed for FACS analysis of induced scFv yeast cells; (A) Cells were incubated with biotin-labeled DCP-OVA with uranium loaded. (B) Cells were incubated with biotin-labeled DCP-OVA without uranium loaded. (C) Cells incubated with biotin-labeled 100 nM OVA-DCP-UO22+ plus DCP-UO22+ (20 nM) and DCP-OVA (5 µM) in buffer, repressively.
Figure 3
Figure 3
Flow cytometry profiles for parental scFv yeast clones, epPCR, mutagenized libraries, and post-sort libraries. Each row from left to right represents the following samples: parental strain, one, two, or three times sorted libraries, all stained with the relevant soluble antigen. Panel A shows the induced yeast cells population after cloning the 12F6 e-PCR library was incubated at 100 nM biotin-labeled OVA-DCP-UO22+. The upper right quadrant (Q2) represents the yeast population that was displaying scFvs on the surface and binding to antigen conations, 0.3% of high binder cells as indicated in (A) sort gate were sorted compared to background cells binding as indicated in (B). (C) represents yeast induced cells were incubated 50 nM biotin-labeled OVA-DCP-UO22+, 2% of high binder cells sort gate were sorted as first-round screening. (E) represents induced yeast cells were incubated 20 nM biotin-labeled OVA-DCP-UO22+, 1% of high binder cells sort gate were sorted. The top binding 1% of yeast cells were sorted from Figure 4C and collected for further induction of surface expression yeast cells binding antigen. (GK) represent the yeast cells were that binding with 20 nM UO22+-DCP-OVA plus the different concentrations of soluble unlabeled DCP-OVA as competitors, respectively. The top binding 0.5% and 0.1% specific yeast cells were sorted for further analysis. Figures represent (B,D,F) show biotin-labeled- DCP-OVA binding clones representing the off-target as background for all sorts of experiments. Panel L indicates the correlation of off-target versus on-target binding yeast populations. The y-axis reflects antigen binding, whereas the x-axis displays scFv expression through staining of the c-myc tag.
Figure 3
Figure 3
Flow cytometry profiles for parental scFv yeast clones, epPCR, mutagenized libraries, and post-sort libraries. Each row from left to right represents the following samples: parental strain, one, two, or three times sorted libraries, all stained with the relevant soluble antigen. Panel A shows the induced yeast cells population after cloning the 12F6 e-PCR library was incubated at 100 nM biotin-labeled OVA-DCP-UO22+. The upper right quadrant (Q2) represents the yeast population that was displaying scFvs on the surface and binding to antigen conations, 0.3% of high binder cells as indicated in (A) sort gate were sorted compared to background cells binding as indicated in (B). (C) represents yeast induced cells were incubated 50 nM biotin-labeled OVA-DCP-UO22+, 2% of high binder cells sort gate were sorted as first-round screening. (E) represents induced yeast cells were incubated 20 nM biotin-labeled OVA-DCP-UO22+, 1% of high binder cells sort gate were sorted. The top binding 1% of yeast cells were sorted from Figure 4C and collected for further induction of surface expression yeast cells binding antigen. (GK) represent the yeast cells were that binding with 20 nM UO22+-DCP-OVA plus the different concentrations of soluble unlabeled DCP-OVA as competitors, respectively. The top binding 0.5% and 0.1% specific yeast cells were sorted for further analysis. Figures represent (B,D,F) show biotin-labeled- DCP-OVA binding clones representing the off-target as background for all sorts of experiments. Panel L indicates the correlation of off-target versus on-target binding yeast populations. The y-axis reflects antigen binding, whereas the x-axis displays scFv expression through staining of the c-myc tag.
Figure 4
Figure 4
Specificity of selected monoclonal using yeast display. After 3 rounds enrichment using flow cytometry allow the subsequent isolation and testing of single clones. 139 different monoclonals were tested for specific binding to biotin-labeled 50 nM UO22+-DCP-OVA plus unlabeled 5 µM DCP-OVA and OVA-DCP-UO22+ (20 nM). (A): inhibition of binding by DCP and DCP-UO22+ selected 12F6 clones. Selective single clone binding to biotin-labeled UO22+-DCP-OVA with competitor inhibitors unlabeled DCP and UO22+-DCP, respectively. (B): Monoclonal FACS of three representative clones is shown in five columns. (Top panel a) Cells were incubated with biotin-labeled 50 nM UO22+-DCP-OVA complex; (Middle panel b) Cells were incubated with biotin-labeled 50 nM UO22+-DCP-OVA plus DCP-OVA (5 μM) as without metal load in buffer; (Bottom panel c) Cells incubated with biotin-labeled 50 nM OVA-DCP-UO22+ plus DCP-UO22+ (20 nM) in the buffer.
Figure 4
Figure 4
Specificity of selected monoclonal using yeast display. After 3 rounds enrichment using flow cytometry allow the subsequent isolation and testing of single clones. 139 different monoclonals were tested for specific binding to biotin-labeled 50 nM UO22+-DCP-OVA plus unlabeled 5 µM DCP-OVA and OVA-DCP-UO22+ (20 nM). (A): inhibition of binding by DCP and DCP-UO22+ selected 12F6 clones. Selective single clone binding to biotin-labeled UO22+-DCP-OVA with competitor inhibitors unlabeled DCP and UO22+-DCP, respectively. (B): Monoclonal FACS of three representative clones is shown in five columns. (Top panel a) Cells were incubated with biotin-labeled 50 nM UO22+-DCP-OVA complex; (Middle panel b) Cells were incubated with biotin-labeled 50 nM UO22+-DCP-OVA plus DCP-OVA (5 μM) as without metal load in buffer; (Bottom panel c) Cells incubated with biotin-labeled 50 nM OVA-DCP-UO22+ plus DCP-UO22+ (20 nM) in the buffer.
Figure 5
Figure 5
Protein ribbon structure for 12F6 scFv was constructed using PyMOL modeling software. Amino acid residues which were substituted in all variants of 12F6 during the epPCR-based mutagenesis are shown in blue color with a red arrow for the light chain and red color with a blue arrow for the heavy chain. The pink color represents the light chain, and the cyan color represents the heavy chain of antibody ribbon structure.

Similar articles

Cited by

References

    1. Bradbury A.R.M., Sidhu S., Dübel S., McCafferty J. Beyond Natural Antibodies: The Power of in Vitro Display Technologies. Nat. Biotechnol. 2011;29:245–254. doi: 10.1038/nbt.1791. - DOI - PMC - PubMed
    1. Romero P.A., Arnold F.H. Exploring Protein Fitness Landscapes by Directed Evolution. Nat. Rev. Mol. Cell Biol. 2009;10:866–876. doi: 10.1038/nrm2805. - DOI - PMC - PubMed
    1. Kearns-Jonker M., Barteneva N., Mencel R., Hussain N., Shulkin I., Xu A., Yew M., Cramer D.V. Use of Molecular Modeling and Site-Directed Mutagenesis to Define the Structural Basis for the Immune Response to Carbohydrate Xenoantigens. BMC Immunol. 2007;8:3. doi: 10.1186/1471-2172-8-3. - DOI - PMC - PubMed
    1. McCullum E.O., Williams B.A.R., Zhang J., Chaput J.C. Random Mutagenesis by Error-Prone PCR. Methods Mol. Biol. Clifton NJ. 2010;634:103–109. - PubMed
    1. Forloni M., Liu A.Y., Wajapeyee N. Random Mutagenesis Using Error-Prone DNA Polymerases. Cold Spring Harb. Protoc. 2018;2018:220–230. doi: 10.1101/pdb.prot097741. - DOI - PubMed