. 2022 Oct 15;149(20):dev200614.
doi: 10.1242/dev.200614. Epub 2022 Oct 24.

Mapping the adult human esophagus in vivo and in vitro

Affiliations

Mapping the adult human esophagus in vivo and in vitro

Daysha Ferrer-Torres et al. Development. .

Abstract

Many esophageal diseases can arise during development or throughout life. Therefore, well-characterized in vitro models and detailed methods are essential for studying human esophageal development, homeostasis and disease. Here, we (1) create an atlas of the cell types observed in the normal adult human esophagus; (2) establish an ancestrally diverse biobank of in vitro esophagus tissue to interrogate homeostasis and injury; and (3) benchmark in vitro models using the adult human esophagus atlas. We created a single-cell RNA sequencing reference atlas using fresh adult esophagus biopsies and a continuously expanding biobank of patient-derived in vitro cultures (n=55 lines). We identify and validate several transcriptionally distinct cell classes in the native human adult esophagus, with four populations belonging to the epithelial layer, including basal, epibasal, early differentiating and terminally differentiated luminal cells. Benchmarking in vitro esophagus cultures to the in vivo reference using single-cell RNA sequencing shows that the basal stem cells are robustly maintained in vitro, and the diversity of epithelial cell types in culture is dependent on cell density. We also demonstrate that cultures can be grown in 2D or as 3D organoids, and these methods can be employed for modeling the complete epithelial layers, thereby enabling in vitro modeling of the human adult esophagus.

Keywords: In vitro; Adult; Biobank; Esophagus; Fetal; Organoid.


Conflict of interest statement

Competing interests The authors declare no competing or financial interests.

Figures

Fig. 1.
Fig. 1.
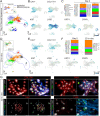
Identification of distinct molecular domains within the esophageal epithelium. (A) CDH1+ epithelial cells are sub-clustered from scRNA-seq data from normal matched tissue esophageal biopsies (n=2 biopsies/patients; Pt#1: 45-year-old male; Pt#2: 63-year-old female) from which a total of 7796 cells were analyzed after filtering, and 2651 genes per cell. Louvain clustering was used to predict clusters, which were visualized using UMAP. (B) Distribution of patient cells in each cluster. denotes the average contribution of both samples to the clusters. (C) Dot-plots of the top five genes expressed in each cluster and annotations for each cluster based on top genes and known genes (see also Table S2). (D) Feature plots of top marker genes expressed in each cluster, with CAV1 and COL17A1 for Cluster 2 (basal), KI67 for Cluster 1 (proliferative), LY6D and KRT4 for Cluster 0 (epibasal/suprabasal) and CRNN for Cluster 3 (luminal). (E) Representative immunofluorescence (IF) images in the adult human esophagus validating expression of genes identified by scRNA-seq. COL17A1, CAV1 and CAV2 (see Fig. S2) have the highest expression at the basal zone, KI67 marks proliferative cells at the basal-epibasal zone, LY6D expression is observed at low levels in the basal layer and high levels starting at the suprabasal layer (here referred to as epibasal), KRT4 is a mid differentiation marker and CRNN stains the luminal/cell layer of terminally differentiated cell types. Dotted line delineates the boundary between the lamina propria and the epithelial basal zone. (F) Summary schematic of the different epithelial zones of the adult esophagus with their corresponding markers identified by scRNA-seq and validated by immunofluorescence (validation of other markers is shown in Fig. S2, including higher-magnification images of LY6D). Created with BioRender.com. Images are representative of n=3 biological replicates. Immunofluorescence data was validated across multiple patient samples (summarized in Table S4). Scale bars: 100 μm.
Fig. 2.
Fig. 2.
Characterization of human esophageal biopsies grown in 2D in vitro at the single-cell level. (A) H&E of a representative biopsy of squamous epithelial cells of the esophagus. (B) Brightfield (BF) images of expansion of esophagus cell clusters/colonies for D3, D9 and D12. Scale bar: 200 µm. (C) Cell proliferation assay (see Materials and Methods) at 24, 48, 72 and 96 h showing proliferation of esophageal cells over time compared with sub-lethally irradiated 3T3-J2 mouse fibroblast cells (unpaired, two-tailed t-test; P=0.027). (D) Doubling life of esophageal 2D in vitro cells [n=4 patients (pt)]. We quantified cell numbers using two cell-counting approaches (by cell counter and by DAPI counts) and calculated the doubling time as previously described (Sherley et al., 1995). The average daily doubling time was 3.19 and 2.87, respectively (unpaired, two-tailed t-test; P=0.9722). (E) A total of 10,550 cells grown in vitro and 4269 genes/cell were analyzed using Louvain clustering and visualized by UMAP to predict five clusters. Clusters 1 and 2 express basal cell markers (see I), Clusters 0 and 3 express markers of early suprabasal cells, and Cluster 4 expresses proliferation markers (see Table S3). (F) Distribution plot of the average () number of cells contributing to each cluster per sample (n=3 biological replicates). (G,H) CDH1 expression across clusters (G), with validation of CDH1 (protein) expression by immunofluorescence (IF) (H), suggesting an enrichment of epithelial cell types using these methods. Scale bar: 100 μm. (I) Top: Quantification of the percentage of total cells that are CDH1+ in vitro in multiple patient-derived cell lines [each number on the x-axis represents a unique patient sample (n=7 pt)]. Bottom: Epithelial cells do not significantly increase or decrease over passage number (n=3; unpaired, two-tailed t-test; P=0.1597). Error bars represent s.d. (J) Feature plots of genes identified in primary tissue differential epithelial zones for basal (CAV1, COL17A1), proliferative (KI67), epibasal (LY6D), suprabasal (KRT4) and luminal cells (CRNN). ns, not significant.
Fig. 3.
Fig. 3.
In vitro and in vivo esophagus share a high degree of molecular similarity. (A) Louvain clustering and UMAP visualization of in vivo samples. Blue dotted line highlights the epithelial (CDH1+) cluster and the yellow dotted line highlights VIM+ cells. (B) Feature plots of genes expressed in different cells within the esophagus, including CAV1, COL17A1, KI67, LY6D, KRT4 and CRNN. (C) Distribution of cells from each human sample to each cluster. (D) The Scanpy function Ingest was used to project 2D in vitro-grown cells onto the in vivo cell embedding. In vitro cells map to five clusters, with most cells mapping to in vivo basal (Cluster 2) and suprabasal (Cluster 0) clusters. (E) Feature plots showing expression of basal cell (CAV1, COL17A1), proliferation-associated (KI67), suprabasal marker (LY6D) and differentiated marker (KRT4, CRNN) genes. (F) Quantification of the proportion of cells from the in vivo sample in each cluster and the proportion of in vitro-cultured cells that map to each in vivo cluster, demonstrating that in vitro cultured cells maintain similar basal cell proportions (Cluster 2, green) but have a larger proportion of suprabasal-like cells (Cluster 0, orange). LP, lamina propria. (F) Immunofluorescence validation of COL17A1, CAV2 and KI67 expression co-expressed with TP63 and CDH1. The epibasal/suprabasal marker LY6D could not be detected. Scale bars: 2 mm (COL17A1, CAV2 and LY6D); 50 µm (KI67).
Fig. 4.
Fig. 4.
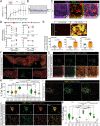
Esophageal stratification in vitro using air-liquid interface and cell density. (A) Schematic at the top depicts a Transwell with media in both chambers followed by removal of media from the upper chamber to create the ALI for differentiation (created with BioRender.com). Graph shows average TEER measurements for n=4 patient 2D in vitro-derived cultures that were seeded onto Transwells, and TEER was measured over time (Ω•cm2). (B,C) Histological (B) and immunofluorescence (IF) (C) characterization of D14 ALI cultures. (D) qPCR for proliferation (KI67), early and terminally differentiated (KRT4 and CRNN, respectively) and basal-suprabasal (TP63) mRNA markers in low versus high-seeded wells from four independent lines. (E) Immunofluorescence staining and quantification of protein expression of the early differentiation marker KRT4 in low versus high cell density assays. (F) Representative image of immunofluorescence for TP63 and KRT4 in primary tissue biopsy of the adult human esophagus. Boxed area is enlarged in the panels below. (G) Representative images of immunofluorescence for TP63 and KRT4 patient-derived in vitro esophagus primary 2D cell cultures, at low (2D) versus high (confocal z-stack maximum projections) density. (H) Quantification of cell types based on protein expression of n=3 independent patient primary tissue (from F and G) versus n=3 in vitro cells at low versus high density. The percentage of each cell type was determined by counting cells positive or negative for the respective markers (x-axis). (I) Representative images of immunofluorescence for KI67 and TP53 in primary tissue biopsy of the adult human esophagus. (J) Representative images of immunofluorescence at low and high density. At low density (top), nuclei identified by human-specific nuclear antigen (Hu-Nu; red) and co-stained with TP63 (green) are highly proliferative (marked by KI67) compared with the same cell line plated at higher density (bottom). (K) Quantification of KI67+/TP63+ cells at low and high confluence. Less-confluent cell colonies are highly proliferative compared with high density, confluent monolayers (n=3; unpaired, two-tailed t-test; P<0.001). All experiments were performed using at least n=3 biological replicates. Scale bars: 200 μm (F, top); 100 μm (B,E,G; F, bottom); 50 μm (C,I,J). Either unpaired, two-tailed t-test or multiple comparisons one-way ANOVA with Bonferroni Correction post-hoc analysis were used to compare the mean of groups. For in vitro cultures, normalization and percentages were calculated using double-positive cells for DAPI/Hu-Nu, to determine human cell percentages in vitro and exclude mouse feeder cells. Unpaired t-test was used to determine statistical significance. ns, not significant (P<0.05); **P≤0.01, ***P≤0.001, ****P≤0.0001). Error bars in A,D,E represent s.d. Dashed horizontal lines in H and K represent 0, and dashed vertical lines are visual divisions between in vivo versus low-density versus high-density cell population counts.
Fig. 5.
Fig. 5.
2D basal progenitor-stem cells form entire esophageal epithelial sphere 3D organoids in vitro. (A) Schematic summary of the protocol for generation of basal-progenitor cells in 2D format, cryopreservation, and rescue for 2D/3D expansion. (B) Cell number quantifications of three patient (pt) lines thawed and rescued in either 2D, 3D (suspension versus Matrigel). Cells were counted when 2D wells reached 90-100% confluency and needed to passaging to avoid differentiation (time points vary by doubling rates per patient). (C) 2D expanded cells were passaged to either 3D (suspension versus Matrigel) or re-plated in 2D format (3T3-J2i). (D) By D6, growth was observed in all conditions under brightfield microscopy. (E) Quantification of the area of the sphere of 3D organoids of suspension versus Matrigel over time. (F) At D6, whole-mount immunofluorescence stains were performed on suspension versus Matrigel cultures and maximum projection confocal images for CRNN (luminal; arrowheads), COL17A1 (basal), KI67 (proliferation) and CDH1 (epithelial) are shown. (G) Quantification of the percentage of KI67+ cells in suspension versus Matrigel. (H) Area of 3D spheres over the span of 25 days was measured and quantified for sphere versus Matrigel. (I) Brightfield (BF) images and H&E stains on D25. (J) Matrigel spheres were collected and analyzed by immunofluorescence for the markers COL17A1 (basal), LY6D (epibasal-early), KRT4 (mid) and CRNN (late-luminal differentiation), visualizing the complete epithelial formation of esophageal organoids. Scale bars: 500 μm (D,I, left); 200 μm (I, middle); 100 μm (I, right; J, first three panels); 50 μm (J, last panel). In D,F, insets show enlargements of the boxed areas. Error bars in E,H represent s.d. In G, box limits represent the minimum and maximum values and horizontal line represents the mean. *P≤0.05 (unpaired, two-tailed t-test). Schematics in A and C created with BioRender.com.
Fig. 6.
Fig. 6.
Mapping the adult human esophagus in vivo and in vitro. Schematic representation describing and summarizing the findings of this study. We described a comprehensive map of different zones within the adult human epithelium at the single-cell level and validated it with protein markers. Markers for basal and three different zones in the suprabasal are described. Further, we show that human cells expanded in 2D are basal-proliferative and retain their ability to form an entire 3D esophagus either in suspension, Matrigel, ALI, or on a cover-slide without the need of ALI. Created with BioRender.com.

Similar articles

Cited by

References

    1. Abraham, A., Lipka, S., Hajar, R., Krishnamachari, B., Virdi, R., Jacob, B., Viswanathan, P. and Mustacchia, P. (2016). Erosive esophagitis in the obese: the effect of ethnicity and gender on its association. Gastroenterol. Res. Pract. 2016, 7897390. 10.1155/2016/7897390 - DOI - PMC - PubMed
    1. Alkaddour, A., McGaw, C., Hritani, R., Palacio, C., Nakshabendi, R., Munoz, J. C. and Vega, K. J. (2015). African American ethnicity is not associated with development of Barrett's Oesophagus after erosive Oesophagitis. Dig. Liver Dis. 47, 853-856. 10.1016/j.dld.2015.06.007 - DOI - PubMed
    1. Arnold, M., Laversanne, M., Brown, L. M., Devesa, S. S. and Bray, F. (2017). Predicting the future burden of esophageal cancer by histological subtype: international trends in incidence up to 2030. Am. J. Gastroenterol. 112, 1247-1255. 10.1038/ajg.2017.155 - DOI - PubMed
    1. Bailey, D. D., Zhang, Y., van Soldt, B. J., Jiang, M., Suresh, S., Nakagawa, H., Rustgi, A. K., Aceves, S. S., Cardoso, W. V. and Que, J. (2019). Use of HPSC-derived 3D organoids and mouse genetics to define the roles of YAP in the development of the esophagus. Development 146, dev178855. 10.1242/dev.178855 - DOI - PMC - PubMed
    1. Barbera, M., Pietro, M. D., Walker, E., Brierley, C., MacRae, S., Simons, B. D., Jones, P. H., Stingl, J. and Fitzgerald, R. C. (2015). The human squamous oesophagus has widespread capacity for clonal expansion from cells at diverse stages of differentiation. Gut 64, 11-19. 10.1136/gutjnl-2013-306171 - DOI - PMC - PubMed

Publication types