

Assessment of the exposure to PM2.5 in different Lebanese microenvironments at different temporal scales
- PMID: 36279025
- PMCID: PMC9589677
- DOI: 10.1007/s10661-022-10607-6
Assessment of the exposure to PM2.5 in different Lebanese microenvironments at different temporal scales
Abstract
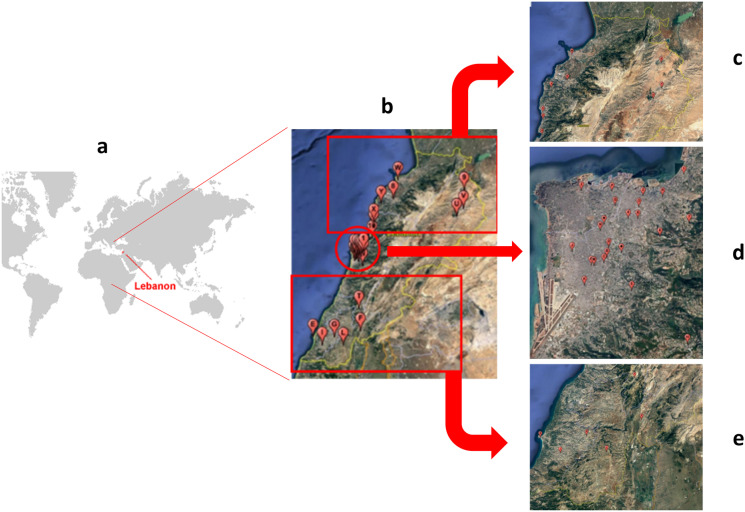
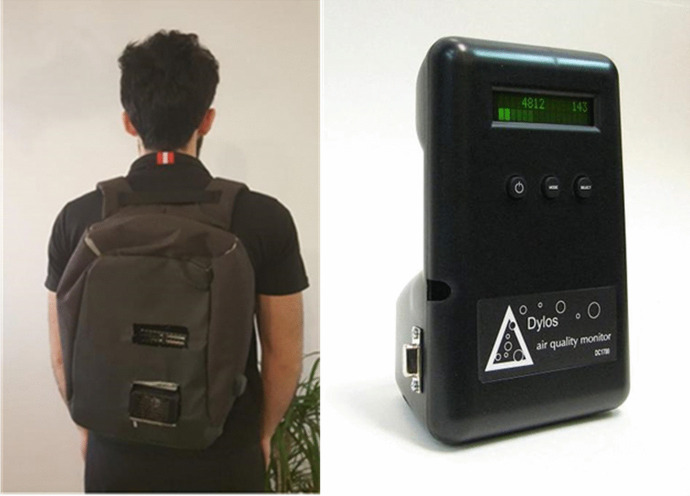
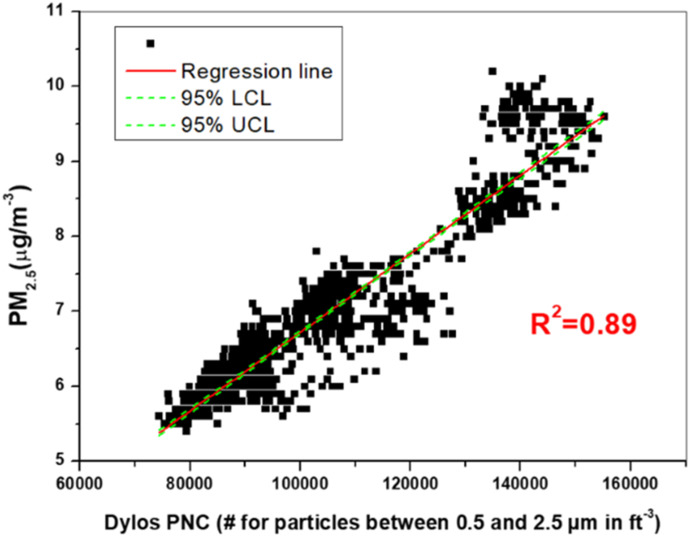
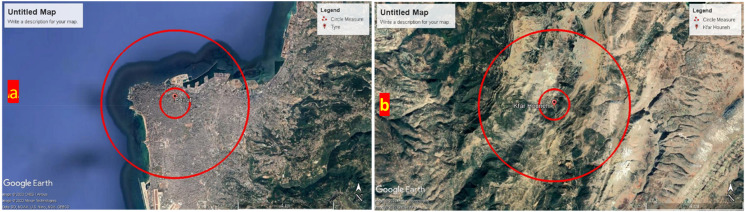
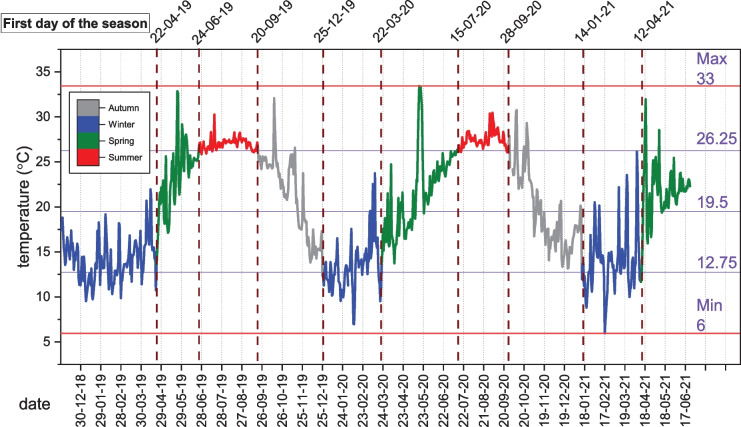
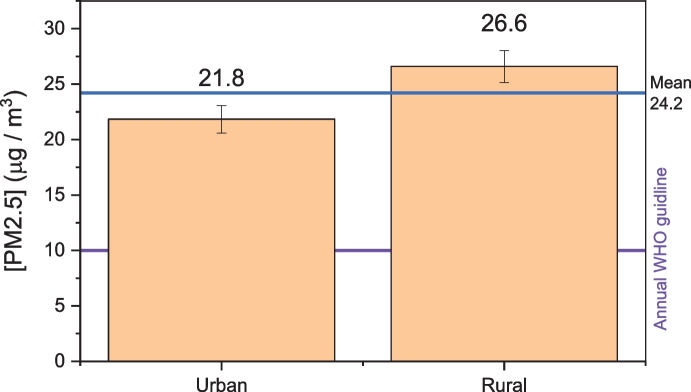
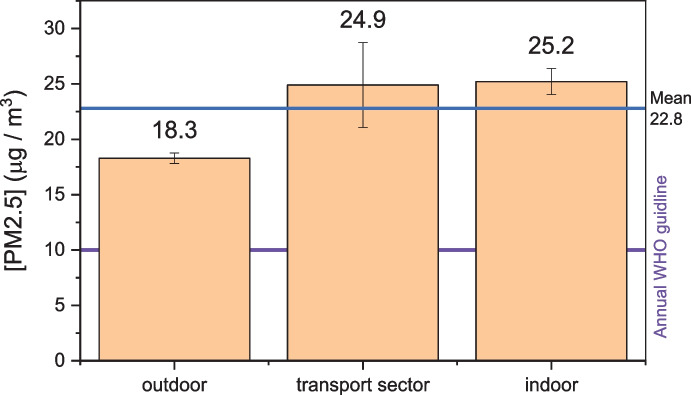
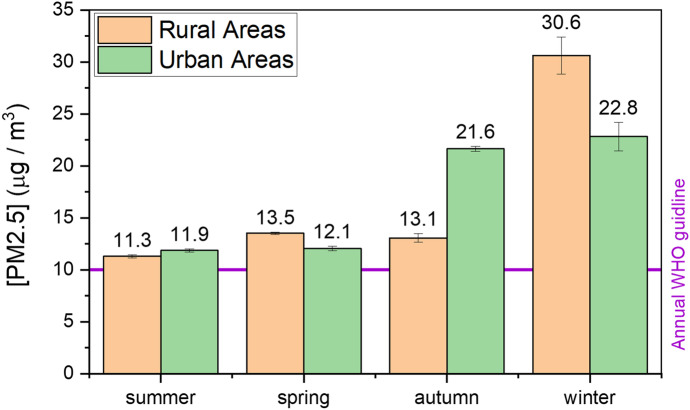
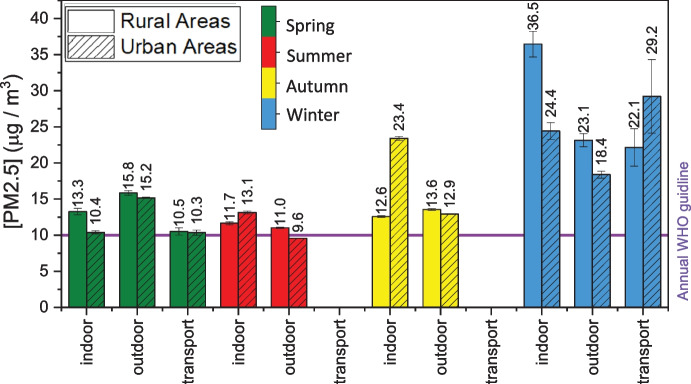
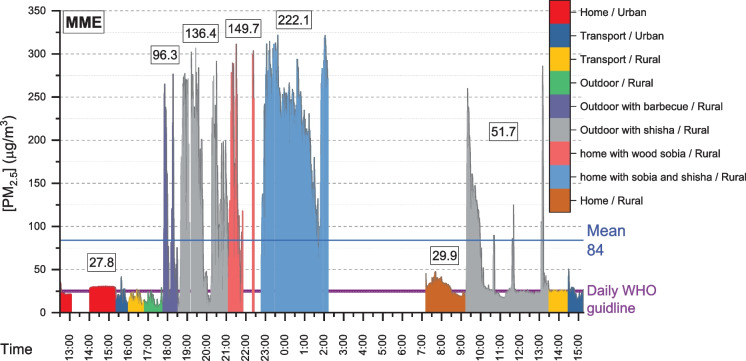
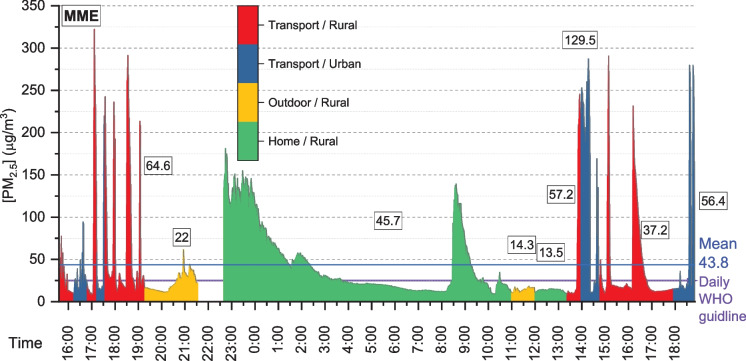
The weak potential of using the sole outdoor concentrations to represent personal exposure to PM2.5 is confirmed by the literature; therefore, it is important to account for a person's movements over time when estimating the short-term personal air pollution exposure within different microenvironments (MEs). This study is an example of applying an assessment method of the exposure to PM2.5 in different microenvironments at different temporal scales. A low-cost particle counter (the Dylos 1700) was used; its performance was validated in comparison with equivalent instruments such the SidePak AM520 Personal Aerosol Monitor (R2 = 0.89). This validation also provided a function to convert measured particle number concentrations (PNCs) into calculated particle mass concentrations. The 150 profiles that was collected on a minute-by-minute basis regarding PM2.5 concentration from December 2018 to May 2021 highlight the influence of individual activities and contextual factors on the air quality, so that Lebanon's annual PM2.5 mean (24.2 µg⁄m3) is 142% higher than the World Health Organization (WHO) annual mean guideline (10 µg⁄m3). Winter is the most polluted period due to the increased application of space heating devices. Additionally, the occurrence of dusty winds during the spring period leads to the elevated levels of dispersed PM2.5. Simultaneously, the rural zones are more polluted than urban ones due to the usage of more traditional heating equipment, in addition to the usage of chemical products like pesticides and fertilizers in agricultural activities in such areas. Furthermore, the (outdoor-indoor-transport) MEs indicate that the transport and indoor MEs have similar levels of suspended fine particulates, while outdoor MEs are less polluted. Studies based on the personal exposure to PM2.5 were generally applied on specific and limited places such as schools, workplaces, or residences. The study aims to shed light on the modern method in an attempt to estimate the personal exposure to PM2.5 and to inspire similar studies to achieve the maximum efficiency.
Keywords: Air pollution; Fine particulate matter; Microenvironments; Personal exposure; Portable monitoring tool.
© 2022. The Author(s), under exclusive licence to Springer Nature Switzerland AG.
Conflict of interest statement
The authors declare no competing interests.
Figures


Similar articles
-
Personal exposure monitoring of PM2.5 in indoor and outdoor microenvironments.Sci Total Environ. 2015 Mar 1;508:383-94. doi: 10.1016/j.scitotenv.2014.12.003. Epub 2014 Dec 11. Sci Total Environ. 2015. PMID: 25497678
-
Evaluating heterogeneity in indoor and outdoor air pollution using land-use regression and constrained factor analysis.Res Rep Health Eff Inst. 2010 Dec;(152):5-80; discussion 81-91. Res Rep Health Eff Inst. 2010. PMID: 21409949
-
Personal and ambient exposures to air toxics in Camden, New Jersey.Res Rep Health Eff Inst. 2011 Aug;(160):3-127; discussion 129-51. Res Rep Health Eff Inst. 2011. PMID: 22097188
-
Children environmental exposure to particulate matter and polycyclic aromatic hydrocarbons and biomonitoring in school environments: A review on indoor and outdoor exposure levels, major sources and health impacts.Environ Int. 2019 Mar;124:180-204. doi: 10.1016/j.envint.2018.12.052. Epub 2019 Jan 14. Environ Int. 2019. PMID: 30654326 Review.
-
A Scoping Review on Wearable Devices for Environmental Monitoring and Their Application for Health and Wellness.Sensors (Basel). 2022 Aug 11;22(16):5994. doi: 10.3390/s22165994. Sensors (Basel). 2022. PMID: 36015755 Free PMC article.
Cited by
-
Bladder Cancer in Lebanon: An Updated Epidemiological Comparison with Global Regions and a Comprehensive Review of Risk Factors.Cancer Control. 2025 Jan-Dec;32:10732748251330696. doi: 10.1177/10732748251330696. Epub 2025 Apr 1. Cancer Control. 2025. PMID: 40170215 Free PMC article. Review.
-
Elemental composition and health risk assessment of PM10, PM2.5, at different microenvironments: Addis Ababa, Ethiopia.PLoS One. 2024 Oct 25;19(10):e0309995. doi: 10.1371/journal.pone.0309995. eCollection 2024. PLoS One. 2024. PMID: 39453949 Free PMC article.
-
Prevalence and Progression of Vitamin D Deficiency in Greater Beirut and Mount Lebanon From 2013 to 2022: An Analysis of 19,452 Adults.J Clin Lab Anal. 2025 Apr;39(8):e70023. doi: 10.1002/jcla.70023. Epub 2025 Mar 28. J Clin Lab Anal. 2025. PMID: 40152347 Free PMC article.
References
-
- Abdallah C, Afif C, Sauvage S, Borbon A, Salameh T, Kfoury A, Leonardis T, Karam C, Formenti P, Doussin JF, Locoge N, Sartelet K. Determination of gaseous and particulate emission factors from road transport in a Middle Eastern capital. Transportation Research Part D: Transport and Environment. 2020;83:102361. doi: 10.1016/j.trd.2020.102361. - DOI
-
- Afif C, Chélala C, Borbon A, Abboud M, Adjizian-Gérard J, Farah W, Jambert C, Zaarour R, Badaro Saliba N, Perros PE, Rizk T. SO2 in Beirut: Air quality implication and effects of local emissions and long-range transport. Air Quality, Atmosphere & Health. 2008;1(3):167–178. doi: 10.1007/s11869-008-0022-y. - DOI
-
- Angelevska, B., Atanasova, V., & Andreevski, I. (2021). Urban air quality guidance based on measures categorization in road transport. Civil Engineering Journal, 7(2), 253–267. 10.28991/cej-2021-03091651
-
- Baltaci H, Ozgen Alemdar CS, Akkoyunlu BO. Background atmospheric conditions of high PM10 concentrations in Istanbul Turkey. Atmospheric Pollution Research. 2020;11(9):1524–1534. doi: 10.1016/j.apr.2020.06.020. - DOI
-
- Baz, Z. E., Nader, M., Zaitoun, F., Dana, R., Irani, C., Hejjaoui, A., Kairallah, E., Salloum, B. A., Antoun, S. A. D., Chreiteh, S., Maatouk, H., & Andary, B. (2010). Analysis of airborne pollen in Lebanon. Journal of Allergy and Clinical Immunology, 125(2), AB15. 10.1016/j.jaci.2009.12.090
MeSH terms
Substances
LinkOut - more resources
Full Text Sources
Medical
Miscellaneous
