. 2022 Oct 24;18(10):e1010456.
doi: 10.1371/journal.pgen.1010456. eCollection 2022 Oct.

Intracellular acidification is a hallmark of thymineless death in E. coli

Affiliations

Intracellular acidification is a hallmark of thymineless death in E. coli

Alexandra Ketcham et al. PLoS Genet. .

Abstract

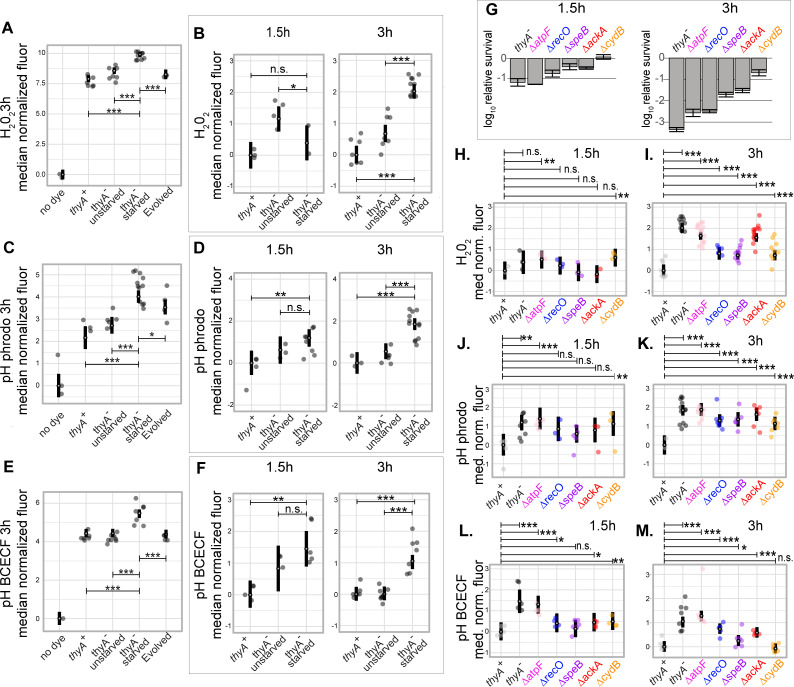
Thymidine starvation causes rapid cell death. This enigmatic process known as thymineless death (TLD) is the underlying killing mechanism of diverse antimicrobial and antineoplastic drugs. Despite decades of investigation, we still lack a mechanistic understanding of the causal sequence of events that culminate in TLD. Here, we used a diverse set of unbiased approaches to systematically determine the genetic and regulatory underpinnings of TLD in Escherichia coli. In addition to discovering novel genes in previously implicated pathways, our studies revealed a critical and previously unknown role for intracellular acidification in TLD. We observed that a decrease in cytoplasmic pH is a robust early event in TLD across different genetic backgrounds. Furthermore, we show that acidification is a causal event in the death process, as chemical and genetic perturbations that increase intracellular pH substantially reduce killing. We also observe a decrease in intracellular pH in response to exposure to the antibiotic gentamicin, suggesting that intracellular acidification may be a common mechanistic step in the bactericidal effects of other antibiotics.


Conflict of interest statement

The authors have declared that no competing interests exist.

Figures

Fig 1
Fig 1. Systematic genetic survey of TLD by Tn-seq reveals a novel role for pH homeostasis.
(A) A transposon insertion library was generated in the MG1655 thyA- strain and starved for thymidine. DNA adjacent to each insertion was amplified and sequenced at the beginning of the selection and at 3h. For each gene, the survival score is the log2 fold change of normalized reads at 3h/0h. (B-C) Volcano plot of survival score and significance showing genes in previously known pathways in color. Here and in the rest of this work, orange represents genes associated with respiration/ROS and blue represents genes involved in DNA replication/repair. Significance was calculated using an exact rate ratio test (using the rateratio.test R package) with a Benjamini & Yekutieli correction [103]. (C) is an inset for the area in the rectangle pictured in (B). (D-E) Volcano plot of survival score and significance showing in color genes from candidate lists that modulate cytoplasmic pH. Disruptions in genes involved in proton influx, or in lowering substrates needed for deacidification, have positive survival scores (shown in red). Conversely, disruptions in genes whose products are directly involved in proton consumption or producing substrates required for deacidification systems have negative survival scores (in light blue). (E) is an inset for the area in the rectangle pictured in (D). (F) Frequency of transposon insertions along the length of two newly identified TLD contributors at 0h and at 3h thymidine starvation. The enhancements at 3h are visualized using the Integrated Genome Browser [104]. The frequencies of each insertion site are shown in read counts per million. (G) Enhanced survival of validated genes. Candidates were validated by transferring Keio collection knockout alleles into MG1655 thyA-, and assessing their survival at 3h of thymidine starvation. All death assays, unless otherwise stated, were performed at 37°C. Relative survival was measured for at least three independent experiments, with error bars representing standard error of the mean. p-values for all death assays were calculated using a Welch t-test. * P<0.05, ** P<0.01, *** P < 0.001, **** P<0.0001. Here and in the rest of this work, red color represents genes in the acetate dissimilation pathway.
Fig 2
Fig 2. Genetic and transcriptional evidence for the role of pH homeostasis in laboratory evolution of extreme TLD-resistance.
(A) Experimental setup of laboratory evolution. Clones of thyA- strains in the MG1655 and MDS42 backgrounds were selected independently in 0.2μg/mL thymidine. After roughly 50 transfers, isolates were characterized for enhanced survival. (B) Short-term death assay for evolved isolates and parents at 3h thymidine starvation. The stars in Fig 2 correspond to the p-values as specified in Fig 1 and are calculated using a Welch t-test. (C) Long-term death assay for evolved isolates and parents. The points are averages from independent experiments, with error bars representing standard error of the mean. (D-E) Survival of TLD-sensitive versus various TLD-resistant strains. The stars at the bottom of a bar represent the p-values calculated for that strain compared to the parental strain. The stars under brackets represent the p-values calculated between the strains bracketed. (D) atpF early stop contributes to extreme TLD resistance. Two sibling isolates from the same evolved population share all mutations except an atpF early stop codon (the strain that survives less well has wild type atpF). The three strains shown are in the MDS42 background. (E) Clean deletion validations at 3h thymidine starvation. All knockouts are in the MG1655 thyA- background. Here and in the rest of this work, purple represents genes in putrescine / glutamate / arginine metabolism, and pink represents genes involved in proton translocation (or sequestration) systems. (F-G) Transcriptome profiling of TLD-sensitive and TLD-resistant strains. RNA was extracted and sequenced 30 minutes into thymidine starvation for the evolved strain in the MDS42 background and its parent strain. RNA was also extracted and sequenced in the unstarved condition. Select genes showing significant differential expression are shown in color. Rockhopper [99,100] uses a negative binomial distribution to estimate the uncertainties in the read counts. The p-values are FDR-corrected using the Benjamini-Hochberg procedure [101]. Genes in the Replication/Repair, ROS, and pH homeostasis pathways are shown in color. For comprehensive tables of the LFC of mRNA expression for the parental and evolved strains, see S7 and S8 Tables. (F) Gene expression of the evolved strain during starvation versus unstarved. (G) Gene expression of evolved versus parental strain during thymidine starvation. (H-I), Select genes with concordant effects across MG1655 and MDS42 backgrounds and across experimental approaches. In each, the left-hand column shows survival scores from the survival profiling experiment in the MG1655 strain and the right-hand column shows LFC of TPM in the evolved versus parental in the MDS42 background during thymidine starvation. (H) Genes that exacerbate TLD. The left-hand-column shows positive survival scores and the right-hand column shows down-regulation of RNA expression levels of the evolved strain vs. parental during starvation. (I) Genes that alleviate TLD. The left-hand-column shows negative survival scores and the right-hand column shows up-regulation of RNA expression levels of the evolved strain versus parental during starvation. See S9 Table for the full list of genes showing concordant effects.
Fig 3
Fig 3. Cells undergoing TLD show intracellular acidification followed by ROS accumulation, with the degree of survival correlated with pH.
Fluorescence data after accounting for cell size/shape (see Methods). Fluorescence was measured for each independent experiment using flow cytometry; in all flow cytometry figures unless otherwise noted, the large point for each condition shows the fitted effect for that biological condition, with error bars showing a 95% confidence interval. In addition, the median for each biological replicate is shown as a smaller translucent point (note that the shown biological replicates do not reflect corrections due to the random effect terms of the model, and thus show the actual biological variability of the experiment prior to model regularization). All values are offset by the fitted value for the first condition shown, which is thus centered on zero. Stars show significance tests based on the mixed effects model: * P<0.05, ** P<0.01, *** P < 0.001, **** P<0.0001. (A-F) Adjusted fluorescence for thyA+, parental, and evolved strains in the MG1655 background. All strains are in thymidine-free media except for those marked “unstarved”. (A-B) Adjusted fluorescence for strains dyed for H2O2 using Peroxy Orange. (A) Adjusted fluorescence measured at 3h. (B) Adjusted fluorescence measured at 1.5h and 3h. (C-D) Adjusted fluorescence measured for strains dyed for pHi using pHrodo Green. (C) Adjusted fluorescence measured at 3h. (D) Adjusted fluorescence measured at 1.5h and 3h. (E-F) Adjusted fluorescence measured for strains dyed for pHi using BCECF-AM. (E) Adjusted fluorescence measured at 3h. (F) Adjusted fluorescence measured at 1.5h and 3h. (G) Survival of the parental strain and knockouts in the MG1655 background at 1.5h and 3h thymidine starvation. (H-M) All strains shown are in thymidine-free media and in the MG1655 background. (H-I) Adjusted fluorescence for strains stained for H2O2 using Peroxy Orange. (H) Adjusted fluorescence at 1.5h thymidine starvation. (I) Adjusted fluorescence at 3h thymidine starvation. (J-K) Adjusted fluorescence for cells stained for pHi using pHrodo Green. (J) Adjusted fluorescence at 1.5h and (K) Adjusted fluorescence at 3h. (L-M) Adjusted fluorescence for cells stained for pHi using BCECF-AM. (L) Adjusted fluorescence at 1.5h. (M) Adjusted fluorescence at 3h.
Fig 4
Fig 4. Experimental manipulation of pHi modulates survival.
(A-C) Impact of arginine supplementation on survival and pHi. (A) L-arginine significantly increases the survival of thyA- strains in the MG1655 and MDS42 backgrounds at 3h thymidine starvation. (B-C) Fluorescence was measured for each independent experiment for strains stained for pHi at 3h thymidine starvation and measured using flow cytometry using pHrodo Green (B) and BCECF-AM (C). (D-G) Impact of ackA deletion on survival and pHi. (D) Deletion of ackA from various resistant mutants results in significant increases in survival at 3h thymidine starvation. (E-G) Adjusted fluorescence of strains stained for pHi at 3h thymidine starvation and measured using flow cytometry using BCECF-AM. (H) Minimum inhibitory concentration (MIC) of the thyA- and the ΔackA strain for the antibiotic gentamicin. The concentrations are in μg/mL. (I-J) Adjusted fluorescence of wild type (thyA+) cells stained for pHi at 1.5h with and without 1μg/mL gentamicin treatment and measured using flow cytometry using pHrodo Green (I) or BCECF-AM (J). (K) Adjusted fluorescence of wild type (thyA+) cells stained for ROS accumulation at 1.5h with and without 1μg/mL gentamicin treatment and measured using flow cytometry using Peroxy Orange. The p-values in (A) and (D) were calculated as for the death assays in the rest of this work, using a Welch t-test. See Fig 3 caption for definitions of plotted values and significance tests for flow cytometry data.

References

    1. Cohen SS, Barner HD. Studies on Unbalanced Growth in Escherichia Coli. Proc Natl Acad Sci U S A. 1954;40(10):885–93. doi: 10.1073/pnas.40.10.885 ; PubMed Central PMCID: PMC534191. - DOI - PMC - PubMed
    1. Barner HD, Cohen SS. The induction of thymine synthesis by T2 infection of a thymine requiring mutant of Escherichia coli. J Bacteriol. 1954;68(1):80–8. doi: 10.1128/jb.68.1.80-88.1954 ; PubMed Central PMCID: PMC357338. - DOI - PMC - PubMed
    1. Ahmad SI, Kirk SH, Eisenstark A. Thymine metabolism and thymineless death in prokaryotes and eukaryotes. Annu Rev Microbiol. 1998;52:591–625. doi: 10.1146/annurev.micro.52.1.591 . - DOI - PubMed
    1. Bedoui Y, Guillot X, Selambarom J, Guiraud P, Giry C, Jaffar-Bandjee MC, et al.. Methotrexate an Old Drug with New Tricks. Int J Mol Sci. 2019;20(20). Epub 2019/10/30. doi: 10.3390/ijms20205023 ; PubMed Central PMCID: PMC6834162. - DOI - PMC - PubMed
    1. Wrobel A, Arciszewska K, Maliszewski D, Drozdowska D. Trimethoprim and other nonclassical antifolates an excellent template for searching modifications of dihydrofolate reductase enzyme inhibitors. J Antibiot (Tokyo). 2020;73(1):5–27. Epub 2019/10/04. doi: 10.1038/s41429-019-0240-6 ; PubMed Central PMCID: PMC7102388. - DOI - PMC - PubMed

Publication types