. 2022 Oct 24;20(10):e3001858.
doi: 10.1371/journal.pbio.3001858. eCollection 2022 Oct.

Phosphoinositide species and filamentous actin formation mediate engulfment by senescent tumor cells

Affiliations

Phosphoinositide species and filamentous actin formation mediate engulfment by senescent tumor cells

Wesley D Frey et al. PLoS Biol. .

Abstract

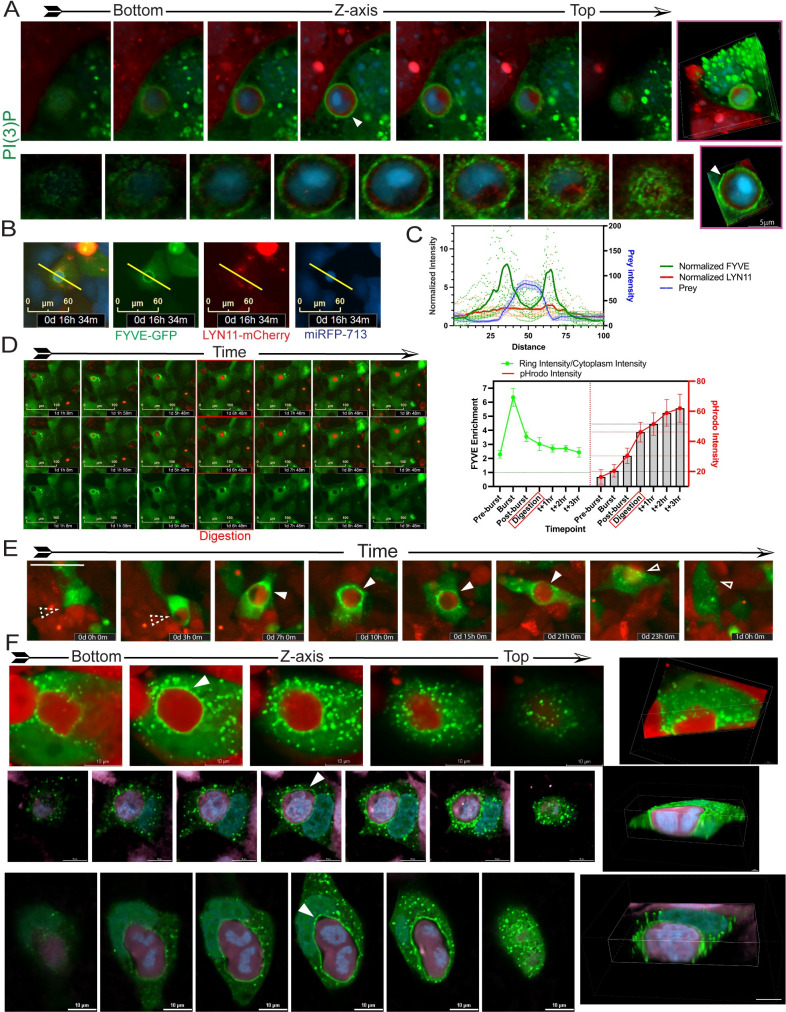
Cancer cells survive chemotherapy and cause lethal relapse by entering a senescent state that facilitates expression of many phagocytosis/macrophage-related genes that engender a novel cannibalism phenotype. We used biosensors and live-cell imaging to reveal the basic steps and mechanisms of engulfment by senescent human and mouse tumor cells. We show filamentous actin in predator cells was localized to the prey cell throughout the process of engulfment. Biosensors to various phosphoinositide (PI) species revealed increased concentration and distinct localization of predator PI(4) P and PI(4,5)P2 at the prey cell during early stages of engulfment, followed by a transient burst of PI(3) P before and following internalization. PIK3C2B, the kinase responsible for generating PI(3)P, was required for complete engulfment. Inhibition or knockdown of Clathrin, known to associate with PIK3C2B and PI(4,5)P2, severely impaired engulfment. In sum, our data reveal the most fundamental cellular processes of senescent cell engulfment, including the precise localizations and dynamics of actin and PI species throughout the entire process.


Conflict of interest statement

The authors have declared that no competing interests exist.

Figures

Fig 1
Fig 1. Filamentous actin in predator cells localizes to prey cells throughout the engulfment process.
Indicated “predator” MCF-7 cell lines were treated with 250 nM doxorubicin (DOXO) for 24 hours, washed, and plated on indicated not-treated (NT) MCF-7 “prey” cells, creating a “DOXO-NT” culture. Cells were imaged over days 4–8 as noted. (A) Volume view reconstruction of time course live-cell confocal imaging of a senescent LifeAct-GFP-MCF-7 cell during contact and partial overtopping of proliferating mCherry-MCF-7 cells on day 7 post-doxorubicin. Concentrated areas of F-actin are indicated by closed arrows, scale bar = 10 μm. (B) Volume view reconstruction of time course live-cell confocal imaging of a senescent LifeAct-GFP-MCF-7 cell following engulfment and through partial digestion of proliferating mCherry-MCF-7 cells. The top of the predator cell was removed above the 51.2% axial plane to visualize the internalized mCherry prey cell. Examples of concentrated F-actin are indicated by closed arrows, scale bar = 10 μm. (C-E) Axial slices along the Z-axis and volume view reconstruction of senescent LifeAct-GFP-MCF-7 cells during engulfment of a proliferating mCherry-MCF-7 cell. (C) shows contact and early overtopping, scale bar = 20 μm; (D) shows a mostly overtopped prey cell and a volume view with upper part of predator removed as in (B) scale bar = 20 μm. (E) shows a fully overtopped, engulfed cells with F-actin concentrated in lamellipodia and filipodia above and below the prey, scale bar = 25 μm. 3D volume view is shown from the bottom. (F) Volume view reconstruction of a senescent LifeAct-GFP-MCF-7 cell after fully engulfing a proliferating mCherry-MCF-7 cell. The top and side of the predator were removed along axial and sagittal planes to visualize engulfed cell, scale bar = 25 μm. (G, H) Confocal imaging with z-stack projections shown along right and bottom for senescent LifeAct-GFP-MCF-7 cells after fully engulfing proliferating mCherry-MCF-7 cells. At right of (G), volume views to visualize localization of the F-actin ring in the predator with an engulfed mCherry prey cell. Top right is top view, bottom right is side view, scale bar = 10 μm. At bottom of (H), axial slices displaying formation of smaller rings around digested portions of prey cell. Scale bar = 25 μm. (I) Schematic of a senescent LifeAct-GFP cell with 2 engulfed mCherry prey cells. Shown are example ROIs from the cell membrane, the cytoplasm, and the “ring” around the cell being engulfed. (J) Five individual LifeAct-GFP-MCF-7 predator cells were followed during engulfment of pHrodo red stained NT prey cells, and LifeAct-GFP intensity was measured at cytoplasm, nonengulfing membrane, and ring [as depicted in (I)] and pHrodo intensity was measured (right). The left graph shows the ratio of LifeAct-GFP intensity in the ring:cytoplasm (light green) and membrane:cytoplasm over 7 hours for 5 cells; error bars represent SEM. The right graph shows pHrodo red intensity over the same time course. Underlying data can be found at S1 Data. (K) Time course images of 1 representative cell used to generate data for (J). Top: merged green/red channels with ROI used for pixel intensity measurements marked in yellow. Middle: merged green/red channels. Lower: green channel. (L) Model of predator cell F-actin localization during the 5 stages of engulfing a prey cell.
Fig 2
Fig 2. PI biosensors expressed in predator cells reveal PI(4,5)P2, PI(4)P, and PI(3)P, but not PI(3,4,5)P3 or PI(4)P, localize to the prey cells during engulfment.
MCF-7 cell lines expressing biosensors that detect indicated PI species were treated with 250 nM doxorubicin for 24 hours, washed, and plated on untreated mCherry-MCF-7 “prey” cells. DOXO-NT cultures were imaged over days 3–8. Time course live-cell imaging of senescent MCF-7 cells that express (A) PLCD1-GFP marking PI(4,5)P2; (B) P4M-SidMx2-GFP marking PI(4)P; (C) 2xFYVE-GFP marking PI(3)P; (D) TAPP1-GFP marking PI(3,4)P2; (E) BTK-GFP marking PI(3,4,5)P3; (F) PLCD1(R40L)-GFP mutant that does not bind PI species (Negative Ctrl), throughout the entire process of engulfing mCherry-MCF-7 cells. Scale bar = 100 μm.
Fig 3
Fig 3. Confocal imaging shows precise localizations of PI(4,5)P2, PI(4)P, and PI(3)P in predator cells during engulfment.
Axial slices along the Z-axis and volume view reconstructions of senescent MCF-7 cells, expressing different PI biosensors, during different stages of engulfment in DOXO-NT cultures. (A) PLCD1-GFP localization in predator cells during partial (top) and complete (bottom) overtopping of an mCherry-MCF-7 cell (top), scale bar = 20 μm (bottom), scale bar = 10 μm; (B) P4M-SidMx2-GFP localization in a predator cell during partial (top) and complete (bottom) overtopping of an mCherry-MCF-7 cell, scale bar = 10 μm. Closed arrows indicate examples of concentrated P4M-SidMx2-GFP localized to lamellipodia advancing over the prey cell. (C) Localization of PLCD1(R40L)-GFP mutant that does not bind PI species, during early (closed arrow), mid (dashed arrow), and late stage (open arrow) engulfments of mCherry-MCF-7 cells, scale bar = 10 μm. (D) MCF-7 cells coexpressing PLCD1-GFP and LYN11-mCherry (a control that localizes to membranes but is not involved in phagocytic processes) were imaged while engulfing NIR-MCF-7 cells. Left: representative images of 3 cells and the ROI used for quantitation indicated. Right: pixel intensities for the indicated ROI were determined and the ratio of intensity for PLCD1-GFP to LYN11-mCherry was calculated for 2–3 areas of the membrane edge actively contacting the prey cell (engulfing edge), 2–3 areas of the uninvolved membrane (nonengulfing edge), and 1 measurement per cell for the whole cytoplasm. Ratio calculations for 6 individual cells are shown as violin plots with mean and SEM indicated by red dashed line and black dashed line, respectively. Underlying data can be found at S1 Data. (E) Ratios as in (D) were calculated and shown for MCF-7 cells coexpressing SidMx2-GFP and LYN11-mCherry. Underlying data can be found at S1 Data. (F) Five PLCD1-GFP-MCF-7 predator cells were followed during engulfment of pHrodo red stained prey cells, and PLCD1-GFP intensity was measured at cytoplasm, membrane, and ring (as depicted in Fig 1I) and pHrodo intensity was measured (right). The left graph shows the ratio of PLCD1-GFP intensity of the ring:cytoplasm (light green) and membrane:cytoplasm over 12 hours for 5 cells; error bars represent SEM. The right graph shows pHrodo red intensity +/− SEM over the same time course. Underlying data can be found at S1 Data. (G) Time course images of 1 representative cell used to generate data for (F). Top: merged green/red channels with ROI used for pixel intensity measurements marked in yellow. Middle: merged green/red channels. Lower: green channel. Scale bar = 100 μm. In Fig 4D and 4E, two-way ANOVA was used for analysis, p-value < 0.05 = *, p-value < 0.01 = **, p-value < 0.001 = ***.
Fig 4
Fig 4. Confocal imaging shows precise localization of PI(3)P in predator cells during engulfment.
(A) Axial slices along the Z-axis and volume view reconstructions of a senescent MCF-7 cell expressing 2xFYVE-GFP and an mCherry expressing MCF-7 prey cell in a DOXO-NT culture. Top panel scale bar = 10 μm; bottom panel scale bar = 1 μm. (B, C) Representative image of a 2xFYVE-GFP cell engulfing a NIR-MCF-7 cell. Pixel intensity was determined across the distance of the yellow line and plotted in (C) for 5 individual cells. Scale bar = 60 μm. Underlying data can be found at S1 Data. (D) Five 2xFYVE-GFP-MCF-7 predator cells were followed during engulfment of pHrodo red stained prey cells, and 2xFYVE-GFP intensity was measured at cytoplasm, membrane, and ring (as depicted in Fig 1I) and pHrodo intensity was measured (right). The right graph shows the ratio of 2xFYVE-GFP intensity of the ring:cytoplasm (light green) over multiple hours surrounding pHrodo intensity increase for 5 cells. Error bars represent SEM. Underlying data can be found at S1 Data. (D) Representative images of one 2xFYVE-GFP-MCF-7 predator cell engulfing pHrodo-labeled MCF-7 prey used for Fig 4D (right). ROIs used for quantification are shown in top panel. Scale bar = 100 μm. (E) Time course of a 2xFYVE-GFP-MCF-7 cell engulfing an MCF-7-mCherry prey cell. Dashed arrows indicate predator/prey contact; closed arrows indicate the overtopped prey cell with 2xFYVE concentration; open arrows indicate the prey cell no longer overtopped mCherry prey cell. Scale bar = 50 μm. (F) Axial slices along the Z-axis and volume view reconstructions of senescent 2xFYVE-GFP-MCF-7 predator cells engulfing mCherry-MCF-7 prey cells. Leftmost image shows the bottom axial slice. Closed arrows indicate 2xFYVE-GFP concentration at the prey cell. Scale bar = 10 μm.
Fig 5
Fig 5. PI(4,5)P2, PI(4)P colocalize at contact through overtopping of prey, then dissipate as PI(3)P localizes tightly around prey during later stages.
(A) Time course live-cell imaging of a senescent MCF-7 cell that expresses PLCD1-mCherry and P4M-SidMx2-GFP, throughout the entire process of engulfing NIR-MCF-7 prey cells in a DOXO-NT culture. Closed arrows indicate examples PLCD1-mCherry and P4M-SidMx2-GFP colocalization during engulfment. (B) Time course live-cell imaging of a senescent MCF-7 cell that expresses PLCD1-mCherry and 2xFYVE-GFP, throughout the entire process of engulfing a NIR-MCF-7 cell. Closed arrows indicate localization of PLCD1-GFP, but not 2xFYVE-mCherry, at mid stage engulfment. Open arrows indicate 2xFYVE-mCherry localization, but not PLCD1-GFP, at late-stage engulfment. Scale bar = 100 μm for A+B. (C) Volume view reconstruction of a senescent MCF-7 cell expressing PLCD1-GFP and P4M-SidMx2-mCherry that is engulfing 3 NIR-MCF-7 cells. Middle panels show separate color channels; bottom panel shows axial planes from bottom to top. Closed arrows indicate examples PLCD1-mCherry and P4M-SidMx2-GFP colocalization during engulfment, scale bar = 10 μm. (D) Volume view reconstruction of a senescent MCF-7 cell expressing PLCD1-mCherry and 2xFYVE-GFP, which is engulfing 2 NIR-MCF-7 cells. Middle panels show separate color channels; bottom panels show axial planes from bottom to top. Closed arrows indicate localization of PLCD1-mCherry, but not 2xFYVE-GFP, at mid stage engulfment. Open arrows indicate 2xFYVE-mCherry localization, but not PLCD1-GFP, at an internalized cell, scale bar = 10 μm.
Fig 6
Fig 6. Predator cell PIK3C2B colocalizes with PI(3)P during engulfment and is required for complete internalization.
(A) CRISPR-Cas9 single-cell clone PIK3C2B knockouts of MCF-7 were screened by immunoblot. Clones indicated by asterisk were chosen for further testing. (B) Predator cell engulfment rates (left) and confluency as a measure of viability (right) for senescent MCF-7 parental cells and 3 PIK3C2B knockout clones were determined by time course imaging in a DOXO-NT culture. Underlying data can be found at S1 Data. (C) Time course live-cell imaging of a senescent MCF-7 cell expressing 2xFYVE-mCherry and PIK3C2B-GFP throughout the entire process of engulfing an NIR-MCF-7 cell, scale bar = 100 μm. (D) Left: Merged (top) and separate (middle, lower) color channels of axial planes from bottom to top of a senescent MCF-7 cell expressing 2xFYVE-mCherry and PIK3C2B-GFP, engulfing NIR-MCF-7 cells. Right, volume view reconstruction of the same image, scale bar = 10 μm.
Fig 7
Fig 7. Clathrin relocalizes to sites of engulfment and is required for efficient completion of internalization.
(A) Time course live-cell imaging of a senescent MCF-7 cell expressing CLTC-mCherry and PIK3C2B-GFP, throughout the entire process of engulfing an NIR-MCF-7 prey cell in a DOXO-NT culture. Scale bar = 100 μm. (B) Predator cell engulfment rates (upper) and confluency (lower) in DOXO-NT cultures were determined for senescent GFP-MCF-7 cells that were treated with indicated drugs or made to express an shRNA construct targeting CLTC. Concentrations of Dynasore, Filipin3, and MBCD producing toxicity are displayed as red lines (Dynasore 75 uM, 100 uM and MBCD 6 mg/mL). Underlying data can be found at S1 Data.

References

    1. Bertheau P, Plassa F, Espie M, Turpin E, de Roquancourt A, Marty M, et al.. Effect of mutated TP53 on response of advanced breast cancers to high-dose chemotherapy. Lancet. 2002;360(9336):852–4. Epub 2002/09/24. doi: 10.1016/S0140-6736(02)09969-5 [pii]. . - DOI - PubMed
    1. Bertheau P, Turpin E, Rickman DS, Espie M, de Reynies A, Feugeas JP, et al.. Exquisite sensitivity of TP53 mutant and basal breast cancers to a dose-dense epirubicin-cyclophosphamide regimen. PLoS Med. 2007;4(3):e90. Epub 2007/03/29. 06-PLME-RA-0470R3 [pii]. doi: 10.1371/journal.pmed.0040090 ; PubMed Central PMCID: PMC1831731. - DOI - PMC - PubMed
    1. Ungerleider NA, Rao SG, Shahbandi A, Yee D, Niu T, Frey WD, et al.. Breast cancer survival predicted by TP53 mutation status differs markedly depending on treatment. Breast Cancer Res. 2018;20(1):115. doi: 10.1186/s13058-018-1044-5 - DOI - PMC - PubMed
    1. Jackson JG, Pant V, Li Q, Chang LL, Quintas-Cardama A, Garza D, et al.. p53-Mediated Senescence Impairs the Apoptotic Response to Chemotherapy and Clinical Outcome in Breast Cancer. Cancer Cell. 2012;21(6):793–806. Epub 2012/06/16. doi: 10.1016/j.ccr.2012.04.027 ; PubMed Central PMCID: PMC3376352. - DOI - PMC - PubMed
    1. Tonnessen-Murray C, Ungerleider NA, Rao SG, Wasylishen AR, Frey WD, Jackson JG. p53 Mediates Vast Gene Expression Changes That Contribute to Poor Chemotherapeutic Response in a Mouse Model of Breast Cancer. Transl Oncol. 2018;11(4):930–940. doi: 10.1016/j.tranon.2018.05.003 - DOI - PMC - PubMed

Publication types

Substances