. 2022 Oct 24;18(10):e1010467.
doi: 10.1371/journal.pgen.1010467. eCollection 2022 Oct.

Activation of the integrative and conjugative element Tn916 causes growth arrest and death of host bacteria

Affiliations

Activation of the integrative and conjugative element Tn916 causes growth arrest and death of host bacteria

Emily L Bean et al. PLoS Genet. .

Abstract

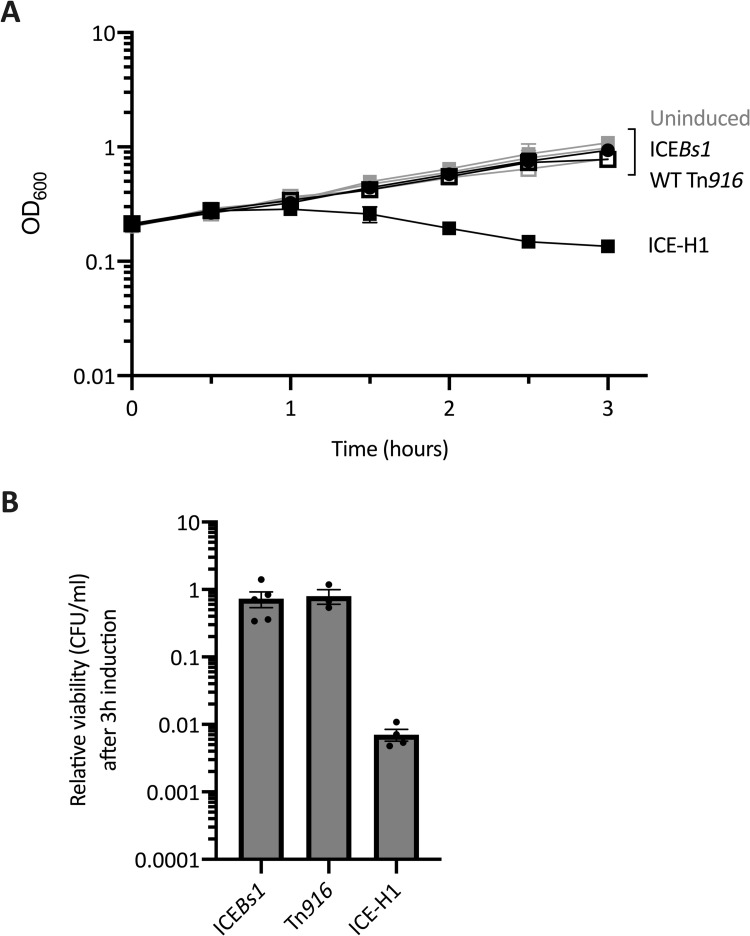
Integrative and conjugative elements (ICEs) serve as major drivers of bacterial evolution. These elements often confer some benefit to host cells, including antibiotic resistance, metabolic capabilities, or pathogenic determinants. ICEs can also have negative effects on host cells. Here, we investigated the effects of the ICE (conjugative transposon) Tn916 on host cells. Because Tn916 is active in a relatively small subpopulation of host cells, we developed a fluorescent reporter system for monitoring activation of Tn916 in single cells. Using this reporter, we found that cell division was arrested in cells of Bacillus subtilis and Enterococcus faecalis (a natural host for Tn916) that contained an activated (excised) Tn916. Furthermore, most of the cells with the activated Tn916 subsequently died. We also observed these phenotypes on the population level in B. subtilis utilizing a modified version of Tn916 that can be activated in the majority of cells. We identified two genes (orf17 and orf16) in Tn916 that were sufficient to cause growth defects in B. subtilis and identified a single gene, yqaR, that is in a defective phage (skin) in the B. subtilis chromosome that was required for this phenotype. These three genes were only partially responsible for the growth defect caused by Tn916, indicating that Tn916 possesses multiple mechanisms to affect growth and viability of host cells. These results highlight the complex relationships that conjugative elements have with their host cells and the interplay between mobile genetic elements.


Conflict of interest statement

The authors have declared that no competing interests exist.

Figures

Fig 1
Fig 1. Genetic maps of Tn916, ICEBs1, and (ICEBs1-Tn916)-H1.
Maps of the conjugative elements used in these studies are shown: A) Tn916, B) ICEBs1, and C) (ICEBs1-Tn916)-H1 (or ICE-H1, for short). Open reading frames are indicated by horizontal boxes with arrows at the end (gray for Tn916, black for ICEBs1). Tn916 gene names are abbreviated to include only the number designation from the name (i.e., “orf23” is written as “23”), and, when appropriate, the homologous ICEBs1 gene is written below. ICE-H1 contains a combination of Tn916 and ICEBs1 genes, as previously described [41]. Functional modules are indicated by brackets below each map. Black boxes indicate attachment sites attL and attR at the ends of each element. In B. subtilis, Tn916 is integrated between yufK and yufL, unless otherwise indicated. ICEBs1 and ICE-H1 are integrated at trnS-leu2. Some of the promoters are indicated by bent arrows and some transcription terminators (in Tn916) are indicated by “T” shapes. ICE-H1-ΔattR Δorf20 {ICE-H1-ΔattR (Rep-)} is essentially the same as ICE-H1 (panel C) with a deletion of attR (right end, from ICEBs1) and orf20 (encoding the relaxase needed for nicking at oriT, conjugative transfer, and autonomous rolling circle replication). Previously determined origins of transfer (oriT) and single strand origins of replication (sso) are indicated by a “-”above the genetic map [32,84,92,93]. To induce activation of ICEBs1 and ICE-H1 and their derivatives, the activator RapI was overproduced from Pxyl-rapI (located at an ectopic locus on the chromosome; see Table 2). Active RapI causes the anti-repressor and protease ImmA to cleave the ICEBs1 repressor ImmR, thereby causing derepression of transcription from the promoter Pxis [42,43,83]. This figure is adapted from [41].
Fig 2
Fig 2. Activation of ICE-H1 causes growth arrest and cell death.
Strains containing ICEBs1 (MMB970), Tn916 (CMJ253) or ICE-H1 (ELC1214) were grown in defined minimal medium with arabinose to early exponential phase. Cultures were split into two at an OD of ~0.2 (indicated as time = 0 hours) and the appropriate inducer was added (1% xylose to stimulate rapI expression, or +2.5 μg/ml tetracycline to stimulate Tn916 activation) to one part and the second part was left without induction. Data from four or more experiments (except for the growth curves for ICEBs1 and ICE-H1, time points 0.5, 1.5. and 2.5 h which were from two independent experiments) are presented as averages (A) or individual data points (B), and error bars represent standard error of the mean. A) Growth was monitored by OD600 for three hours. Gray lines indicate growth of uninduced cultures. Black lines indicate growth of the induced cultures; ICEBs1 (filled circles); Tn916 (open squares); ICE-H1 (filled squares). Error bars could not always be depicted due to the size of each data point. B) The relative colony forming units per ml (CFUs/ml) of cultures after three hours of element activation was calculated as the number of CFUs formed by the induced culture, divided by that from the uninduced culture (a value of “1” indicates there is no change in CFUs with induction). Significant differences based on P < 0.05 in unpaired two-tailed T-tests include comparisons between ICE-H1 and each of the other elements.
Fig 3
Fig 3. orf16 and orf17 are involved in the growth arrest caused by ICE-H1.
Strains containing ICEBs1attR (Rep- due to ΔnicK) (closed circles, ELC1095), ICEBs1helP-cwlT, ΔyddJ-yddM) (open circles, ELC1226), or ICE-H1-ΔattR (Rep- due to Δorf20) (closed squares, ELC1076) with the indicated deletion(s) are indicated in the figure. Deletions are indicated by gene name or number and include: Δorf23-22 (open squares, ELC1945), Δorf21 (closed hexagons, ELC1916), Δorf19 (open hexagons, ELC1915), ΔardA (stars, ELC1707), Δorf17 (closed downward triangle, ELC1419), Δorf16 (closed upward triangles, ELC1420), Δorf17-16 (closed diamonds, ELC1942), Δorf17-orf16 (with lacA::Pxis-orf17-orf16; plus signs, ELC1550), orf16(K477E) (asterisks, ELC1899), Δorf15 (open downward triangles ELC1418), Δorf14 (open upward triangles, ELC1708), and Δorf13 (open diamonds, ELC1705). Strains were grown in minimal arabinose medium to early exponential phase. At time = 0 hours, when cultures were at an OD600 ~0.2, cultures were split into inducing (+1% xylose to stimulate rapI expression) and non-inducing conditions. Data from three or more experiments are presented as averages (A, C) or individual data points (B), and error bars represent standard error of the mean. A) Growth was monitored by OD600 for three hours. Black lines indicate growth of the indicated induced cultures; gray lines (difficult to see as they are clustered in the set of strains at the top of the graph) indicate growth of uninduced cultures. Error bars could not always be depicted due to the size of each data point. Growth of the strains clustered at the top were virtually indistinguishable from each other. Growth of the strains clustered at the bottom were virtually indistinguishable from each other, but clearly different from those at the top. In between was the strain with Δorf16, which was consistently different from all the others. B) The relative CFUs/ml of cultures after three hours of element activation was calculated as the number of CFUs formed by the induced culture, divided by that from the uninduced culture (a value of “1” indicates there is no change in CFUs with induction). Significant differences based on P < 0.05 in unpaired two-tailed T-tests include comparisons between: ICE-H1-ΔattR (Rep-) and ICEBs1-ΔattR (Rep-); ICE-H1-ΔattR (Rep-) and ICE-H1-ΔattR (Rep-) containing either Δorf21, Δorf19, Δorf17-16, or Δorf15. C) The relative CFUs/ml of cultures were evaluated every 30 minutes for three hours post-induction and were calculated as the number of CFUs formed by the induced culture, divided by that from the uninduced culture (a value of “1” indicates there is no change in CFUs with induction). Data for the 3 hr time point are the same as in the bar graph in panel B. Error bars could not always be depicted due to the size of each data point.
Fig 4
Fig 4. Orf17-16 are sufficient to cause arrest of cell growth.
Strains containing overexpression alleles (indicated in the figure with an upwards arrow) of orf17 (downward triangle, ELC1494), orf16 (upward triangle, ELC1491), orf17-16 (diamonds, ELC1496), or an empty vector (open circles, ELC1495) and a strain containing ICE-H1-ΔattR (Rep-) (squares, ELC1076) were grown in minimal medium with arabinose to early exponential phase. At an OD600 of ~0.2 (time = 0), cultures were split into inducing (+1% xylose to stimulate rapI expression) and non-inducing conditions. Data from three or more experiments are presented as averages (A) or individual data points (B), and error bars represent standard error of the mean. A) Growth was monitored by OD600 for three hours. Black lines indicate growth of the induced cultures; gray lines (difficult to see as they are clustered in the set of strains at the top of the graph) indicate growth of uninduced cultures. The growth curve of ELC1076 {containing ICE-H1-ΔattR (Rep-)} from Fig 3A is included as reference. Error bars could not always be depicted due to the size of each data point. B) The relative CFUs/ml of cultures after three hours of element induction was calculated as the number of CFUs formed by the induced culture, divided by that from the uninduced culture (a value of “1” indicates there is no change in CFUs with induction). Results from the overexpression of orf17-orf16 were significantly different from the empty vector control based on P < 0.05 in unpaired two-tailed T-tests.
Fig 5
Fig 5. Effects of skin-encoded yqaR on growth arrest caused by orf17-16 and ICE-H1.
Indicated strains were grown in defined minimal arabinose medium to early exponential phase. At time = 0 hours, when cultures were at an OD600 ~0.2, cultures were split into inducing (+1% xylose to stimulate rapI expression and de-repression of orf17-16 or of the indicated ICE hybrid) and non-inducing (no xylose) conditions. Data from three or more experiments are presented as averages (A, C) or individual data points (B, D), and error bars represent standard error of the mean. A,B) Strains contained orf17-16 overexpression alleles with the following additional alleles: WT (diamonds, ELC1496), Δskin (open circles, ELC1891), ΔyqaR (open upward triangles, ELC1892), ΔyqaR yhdGH::empty (open downward triangles, ELC1918), Δskin PyqaR-yqaR (closed circles ELC1903), and ΔyqaR PyqaR-yqaR (closed upward triangles, ELC1904). C,D) Strains contained ICE-H1-ΔattR with the following additional alleles: WT (squares, ELC1076), Δskin (open circles, ELC1908), ΔyqaR (open upward triangles, ELC1856), Δskin PyqaR-yqaR (closed circles, ELC1909), and ΔyqaR PyqaR-yqaR (closed upward triangles, ELC1911). A,C) Growth was monitored by OD600 for three hours. Black lines indicate growth of the induced cultures; gray lines (some are difficult to see as they are clustered in the set of strains at the top of the graph) indicate growth of uninduced cultures. Error bars could not always be depicted due to the size of each data point. B,D) The relative CFUs/ml of cultures after three hours of induction of orf17-16 or the indicated element was calculated as the number of CFUs formed by the induced culture, divided by that from the uninduced culture (a value of “1” indicates there is no change in CFUs with induction). In panel B: Significant differences based on P < 0.05 in unpaired two-tailed T-tests include the overexpression of orf17-orf16 compared to: Δskin, ΔyqaR, and ΔyqaR yhdGH::empty. The small differences apparent in panel D are not statistically significant.
Fig 6
Fig 6. Tn916-activated B. subtilis cells exhibit growth defects.
A) The fluorescent reporter system for monitoring Tn916 excision (Tn916-gfp). A circular genetic map of Tn916 is shown, with gray boxes with arrows indicating Tn916 open reading frames, bent arrows representing promoters, and a black box representing the circular attachment site, attTn916. PtetM and Porf7 are predicted to drive expression of orf24-orf13 following excision and circularization of the element (reviewed in [4]). gfpmut2 (shown in green) was inserted upstream of orf24 such that it is expressed following element excision. B,C) Cells containing Tn916-gfp integrated between yufK-yufL (ELC1458) were grown in minimal glucose medium to late exponential phase with 2.5 μg/ml tetracycline to stimulate Tn916 excision. At time = 0 h, cells were spotted on minimal glucose agarose pads containing 2.5 μg/ml tetracycline, 0.1 μM propidium iodide, and 0.035 μg/ml DAPI. Cells were monitored by phase contrast and fluorescence microscopy for three hours. B) A representative set of images from these experiments. GFP (green) was produced in cells in which Tn916 was activated and excised from the chromosome. Propidium iodide (red) indicates dead cells. C) Histogram displaying the relative frequency (percentage) of Tn916-gfp activated cells that underwent the indicated number of cell divisions, compared to non-activated (GFP-negative) cells. DAPI and phase contrast were used for monitoring cell division events.
Fig 7
Fig 7. Effects of yqaR and skin on mating efficiency of Tn916.
The indicated strains were grown to early exponential phase in LB medium. Activation of Tn916 (A) was stimulated by adding 2.5 μg/ml tetracycline for one hour prior to mixing with the indicated recipients. ICEBs1 and ICE-H1 (B, C) were activated by addition of 1 mM IPTG for one hour prior to mixing with recipients. Data are shown from three or more independent experiments. Error bars represent standard error of the mean. Typical conjugation efficiencies in these experiments were: Tn916 ~0.0005%, ICE-H1 ~1%, ICEBs1 ~1.5%. A) Tn916 donors: WT (CMJ253), ΔyqaR (ELC1851), Δskin (ELC1846), ΔyqaR PyqaR-yqaR (ELC1922), Δskin PyqaR-yqaR (ELC1923) were mixed recipients: yqaR+ (ELC301) or ΔyqaR (ELC1854). Conjugation efficiencies (the number of transconjugants produced divided by the number of donors applied to mating) were normalized to those calculated for WT Tn916 donors mated into yqaR+ recipients, which were completed in parallel for each experimental replicate. The mating efficiencies of Tn916 from wild-type, ΔyqaR PyqaR-yqaR, and Δskin PyqaR-yqaR donors were significantly different than those from ΔyqaR and Δskin donors based on P < 0.05 in ratio paired two-tailed T-tests. B,C) Indicated donors were mixed with yqaR+ (ELC301) recipients. (B) donors were ICE-H1 (ELC1213) or ICE-H1 ΔyqaR (ELC1843). (C) donors were ICEBs1 (JMA168), or ICEBs1 ΔyqaR (ELC1844). Conjugation efficiencies of ΔyqaR donors were normalized to that of the yqaR+ donor in experiments conducted in parallel. The difference in mating efficiency of ICE-H1 (panel B) from the ΔyqaR mutant compared to wild type was consistently about 2-fold, although this was not statically significant (P = 0.068) based on comparison in a ratio-pair two-tailed T-test. There was no significant difference comparing data from the two strains in panel C.
Fig 8
Fig 8. Activation of Tn916 causes growth arrest and cell death in E. faecalis.
Two separate isolates of E. faecalis containing Tn916-gfp were used to monitor effects of Tn916 activation. E. faecalis strains ELC1531 and ELC1529 have one and two copies of Tn916-gfp, respectively (see Materials and Methods). Cells were grown in a rich M9 medium (Methods) to late exponential phase with 2.5 μg/ml tetracycline to stimulate Tn916 excision. At time = 0 h, cells were spotted on M9 medium agarose pads containing 2.5 μg/ml tetracycline, 0.1 μM propidium iodide, and 0.5 μg/ml DAPI. Cells were monitored by phase contrast and fluorescence microscopy for two hours. A) A representative set of images monitoring ELC1531 cells with an activated copy of Tn916-gfp (GFP-positive). Similar results were observed with ELC1529. The black arrow in the final frame indicates a PI-stained, GFP-positive cell (appears reddish-yellow). B,C) Histograms displaying the relative frequency (percentage) of Tn916-gfp activated (GFP-positive) cells that underwent the indicated number of cell divisions, compared to non-activated (GFP-negative) cells for each isolate. Sixty-six activated (GFP-positive) and 66 non-activated (GFP-negative) cells for ELC1531 and 45 of each for ELC1529 were monitored. D) The frequency of cells that stained with PI (indicating cell death) or had a daughter cell become PI-positive was determined for both activated and non-activated cells during the 2-hour time lapse.

References

    1. Bellanger X, Payot S, Leblond-Bourget N, Guédon G. Conjugative and mobilizable genomic islands in bacteria: evolution and diversity. FEMS Microbiol Rev. 2014;38: 720–760. doi: 10.1111/1574-6976.12058 - DOI - PubMed
    1. Delavat F, Miyazaki R, Carraro N, Pradervand N, Meer VD, Roelof J. The hidden life of integrative and conjugative elements. FEMS Microbiol Rev. 2017;41: 512–537. doi: 10.1093/femsre/fux008 - DOI - PMC - PubMed
    1. Johnson CM, Grossman AD. Integrative and Conjugative Elements (ICEs): What They Do and How They Work. Annu Rev Genet. 2015;49: 577–601. doi: 10.1146/annurev-genet-112414-055018 - DOI - PMC - PubMed
    1. Roberts AP, Mullany P. A modular master on the move: the Tn916 family of mobile genetic elements. Trends Microbiol. 2009;17: 251–258. doi: 10.1016/j.tim.2009.03.002 - DOI - PubMed
    1. Wozniak RAF, Waldor MK. Integrative and conjugative elements: mosaic mobile genetic elements enabling dynamic lateral gene flow. Nat Rev Microbiol. 2010;8: 552–563. doi: 10.1038/nrmicro2382 - DOI - PubMed

Publication types

LinkOut - more resources