. 2022 Nov 8;119(45):e2214900119.
doi: 10.1073/pnas.2214900119. Epub 2022 Oct 24.

Ornithine decarboxylase supports ILC3 responses in infectious and autoimmune colitis through positive regulation of IL-22 transcription

Affiliations

Ornithine decarboxylase supports ILC3 responses in infectious and autoimmune colitis through positive regulation of IL-22 transcription

Vincent Peng et al. Proc Natl Acad Sci U S A. .

Abstract

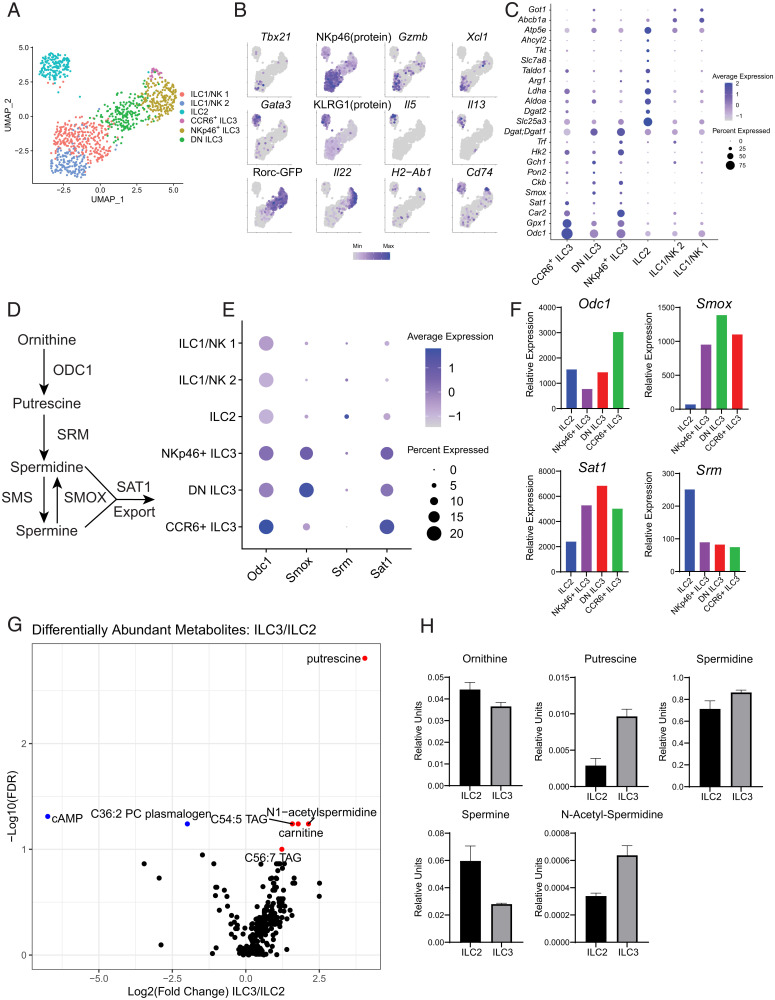
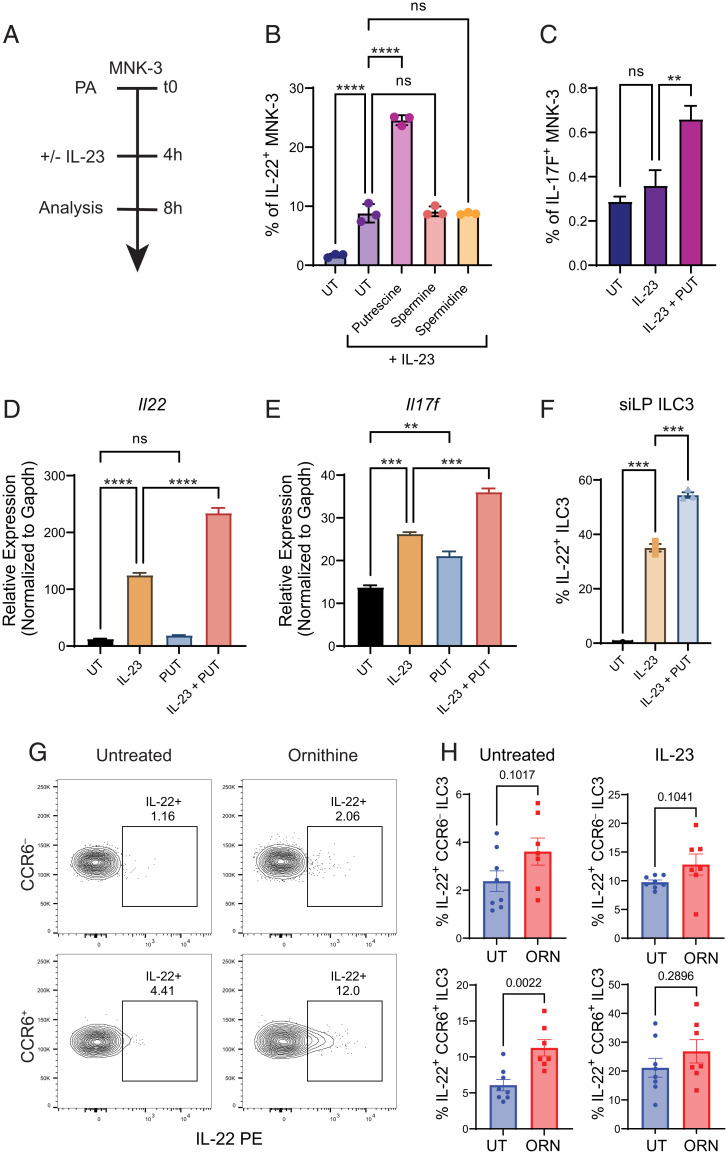
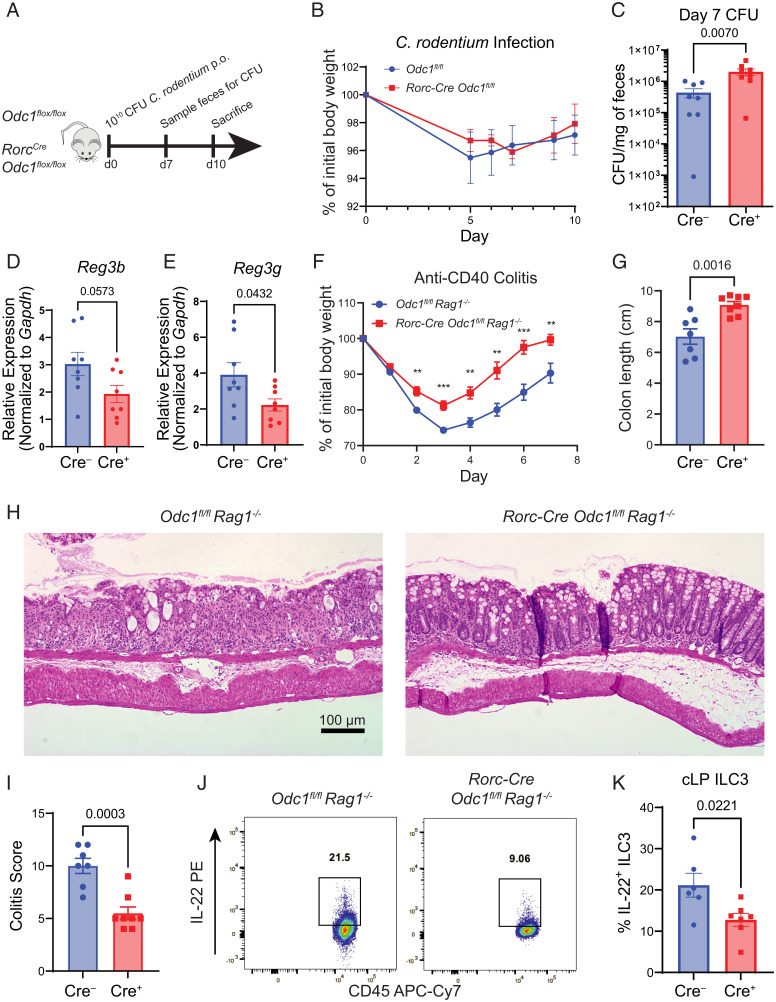
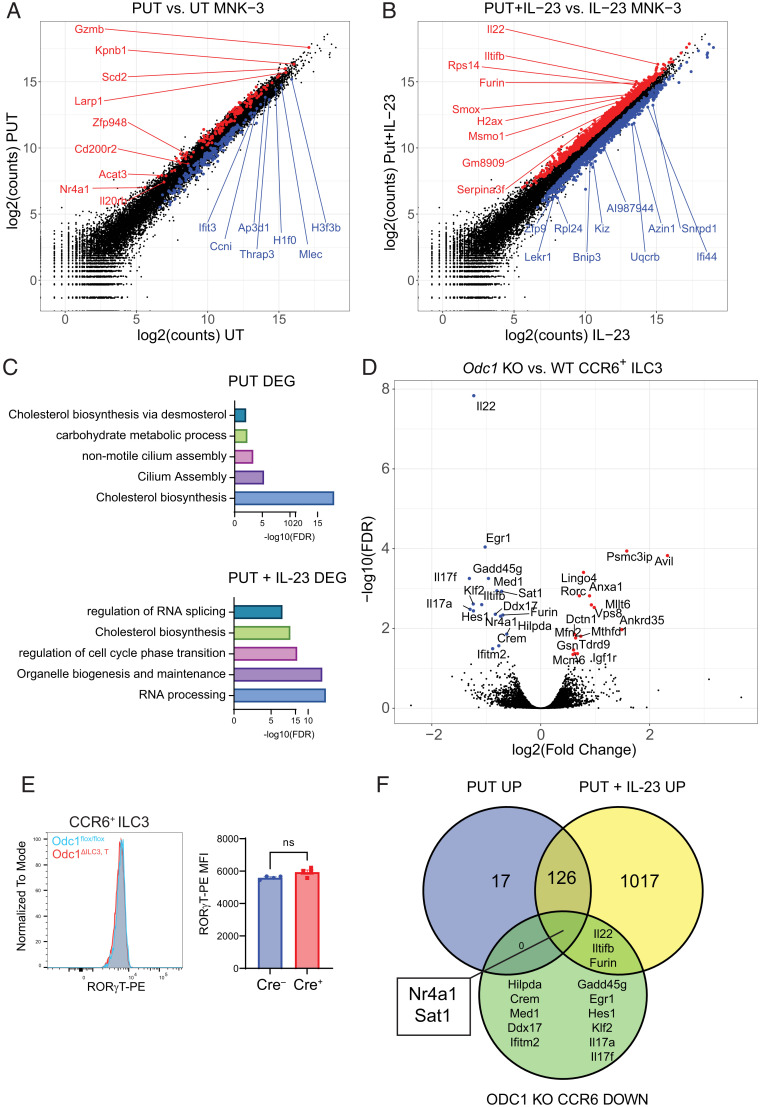
Group 3 innate lymphoid cells (ILC3s) are RORγT+ lymphocytes that are predominately enriched in mucosal tissues and produce IL-22 and IL-17A. They are the innate counterparts of Th17 cells. While Th17 lymphocytes utilize unique metabolic pathways in their differentiation program, it is unknown whether ILC3s make similar metabolic adaptations. We employed single-cell RNA sequencing and metabolomic profiling of intestinal ILC subsets to identify an enrichment of polyamine biosynthesis in ILC3s, converging on the rate-limiting enzyme ornithine decarboxylase (ODC1). In vitro and in vivo studies demonstrated that exogenous supplementation with the polyamine putrescine or its biosynthetic substrate, ornithine, enhanced ILC3 production of IL-22. Conditional deletion of ODC1 in ILC3s impaired mouse antibacterial defense against Citrobacter rodentium infection, which was associated with a decrease in anti-microbial peptide production by the intestinal epithelium. Furthermore, in a model of anti-CD40 colitis, deficiency of ODC1 in ILC3s markedly reduced the production of IL-22 and severity of inflammatory colitis. We conclude that ILC3-intrinsic polyamine biosynthesis facilitates efficient defense against enteric pathogens as well as exacerbates autoimmune colitis, thus representing an attractive target to modulate ILC3 function in intestinal disease.

Keywords: IL-22; enteritis; innate lymphoid cells; ornithine decarboxylase; polyamines.


Conflict of interest statement

M.C. receives research support from Pfizer. R.J.X. is a cofounder of Celsius Therapeutics. All the other authors have nothing to disclose.

Figures

Fig. 1.
Fig. 1.
scRNA-seq and metabolomics of intestinal ILCs identifies enrichment of polyamine biosynthesis in ILC3s. (A) Uniform manifold approximation and projection (UMAP) of intestinal ILC subsets. (B) Feature plots showing enrichment of marker genes and selected protein/reporter molecules specific to ILC subsets. (C) Dot plot showing enrichment of metabolic enzymes in ILC subsets. (D) Schema showing polyamine biosynthetic and catabolic pathways. (E) Dot plot showing enrichment of enzymes involved in polyamine biosynthesis and catabolism in ILC3 subsets. (F) Bulk RNA-seq profiles of polyamine metabolic genes for ILC2 and ILC3 subsets. Obtained from ImmGen. (G) Volcano plot showing differentially abundant metabolites between ILC2s and ILC3s (n = 4). (H) Targeted validation of polyamine biosynthetic intermediates in ILC2s and ILC3s (n = 2). Results are shown as mean ± SEM.
Fig. 2.
Fig. 2.
Putrescine enhances Il22 transcription by MNK-3 cells and primary ILC3s. (A) Diagram of experimental timeline for in vitro studies. (B) Frequency of IL-22+ MNK-3 cells stimulated with IL-23 in the presence of indicated polyamines (n = 3). (C) Frequency of IL-17F+ MNK-3 cells after stimulation with IL-23 ± putrescine (n = 3). (D, E) Relative expression of Il22 and Il17f in MNK-3 cells under the indicated conditions. (n = 3). (F) Frequency of IL-22+ sorted primary ILC3s after stimulation with IL-23 ± putrescine (n = 3). (G) Representative FACS plots of IL-22+ CCR6 and CCR6+ ILC3s from untreated and ornithine-fed mice. (H) Frequency of IL-22+ CCR6 and CCR6+ ILC3s without and with IL-23 stimulation from untreated and ornithine-fed mice (n = 7 to 8). Data from B, C are representative of 3 independent experiments. Data from DF are representative of two independent experiments. Data from G and H are pooled from two independent experiments. Results are shown as mean ± SEM. P values were calculated using the two-tailed Student’s t test or one-way ANOVA and the Tukey's multiple comparisons test. ns, not significant. **P < 0.01; ***P < 0.001; ****P < 0.0001. PA = polyamines; UT = untreated; PUT = putrescine; ORN = ornithine.
Fig. 3.
Fig. 3.
ILC3-specific deficiency of ODC1 renders mice susceptible to infection with C. rodentium but is protective during anti-CD40–induced colitis. (A) Diagram of experimental timeline for C. rodentium infection. (B) Percentage weight loss during C. rodentium infection (n = 4). (C) Colony-forming unit (CFU) counted from fecal pellets from control and Odc1ΔILC3,T mice on day 7 of C. rodentium infection (n = 8). (D, E) Relative expression of Reg3b and Reg3g from whole distal colon tissue of control and Odc1ΔILC3,T mice on day 10 of C. rodentium infection (n = 8). (F) Percentage weight loss during anti-CD40-induced colitis (n = 7–8). (G) Colon length of control and Odc1ΔILC3 mice on day 7 of anti-CD40-induced colitis (n = 7–8). (H) Representative hematoxylin and eosin (H&E) sections of distal colon on day 7 of anti-CD40–induced colitis. (I) Histologic colitis score of H&E slides of distal colon from control and Odc1ΔILC3 mice on day 7 of anti-CD40–induced colitis (n = 7 to 8). (J) Representative FACS plot of IL-22+ ILC3s from colon lamina propria (cLP) of control and Odc1ΔILC3 mice on day 4 of anti-CD40–induced colitis. (K) Frequency of IL-22+ colonic ILC3s from control and Odc1ΔILC3 mice following stimulation with PMA/Ionomycin for 4 h (n = 6). Data from B is representative of two independent experiments. Data from C–K are pooled from two independent experiments. Results are shown as mean ± SEM. P values for C were calculated using the Mann–Whitney test. All other P values were calculated using two-tailed Student’s t test. **P < 0.01; ***P < 0.001.
Fig. 4.
Fig. 4.
Transcriptomic profile of polyamine-stimulated MNK-3 cells and ODC1-deficient ILC3s implicates polyamine regulation of the transcription factor NR4A1. (A) DEGs between putrescine-treated and untreated MNK-3 cells. (B) DEGs between putrescine and IL-23–treated MNK-3 and IL-23–treated MNK-3 cells. (C) Gene ontology enrichment of DEGs from putrescine vs. untreated MNK-3 and putrescine and IL-23–treated vs. IL-23–treated MNK-3 cells. (D) Volcano plot showing DEGs between ODC1-deficient vs. WT CCR6+ ILC3s. (E) Representative histogram and quantification of RORγT MFI in CCR6+ ILC3s from control and Odc1ΔILC3,T mice (n = 4). Data are representative of two experiments. (F) Venn diagram showing overlap between up-regulated genes from putrescine-treated vs. untreated MNK-3 cells, up-regulated genes from putrescine and IL-23-treated vs. IL-23–treated MNK-3 cells, and down-regulated genes from ODC1-deficient vs. WT CCR6+ ILC3s. Results are shown as mean ± SEM. P values in E calculated by two-tailed Student’s t test. ns = not significant. PUT = putrescine; UT = untreated; KO = knockout; DEG = differentially expressed genes.

References

    1. Vivier E., et al. , Innate lymphoid cells: 10 years on. Cell 174, 1054–1066 (2018). - PubMed
    1. Bando J. K., Colonna M., Innate lymphoid cell function in the context of adaptive immunity. Nat. Immunol. 17, 783–789 (2016). - PMC - PubMed
    1. Klose C. S. N., Artis D., Innate lymphoid cells as regulators of immunity, inflammation and tissue homeostasis. Nat. Immunol. 17, 765–774 (2016). - PubMed
    1. Bando J. K., Liang H.-E., Locksley R. M., Identification and distribution of developing innate lymphoid cells in the fetal mouse intestine. Nat. Immunol. 16, 153–160 (2015). - PMC - PubMed
    1. Constantinides M. G., McDonald B. D., Verhoef P. A., Bendelac A., A committed precursor to innate lymphoid cells. Nature 508, 397–401 (2014). - PMC - PubMed

Publication types