. 2022 Nov;119(44):e2209743119.
doi: 10.1073/pnas.2209743119. Epub 2022 Oct 24.

Genome-wide chromatin accessibility analysis unveils open chromatin convergent evolution during polyploidization in cotton

Affiliations

Genome-wide chromatin accessibility analysis unveils open chromatin convergent evolution during polyploidization in cotton

Jinlei Han et al. Proc Natl Acad Sci U S A. 2022 Nov.

Abstract

Allopolyploidization, resulting in divergent genomes in the same cell, is believed to trigger a "genome shock", leading to broad genetic and epigenetic changes. However, little is understood about chromatin and gene-expression dynamics as underlying driving forces during allopolyploidization. Here, we examined the genome-wide DNase I-hypersensitive site (DHS) and its variations in domesticated allotetraploid cotton (Gossypium hirsutum and Gossypium barbadense, AADD) and its extant AA (Gossypium arboreum) and DD (Gossypium raimondii) progenitors. We observed distinct DHS distributions between G. arboreum and G. raimondii. In contrast, the DHSs of the two subgenomes of G. hirsutum and G. barbadense showed a convergent distribution. This convergent distribution of DHS was also present in the wild allotetraploids Gossypium darwinii and G. hirsutum var. yucatanense, but absent from a resynthesized hybrid of G. arboreum and G. raimondii, suggesting that it may be a common feature in polyploids, and not a consequence of domestication after polyploidization. We revealed that putative cis-regulatory elements (CREs) derived from polyploidization-related DHSs were dominated by several families, including Dof, ERF48, and BPC1. Strikingly, 56.6% of polyploidization-related DHSs were derived from transposable elements (TEs). Moreover, we observed positive correlations between DHS accessibility and the histone marks H3K4me3, H3K27me3, H3K36me3, H3K27ac, and H3K9ac, indicating that coordinated interplay among histone modifications, TEs, and CREs drives the DHS landscape dynamics under polyploidization. Collectively, these findings advance our understanding of the regulatory architecture in plants and underscore the complexity of regulome evolution during polyploidization.

Keywords: chromatin accessibility; cotton; genome evolution; histone modification; polyploidization.


Conflict of interest statement

The authors declare no competing interest.

Figures

Fig. 1.
Fig. 1.
Identification of DHSs in the cotton genome. (A) Schematic model of the evolutionary history of diploid and allotetraploid cotton. (B) Genomic tracks illustrating gene-expression (RNA-seq) and chromatin-accessibility (DNase-seq) profiles across a syntenic region between Gr and GhDT. Orthologous genes are connected by dotted lines. The DNA sequence of each Gr DHS was searched in GhDT, and the homologous region is indicated by gray shading. (C) Chromatin accessibility around genes in different cotton species. Genes are ordered by expression (highest to lowest). Expressed genes with FPKM values greater than 0.1 were equally divided into three groups based on their expression levels, ranging from high expression (Top) to low expression (Bottom). Metaplots above each heatmap are derived from genes binned by expression levels: top, middle, bottom, and not expressed (FPKM < 0.1). (D) Overlap assays between double-hit and end-capture DNase-seq peaks.
Fig. 2.
Fig. 2.
Genomic distribution of DHSs in different cotton species. (A) The proportion of DHSs that are categorized as genic, proximal, and distal within different cotton species. The number of DHSs for each cotton accession is indicated. The fold change (high value/low value) of DHS proportions between the A genome and D genome in each genome region is given at the bottom. (B) DHS number comparison between homeologous genes. (C) Statistics of homeologous genes and expression differences. To compare the expression levels of homeologous genes, FPKM values were calculated. The gene number was calculated as the difference in FPKM value as follows: 0 to 1, 1 to 5, 5 to 10, 10 to 20, 20 to 50, 50 to 100, and >100.
Fig. 3.
Fig. 3.
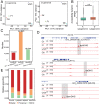
Comparison of DHSs in diploid progenitors and their descendent genomes in tetraploid cotton. (A) PCA plots of DNase-seq data. (B) Comparison of accessibility variation of DHSs between the A subgenome and the D subgenome. The box plot shows the distributions of the dynamic ranges [log10(max-min)] of accessibility levels for DHSs in different subgenomes. The accessibility level was measured by quantifying the DNase-seq reads within each DHS and normalizing by per million mapped reads. The Wilcoxon test was used to analyze significance. **P < 0.01. (C) The numbers of hybDHSs, deDHSs, and domDHSs. (D) Representative examples of hybDHSs (Top), deDHSs (Middle), and domDHSs (Bottom). The locations of the DHSs are shaded. (E) The proportions of genic, proximal, and distal DHSs within each group of hybDHSs, deDHSs, and domDHSs. The results calculated from all DHSs were used as the control.
Fig. 4.
Fig. 4.
Enrichment analysis of DHS-derived TF motifs. (A) Venn diagram showing the overlap of TF motifs identified in hybDHSs, deDHSs, and domDHSs. (B) Ranking of motifs enriched in hybDHSs, deDHSs, and domDHSs. TFs are indicated by colored dots. The E value of each motif was estimated with AME software. (C) Diagrams showing examples of motifs identified in a specific or all groups of hybDHSs, deDHSs, and domDHSs.
Fig. 5.
Fig. 5.
The dynamics of DHS-associated histone modification during polyploidization in cotton. Histone modification of polyploidization-induced (A) or polyploidization-repressed (B) DHSs. Normalized ChIP-seq signals (RPKM) are shown (y axis).
Fig. 6.
Fig. 6.
The correlation of TEs and DHSs in cotton. (A) Proportion of TE-derived DHSs in relation to nbDHSs. (B) Expression levels of genes associated with different types of DHSs. “Without DHS” represents genes without DHSs. “TE-nbDHS” represents genes associated with TE-derived nbDHSs. “Non-TE-DHS” represents genes associated with only non-TE–DHSs. The Wilcoxon test was used to analyze significance. **P < 0.01. (C) Proportion of genes with a 1:1 correspondence between Ga and GhAT or between Gr and GhDT. “TE-nbDHS” represents genes associated with TE-derived nbDHSs. (D) GO enrichment and KEGG pathways analyses of genes associated with TE-nbDHSs. The top 10 GO biological processes terms and KEGG pathways are indicated. (E) Ranking of motifs enriched in TE-nbDHSs. The colored spots represent different TF families. The E value of each motif was estimated with AME software. (F) A representative example, i.e., GH_D13G2387, a gene that shows up-regulated expression in Gh and is associated with TE-nbDHSs. The bHLH recognition sequence AACAACTTGCC (purple) was identified in the upstream TE-nbDHS. The locations of DHSs are shaded.

References

    1. Van de Peer Y., Mizrachi E., Marchal K., The evolutionary significance of polyploidy. Nat. Rev. Genet. 18, 411–424 (2017). - PubMed
    1. Wendel J. F., Jackson S. A., Meyers B. C., Wing R. A., Evolution of plant genome architecture. Genome Biol. 17, 37 (2016). - PMC - PubMed
    1. Chen Z. J., Genetic and epigenetic mechanisms for gene expression and phenotypic variation in plant polyploids. Annu. Rev. Plant Biol. 58, 377–406 (2007). - PMC - PubMed
    1. Stebbins G. L. Jr., Types of polyploids; their classification and significance. Adv. Genet. 1, 403–429 (1947). - PubMed
    1. Madlung A., Wendel J. F., Genetic and epigenetic aspects of polyploid evolution in plants. Cytogenet. Genome Res. 140, 270–285 (2013). - PubMed

Publication types

LinkOut - more resources