. 2022 Nov;119(44):e2215921119.
doi: 10.1073/pnas.2215921119. Epub 2022 Oct 24.

GABA signaling enforces intestinal germinal center B cell differentiation

Affiliations

GABA signaling enforces intestinal germinal center B cell differentiation

Yuexia Liao et al. Proc Natl Acad Sci U S A. 2022 Nov.

Abstract

Recent compelling results indicate possible links between neurotransmitters, intestinal mucosal IgA+ B cell responses, and immunoglobulin A nephropathy (IgAN) pathogenesis. Here, we demonstrated that γ-amino butyric acid (GABA) transporter-2 (GAT-2) deficiency induces intestinal germinal center (GC) B cell differentiation and worsens the symptoms of IgAN in a mouse model. Mechanistically, GAT-2 deficiency enhances GC B cell differentiation through activation of GABA-mammalian target of rapamycin complex 1 (mTORC1) signaling. In addition, IgAN patients have lower GAT-2 expression but higher activation of mTORC1 in blood B cells, and both are correlated with kidney function in IgAN patients. Collectively, this study describes GABA signaling-mediated intestinal mucosal immunity as a previously unstudied pathogenesis mechanism of IgAN and challenges the current paradigms of IgAN.

Keywords: B cells; GABA; IgA; IgAN; germinal center.


Conflict of interest statement

The authors declare no competing interest.

Figures

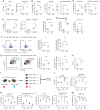
Fig. 1.
Fig. 1.
GAT-2 deficiency promotes IgA+ B cells in mouse intestine. (A) Flow cytometry analysis of IgMIgD cells and IgM+IgD+ cells in the ileum. Cells were pregated by CD45+B220+. Frequencies of IgMIgD cells were analyzed by Mann–Whitney U test and are represented as means ± SD. (B) Flow cytometry analysis of GC B cells (CD95+GL7+) in the ileum. Cells were pregated by CD45+B220+. (C) Flow cytometry analysis of B220IgA+ and B220+IgA+ cells in the ileum. Cells were pregated by CD45+. (D) Flow cytometry analysis of CD95+GL7+ cells in the ileum. Cells were pregated by CD45+B220+IgA+. (E) Immunofluorescence analysis of GC B cells in the GCs of PPs (n = 3). (F) Flow cytometry analysis of IgMIgD cells and IgM+IgD+ cells in the colon. Cells were pregated by CD45+B220+. Frequencies of IgM+IgD+ cells were analyzed by Mann–Whitney U test and are represented as means ± SD. (G) Flow cytometry analysis of GC B cells (CD95+GL7+) in the colon. Cells were pregated by CD45+B220+. (H) Flow cytometry analysis of B220IgA+ and B220+IgA+ cells in the colon. Cells were pregated by CD45+. (I) Flow cytometry analysis of CD95+GL7+ cells in the colon. Cells were pregated by CD45+B220+IgA+. Data were analyzed by unpaired t test and are represented as means ± SD unless otherwise indicated; *P < 0.05, **P < 0.01, ***P < 0.001, and ****P < 0.0001; ns, not significant. Data are pooled from two independent experiments with n = 5 to 6 mice (AD, E, and FI).
Fig. 2.
Fig. 2.
GAT-2 deficiency promotes IgA+ B cells in mouse intestinal PPs. (A) Flow cytometry analysis of B220+ cells in the PPs. Cells were pregated by CD45+. (B) Flow cytometry analysis of IgMIgD cells and IgM+IgD+ cells in the PPs. Cells were pregated by CD45+B220+. (C) Flow cytometry analysis of GC B cells in the PPs. Cells were pregated by CD45+B220+. (D) Flow cytometry analysis of B220IgA+, B220+IgA+, and B220+IgA+CD95+GL7+ cells in the PPs. Cells were pregated by CD45+. (E) Flow cytometry analysis of IgA+ B cells and GC B cells in the ileum (PPs removed). Cells were pregated by CD45+B220+. (F) Flow cytometry analysis of Tfr cells (CD25+CD127) in the PPs. Cells were pregated by CD45+CD4+CD185+. (G) Flow cytometry analysis of Tfh cells (CD185+CD279+) in the PPs. Cells were pregated by CD45+CD4+CD127. (H) The ratio of Tfh to Tfr cells in the ileal PPs based on the data from E and F. (I) Flowchart for establishment of SAP GAT-2–DKO mice for JM. F1 offspring of GAT2+/−SAP+/− hybrid mice were identified by genotype, and GAT2+/+SAP+/+ (WT), GAT2−/−SAP+/+ (KO), and GAT2−/−SAP−/− (DKO) mouse PP samples were collected for flow cytometry analysis. This figure was created using BioRender.com. (J) Flow cytometry analysis of B220+. Cells were pregated by CD45+. (K) Flow cytometry analysis of GC B cells. Cells were pregated by CD45+B220+. (L) Flow cytometry analysis of IgA+ B cells. Cells were pregated by CD45+B220+. (M) Flow cytometry analysis of CD95+GL7+ cells. Cells were pregated by CD45+B220+IgA+. Data were analyzed by unpaired t test and are represented as means ± SD; *P < 0.05, **P < 0.01, ***P < 0.001, and ****P < 0.0001; ns, not significant. Data are pooled from two independent experiments with n = 5 to 6 mice (AM).
Fig. 3.
Fig. 3.
GAT-2 deficiency promotes GC B cell differentiation through the GABA–mTORC1 axis. (A) Flow cytometry analysis of GC B cells (CD95+GL7+). Cells were pregated by CD45+B220+. Naive T cells and naive B cells were isolated from WT and GAT-2–KO mice, and the WT naive B cells and WT naive T cells, WT naive B cells and GAT-2–KO naive T cells, GAT-2–KO naive B cells and WT naive T cells, GAT-2–KO naive B cells and GAT-2–KO naive T cells were cocultured in B cell differentiation medium (containing Opti-MEM with anti-CD3 and anti-IgM μ-chain) for 72 h, respectively. Data are representative of two separate experiments with n = 4 to 6 replicates for each experiment. (B) GABA concentration in the supernatants of GC B cells was assessed by LC-MS (n = 6). (C) Protein abundance of GABAAR and GABABR in B cells (n = 3). (D) Immunoblotting analysis of protein abundance of mTOR, phospho-mTOR (p-mTOR), S6K, p-S6K, 4EBP1, and p-4EBP1 in B cells (n = 3). (E) Flow cytometry analysis of p-mTOR abundance in GC B cells (n = 5 to 6). Cells were pregated by B220+CD95+GL7+. (F) Flow cytometry analysis of p-S6 abundance in in vivo GC B cells of mouse PPs (n = 6). Cells were pregated by B220+CD95+GL7+. (G) Flow cytometry analysis of GC B cells after GABA supplementation. Figure I was created using BioRender.com. Cells were pregated by B220+. Data are representative of two separate experiments with n = 6 to 8 replicates for each experiment. (H and I) Flow cytometry analysis of p-mTOR and p-S6 abundance in GC B cells after GABA supplementation. Data are representative of two separate experiments with n = 4 to 5 replicates for each experiment. (JL) Flow cytometry analysis of the percentage of GC B cells (J) and abundance of p-mTOR (K) and p-S6 (L) in GC B cells after GABAR inhibitor (bicuculline and GCP35348) and mTOR inhibitor (rapamycin) treatment. Cells were pregated by B220+. Data are representative of two separate experiments with n = 6 replicates for each experiment. (M) Schematic diagram of in vivo bone marrow transplantation assay. CD45.1 recipient mice were conditioned with busulfan to induce bone marrow immunosuppression, followed by syngeneic bone marrow transplantation from GAT-2–KO or WT CD45.2 donor mice, separately, by tail vein injection. The transplantation ratio was calculated by percentage of CD45.2+ cells in total CD45+ bone marrow cells at 10 d after injection (n = 4). (N) Flow cytometry analysis of GC B cells in the PPs from mice treated as in M. Cells were pregated by CD45+B220+. (O) Flow cytometry analysis of IgA+ cells in the PPs from mice treated as in M. Cells were pregated by CD45+B220+. (P) Flow cytometry analysis of CD95+GL7+ cells in the PPs from mice treated as in M. Cells were pregated by CD45+B220+IgA+. (Q) Schematic diagram of in vivo lymphocyte transplantation assay. This figure was created using BioRender.com. WT naive B cells and WT naive T cells, WT naive B cells and GAT-2–KO naive T cells, GAT-2–KO naive B cells and WT naive T cells, GAT-2–KO naive B cells and GAT-2–KO naive T cells were transferred into the Rag1−/− mice by tail vein injection, respectively, and CD95+GL7+ cells were analyzed at day 14 (n = 3 to 4); i.v., intravenous. (R and S) Flow cytometry analysis of GC B cells in the spleen (R) and MLN (S) from transferred Rag1−/− mice. Cells were pregated by CD4+B220+. (T) Flow cytometry analysis of p-mTOR abundance in CD45+IgA+ cells from transferred mice (n = 3 to 4). Data are represented as mean ± SD. Data between two groups were analyzed by unpaired t test (B, E, F, I, MP, and T). Data in three or more groups were analyzed by one-way ANOVA with Bonferroni posttest (A, G, H, JL, R, and S); *P < 0.05, **P < 0.01, ***P < 0.001, and ****P < 0.0001; ns, not significant.
Fig. 4.
Fig. 4.
GABA participates in IgAN pathogenesis. (A) Schematic diagram of experiment for GABA supplementation in mice. WT mice received GABA-supplemented (0 or 5 mg/mL GABA) water for 2 wk, and the PPs and blood samples were collected for flow cytometry analysis at day 14. (B and C) Flow cytometry analysis of GC B cells (CD95+GL7+) in the PPs (B) and IgA+ cells in PBMCs (C) from mice treated as in A. Cells were pregated by CD45+B220+ (n = 5 to 6). (D) Schematic diagram of the experiment for GABA supplementation in mice. KO mice received GABA-supplemented (0 or 5 mg/mL GABA) water for 2 wk, and the PPs and blood samples were collected for flow cytometry analysis at day 14. (E and F) Flow cytometry analysis of GC B cells (CD95+GL7+) and IgA+ cells in the PPs (E) and IgA+ cells in PBMCs (F) from mice treated as in D. Cells were pregated by CD45+B220+ (n = 5). (G) Schematic diagram of experiment for GABAR inhibition in WT mice. WT mice were given bicuculline (intraperitoneally [i.p.], 7 mg/kg) daily for 4 d and CGP35348 (i.p., 30 mg/kg) at day 1 and day 3. PP and MLN samples were collected at day 5 for flow cytometry analysis of GC B cells (CD95+GL7+) in the PPs and MLNs and p-S6 in GC B cells of PPs. Cells were pregated by CD45+B220+. (H) Schematic diagram of experiment for GABAR inhibition in GAT-2–KO mice. GAT-2–KO mice were given bicuculline (i.p., 7 mg/kg) daily for 4 d and CGP35348 (i.p., 30 mg/kg) at day 1 and day 3. MLN samples were collected at day 5 for flow cytometry analysis of GC B cells (CD95+GL7+) in the PP and MLN, and p-S6 in GC B cells of PPs. Cells were pregated by CD45+B220+. (I) Schematic diagram of experiment for IgAN in mice. The GAT-2–KO mice and WT mice were stimulated by the combined administration of BSA, LPS, and CCl4 for 7 wk to induce IgAN, and the samples were collected at day 49; i.g., intragastric gavage; i.v., intravenous injection; s.c., subcutaneous injection; i.p., intraperitoneal injection. (J) Flow cytometry analysis of IgA+ cells in the blood, PPs, and spleen from WT IgAN and GAT-2–KO IgAN mice treated as in I (n = 6). Cells were pregated by CD45+B220+. (K) Percentage of IgA-coated fecal bacteria in mice treated as I (n = 3 to 6). (L) The pathological differences (periodic acid-schiff (PAS) and the hematoxylin and eosin (H&E) staining) and IgA deposition (immunofluorescence confocal microscopy) in the glomerulus from mice treated as in I. The green plot represents deposited SIgA, and the red arrow describes the profile of the glomerulus (n = 6). (MO) Statistical analysis of kidney PAS staining, HE staining score, and IgA immunofluorescence confocal microscopy. Data are represented as mean ± SD and were analyzed by unpaired t test; *P < 0.05, **P < 0.01, ***P < 0.001, and ****P < 0.0001; ns, not significant. Data were pooled from two independent experiments with n = 5 to 6 replicates in each experiment (B, C, EH, J, K, and MO).
Fig. 5.
Fig. 5.
GAT-2 expression in the B cells of IgAN patients. (A and B) Flow cytometry analysis of number and percentage of lymphocytes in the PBMCs between IgAN patients and healthy controls. (C) Flow cytometry analysis of CD19+ cells in the PBMCs of IgAN patients and healthy controls. Cells were pregated by CD45+. (D) Flow cytometry analysis of IgA+ cells in the PBMCs of IgAN patients and healthy controls. Cells were pregated by CD45+CD19+. (E and F) Flow cytometry analysis of GAT-2 expression in CD45+cells (E) and CD45+CD19+ (F) cells from the PBMCs of IgAN patients and healthy controls. (G) Flow cytometry analysis of p-mTOR in CD45+CD19+ cells from the PBMCs of IgAN patients and healthy controls. (H and I) Correlation analysis of GAT-2 expression (H) and mTOR activation (I) with estimated glomerular filtration rate (eGFR). (J) The graphic summary of this study. GAT-2 deficiency promotes GC B cell differentiation through the GABA–mTORC1 axis, and IgAN patients exhibit lower GAT-2 expression but higher mTORC1 activation in blood B cells. The blood samples were collected from 24 IgAN patients (7 males and 17 females) and 25 healthy controls (11 males and 14 females). Data are represented as mean ± SD. Data were analyzed by unpaired t test (AE) or by Mann–Whitney U test (F and G); *P < 0.05, **P < 0.01, ***P < 0.001, and ****P < 0.0001; ns, not significant.

Similar articles

Cited by

References

    1. Kiryluk K., et al. , Discovery of new risk loci for IgA nephropathy implicates genes involved in immunity against intestinal pathogens. Nat. Genet. 46, 1187–1196 (2014). - PMC - PubMed
    1. Taylor S., et al. , Phosphatidylethanolamine binding protein-4 (PEBP4) is increased in IgA nephropathy and is associated with IgA-positive B-cells in affected kidneys. J. Autoimmun. 105, 102309 (2019). - PubMed
    1. Kiryluk K., Novak J., The genetics and immunobiology of IgA nephropathy. J. Clin. Invest. 124, 2325–2332 (2014). - PMC - PubMed
    1. Floege J., Moura I. C., Daha M. R., New insights into the pathogenesis of IgA nephropathy. Semin. Immunopathol. 36, 431–442 (2014). - PubMed
    1. Magistroni R., D’Agati V. D., Appel G. B., Kiryluk K., New developments in the genetics, pathogenesis, and therapy of IgA nephropathy. Kidney Int. 88, 974–989 (2015). - PMC - PubMed

Publication types

Substances

LinkOut - more resources