

Location-specific strategies for eliminating US national racial-ethnic [Formula: see text] exposure inequality
- PMID: 36279443
- PMCID: PMC9636929
- DOI: 10.1073/pnas.2205548119
Location-specific strategies for eliminating US national racial-ethnic [Formula: see text] exposure inequality
Abstract
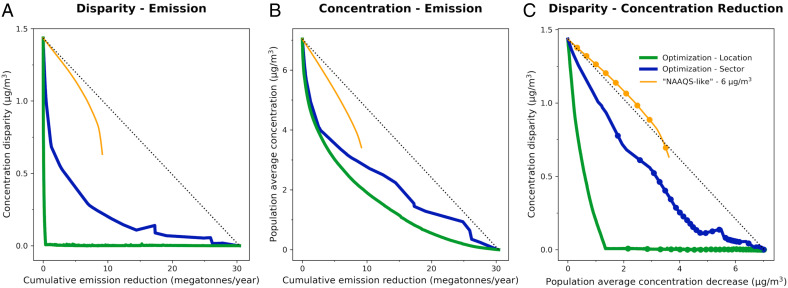
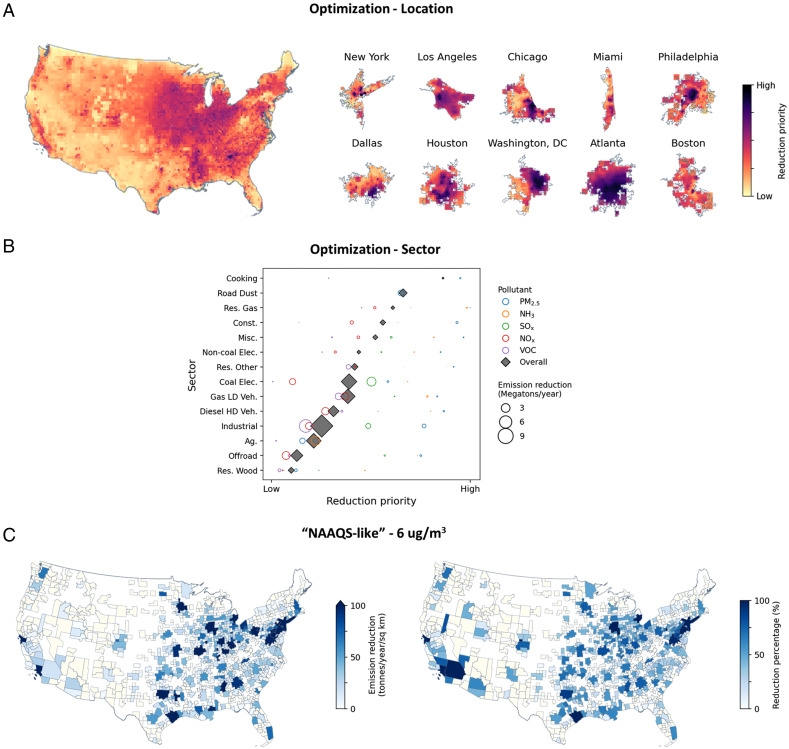
Air pollution levels in the United States have decreased dramatically over the past decades, yet national racial-ethnic exposure disparities persist. For ambient fine particulate matter ([Formula: see text]), we investigate three emission-reduction approaches and compare their optimal ability to address two goals: 1) reduce the overall population average exposure ("overall average") and 2) reduce the difference in the average exposure for the most exposed racial-ethnic group versus for the overall population ("national inequalities"). We show that national inequalities in exposure can be eliminated with minor emission reductions (optimal: ~1% of total emissions) if they target specific locations. In contrast, achieving that outcome using existing regulatory strategies would require eliminating essentially all emissions (if targeting specific economic sectors) or is not possible (if requiring urban regions to meet concentration standards). Lastly, we do not find a trade-off between the two goals (i.e., reducing overall average and reducing national inequalities); rather, the approach that does the best for reducing national inequalities (i.e., location-specific strategies) also does as well as or better than the other two approaches (i.e., sector-specific and meeting concentration standards) for reducing overall averages. Overall, our findings suggest that incorporating location-specific emissions reductions into the US air quality regulatory framework 1) is crucial for eliminating long-standing national average exposure disparities by race-ethnicity and 2) can benefit overall average exposures as much as or more than the sector-specific and concentration-standards approaches.
Keywords: air pollution; air quality regulatory; environmental justice; fine particulate matter.
Conflict of interest statement
The authors declare no competing interest.
Figures
References
-
- U.S. Environmental Protection Agency (EPA), “Benefits and costs of the Clean Air Act 1990–2020, the second prospective study” (Tech. Rep., EPA, Washington, DC, 2011; https://www.epa.gov/clean-air-act-overview/benefits-and-costs-clean-air-...).
-
- Colmer J., Hardman I., Shimshack J., Voorheis J., Disparities in air pollution in the United States. Science 369, 575–578 (2020). - PubMed
MeSH terms
Substances
LinkOut - more resources
Full Text Sources
Medical
Miscellaneous
