. 2022 Nov;119(44):e2203468119.
doi: 10.1073/pnas.2203468119. Epub 2022 Oct 24.

Sea ice fluctuations in the Baffin Bay and the Labrador Sea during glacial abrupt climate changes

Affiliations

Sea ice fluctuations in the Baffin Bay and the Labrador Sea during glacial abrupt climate changes

Federico Scoto et al. Proc Natl Acad Sci U S A. 2022 Nov.

Abstract

Sea ice decline in the North Atlantic and Nordic Seas has been proposed to contribute to the repeated abrupt atmospheric warmings recorded in Greenland ice cores during the last glacial period, known as Dansgaard-Oeschger (D-O) events. However, the understanding of how sea ice changes were coupled with abrupt climate changes during D-O events has remained incomplete due to a lack of suitable high-resolution sea ice proxy records from northwestern North Atlantic regions. Here, we present a subdecadal-scale bromine enrichment (Brenr) record from the NEEM ice core (Northwest Greenland) and sediment core biomarker records to reconstruct the variability of seasonal sea ice in the Baffin Bay and Labrador Sea over a suite of D-O events between 34 and 42 ka. Our results reveal repeated shifts between stable, multiyear sea ice (MYSI) conditions during cold stadials and unstable, seasonal sea ice conditions during warmer interstadials. The shift from stadial to interstadial sea ice conditions occurred rapidly and synchronously with the atmospheric warming over Greenland, while the amplitude of high-frequency sea ice fluctuations increased through interstadials. Our findings suggest that the rapid replacement of widespread MYSI with seasonal sea ice amplified the abrupt climate warming over the course of D-O events and highlight the role of feedbacks associated with late-interstadial seasonal sea ice expansion in driving the North Atlantic ocean-climate system back to stadial conditions.

Keywords: Baffin Bay; Dansgaard-Oeschger events; Labrador Sea; abrupt climate changes; sea ice reconstruction.


Conflict of interest statement

The authors declare no competing interest.

Figures

Fig. 1.
Fig. 1.
Overview of the location sites of ice and marine sediment cores used in this study. Red stars indicate the NEEM and RECAP ice cores locations. Yellow star indicates the marine sediment core GS16-204–23CC. Black lines mark the median sea ice edge position during March (solid), April (dashed), May (dotted) averaged over the period 1981–2010 (https://nsidc.org) (65). The map was produced with QGIS (v3.10.10).
Fig. 2.
Fig. 2.
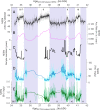
NEEM stable oxygen isotopes, bromine, and sodium variability over D-O events 7–10. (A) Subdecadal δ18O (thin line) with 10-points moving average (thick line) (34); (B) NEEM snow accumulation rate (magenta) (36); (C) temporal resolution of the novel NEEM sodium and bromine data presented in this study; (D) sodium and (E) bromine concentrations (thin lines) with 10-points moving average (thick lines). Gaps of sodium and bromine data longer than 50 y are filled with lower resolution data from a previous study (24). The chronology is the GICC05modelext-NEEM-1 timescale (26). Shaded bars indicate the GS, which are numerated at the Bottom while white bands indicate GI numerated at the Top.
Fig. 3.
Fig. 3.
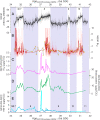
Stable oxygen isotopes and bromine enrichment from NEEM and biomarker proxy records from the Eirik Drift (Labrador Sea). (A) Subdecadal δ18O (thin line) with 10-points moving average (thick line) (34); (B) NEEM bromine enrichment (thin line) with 10-points moving average (thick line) and low-resolution data from a previous study (yellow dots) (24). (C) GS16-204–23CC record of IP25 (magenta), (D) brassicasterol (green), and (E) HBI-III (light blue). Asterisks indicate GS16-204–23MC core-top values for comparison (10, 53). The chronology is the GICC05modelext-NEEM-1timescale (26). Shaded bars indicate the GS, which are numerated at the Bottom while white bands indicate GI numerated at the Top.
Fig. 4.
Fig. 4.
NEEM stable oxygen isotopes and bromine enrichment variability across D-O 7–10. (A) Black segments indicate the estimated structural changes in the δ18O series; (B) NEEM Brenr data plotted on a log2 scale with blown-up views centered on each stadial/interstadial transition plotted on a normal scale; (C) smoothed squared deviations from the mean of Brenr series. The black vertical dashed lines indicate the onset of each D-O event using NEEM δ18O data (SI Appendix, Materials and Methods for more details) while the red vertical dashed lines indicate the maxima of the smoothed squared deviations from the mean of Brenr. The chronology is the GICC05modelext-NEEM-1 timescale (26).
Fig. 5.
Fig. 5.
Sea ice reconstruction of Baffin Bay during D-O cycles 7–10. Looking at NEEM Brenr profile (red curve) between, three distinct stages (A, B, C) can be identified for each D-O cycle: (A) During GS, a widespread perennial or MYSI cover spreads over Arctic Ocean and in the oceanic regions surrounding Greenland including the Baffin Bay and the Labrador Sea. (B) Synchronously or within a decade from the GI onset, the perennial sea ice edge in the Baffin Bay gradually retreats and it is partially substituted by seasonal sea ice conditions. (C) During the mid-to-late phase of the GI (∼0.1–0.6 ka after the onset), highest Brenr values suggest both a significant retreat of the perennial sea ice edge and/or, more likely, a major FYSI expansion southward into the western North Atlantic. In the latter scenario, the increased ice-albedo feedbacks and the enhanced sea ice export in the Labrador Sea (generating a weakening of the AMOC) culminated at or near the onset of the new stadial phase (A).

References

    1. Dansgaard W., et al. , Evidence for general instability of past climate from a 250-kyr ice-core record. Nature 364, 218–220 (1993).
    1. Andersen K. K., et al. ; North Greenland Ice Core Project members, High-resolution record of Northern Hemisphere climate extending into the last interglacial period. Nature 431, 147–151 (2004). - PubMed
    1. Kindler P., et al. , Temperature reconstruction from 10 to 120 kyr b2k from the NGRIP ice core. Clim. Past 10, 887–902 (2014).
    1. Guillevic M., et al. , Spatial gradients of temperature, accumulation and δ18O- ice in Greenland over a series of Dansgaard-Oeschger events. Clim. Past 9, 1029–1051 (2013).
    1. Jensen M. F., et al. , A spatiotemporal reconstruction of sea-surface temperatures in the North Atlantic during Dansgaard-Oeschger events 5-8. Clim. Past 14, 901–922 (2018).

Publication types