. 2022:36:103231.
doi: 10.1016/j.nicl.2022.103231. Epub 2022 Oct 12.

Intrasubject subcortical quantitative referencing to boost MRI sensitivity to Parkinson's disease

Affiliations

Intrasubject subcortical quantitative referencing to boost MRI sensitivity to Parkinson's disease

Laila Khedher et al. Neuroimage Clin. 2022.

Abstract

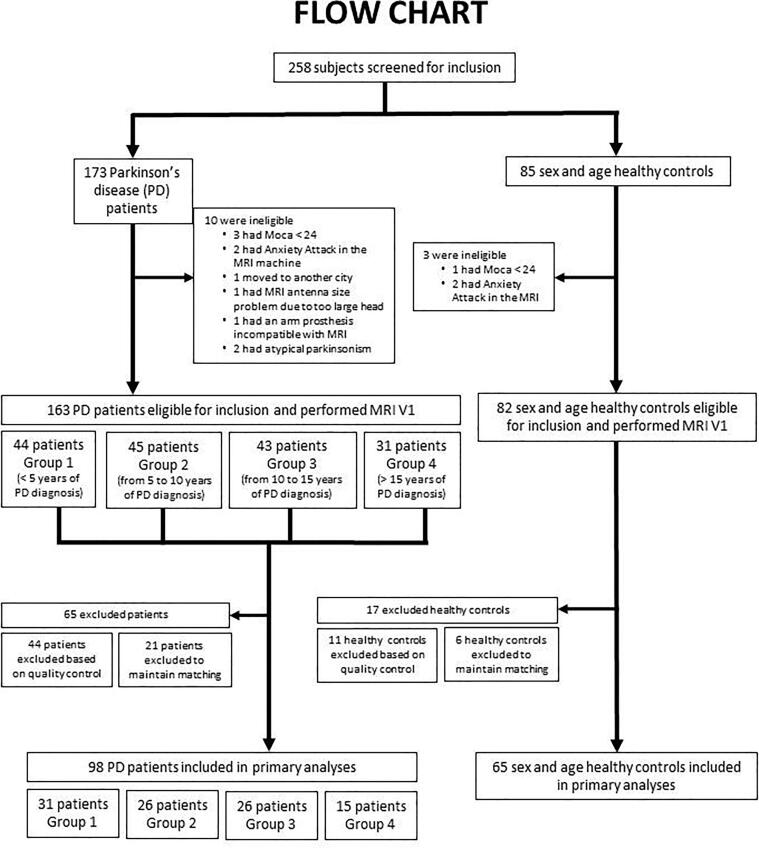
Several postmortem studies have shown iron accumulation in the substantia nigra of Parkinson's disease patients. Iron concentration can be estimated via MRI-R2 mapping. To assess the changes in R2 occurring in Parkinson's disease patients compared to controls, a multicentre transversal study was carried out on a large cohort of Parkinson's disease patients (n = 163) with matched controls (n = 82). In this study, 44 patients and 11 controls were removed due to motion artefacts, 21 patient and 6 controls to preserve matching. Thus, 98 patients and 65 age and sex-matched healthy subjects were selected with enough image quality. The study was conducted on patients with early to late stage Parkinson's disease. The images were acquired at 3Tesla in 12 clinical centres. R2 values were measured in subcortical regions of interest (substantia nigra, red nucleus, striatum, globus pallidus externus and globus pallidus internus) contralateral (dominant side) and ipsilateral (non dominant side) to the most clinically affected hemibody. As the observed inter-subject R2 variability was significantly higher than the disease effect, an original strategy (intrasubject subcortical quantitative referencing, ISQR) was developed using the measurement of R2 in the red nucleus as an intra-subject reference. R2 values significantly increased in Parkinson's disease patients when compared with controls; in the substantia nigra (SN) in the dominant side (D) and in the non dominant side (ND), respectively (PSN_D and PSN_ND < 0.0001). After stratification into four subgroups according to the disease duration, no significant R2 difference was found in all regions of interest when comparing Parkinson's disease subgroups. By applying our ISQR strategy, R2(ISQR) values significantly increased in the substantia nigra (PSN_D and PSN_ND < 0.0001) when comparing all Parkinson's disease patients to controls. R2(ISQR) values in the substantia nigra significantly increased with the disease duration (PSN_D = 0.01; PSN_ND = 0.03) as well as the severity of the disease (Hoehn & Yahr scale <2 and ≥ 2, PSN_D = 0.02). Additionally, correlations between R2(ISQR) and clinical features, mainly related to the severity of the disease, were found. Our results support the use of ISQR to reduce variations not directly related to Parkinson's disease, supporting the concept that ISQR strategy is useful for the evaluation of Parkinson's disease.

Keywords: Iron; Magnetic resonance imaging; Parkinson’s disease; Variability.


Conflict of interest statement

Declaration of Competing Interest The authors declare that they have no known competing financial interests or personal relationships that could have appeared to influence the work reported in this paper.

Figures

Fig. 1
Fig. 1
Flow chart inclusion of study participants. 258 participants (173 patients with Parkinson's disease and 85 age and sex-matched controls) were recruited at baseline. An image quality analysis protocol was established in this study. This protocol allowed us to carry out our current study only on 98 Parkinson’s disease patients (60 males and 38 females) and 65 age and sex-matched healthy subjects (35 males and 30 females). Parkinson’s disease patients were stratified in four groups according to the duration of the disease (Group1 < 5 years; Group2 > 5 and < 10 years; Group3 > 10 and < 15 years and Group4 > 15 years).
Fig. 2
Fig. 2
Forest plot showing the crude effect size ofR2(ISQR)in the substantia nigra for each Parkinson’s disease (PD) subgroup according to the disease duration: G1 (PD < 5 years), G2 (PD > 5 and < 10 years), G3 (PD > 10 and < 15 years) and G4 (PD > 15 years). G1-G2: effect size between G1 and G2, G1-G3: effect size between G1 and G3, G1-G4: effect size between G1 and G4, G2-G3: effect size between G2 and G3, G2-G4 effect size between G2 and G4, G3-G4: effect size between G3 and G4. SN_D = substantia nigra_dominant side of the diease. SN_ND = substantia nigra_ non dominant side of the disease. The results were expressed using Hedge’s effect size. CI = confidence interval. The box represents the effect size and the whiskers the 95 % CI. A significant difference in the effect size of R2ISQR values between Parkinson’s disease subgroups (P < 0.05), as well as when comparing PD patients-G3. vs PD patients-G1 (PSN_D = 0.03, PSN_ND = 0.01) and when comparing PD patients-G4. vs PD patients-G1 (PSN_D < 0.001, PSN_ND = 0.01) was showed.
Fig. 3
Fig. 3
Heatmap of correlations between clinical features,R2values andR2(ISQR)values. The heatmap colors range is red when a significant positive correlation (P < 0.01), is orange when a significant positive correlation (P < 0.05), is dark green when a significant negative correlation (P < 0.01), is light green when a significant negative correlation (P < 0.05) and it is yellow when there is not significant: (A)R2 raw values. (B)R2(ISQR) values. SN_D = substantia nigra_dominant; SN_ND = substantia nigra_non dominant; RN_D = red nucleus_dominant; RN_ND = red nucleus_non dominant; GPe = globus pallidus externus_dominant; GPe = globus pallidus externus_non dominant; GPi_D = globus pallidus internus_dominant; GPi_ND = globus pallidus internus_non dominant; STR_D = striatum_dominant; STR_ND = striatum_non dominant. MoCA = Montreal Cognitive Assessment, MDS-UPDRS = Movement Disorder Society-Unified Parkinson’s Disease Rating Scale, H&Y = Hoehn & Yahr score, S&E = Schwab & England score, FOG-Q = Freezing of Gait Questionnaire, LARS = Lille Apathy Rating Scale, HAM-D = Hamilton Rating Scale for Depression, HAM-A = Hamilton Rating Scale for Anxiety, ASBPD = Ardouin Scale of Behavior in Parkinson's Disease, NMSS = Non-Motor Symptom assessment Scale for Parkinson’s Disease, LEDD = Levodopa Equivalent Daily Dose. (For interpretation of the references to color in this figure legend, the reader is referred to the web version of this article.)
Fig. 4
Fig. 4
Two-dimensional plot based on principal component analysis. (A) Plot represents the relationships between the R2ISQR values of Parkinson’s disease patients and the clinical parameters included in this study. (B) Four distinct profiles of Parkinson’s disease patients according to the disease duration, illustrated by factorial analysis. The length of the arrows indicates the magnitude of the relationship to the R2ISQR and clinical parameters, the first one (noted CompA1) was most related to severity of disease and the second (noted CompA2) to R2ISQR substantia nigra values. Each dot represents one Parkinson’s disease patient. (C) Plot represents the relationships between the R2ISQR values in the dominant side of Parkinson’s disease patients for each region of interest (D) Four distinct profiles of Parkinson’s disease patients according to the disease duration, illustrated by factorial analysis. The length of the arrows indicates the magnitude of the relationship to the R2ISQRwithout clinical parameters. Parkinson’s disease patients were correctly discriminated according to their disease duration, principally due to R2ISQR values in substantia nigra (noted CompB2) whereas CompB1 expressed the magnitude of R2ISQR values whatever the region. Each dot represents one Parkinson’s disease patient. Parkinson’s disease = PD. The red color corresponds to PD patients > 15 years, the orange to PD patients > 10 and < 15 years, the yellow to PD patients > 5 and < 10 years and the green to PD patients < 5 years. (For interpretation of the references to color in this figure legend, the reader is referred to the web version of this article.)

References

    1. Arribarat G.P., De Barros A., Galitzky M., Rascol O., Péran P. Substantia nigra locations of iron-content, free-water and mean diffusivity abnormalities in moderate stage Parkinson's disease. Parkinsonism Relat Disord. 2019;65:146–152. - PubMed
    1. Ashburner J. A fast diffeomorphic image registration algorithm. Neuroimage. 2007;38:95–113. - PubMed
    1. Ashburner J., Friston K. Unified segmentation. Neuroimage. 2005;26(3):839–851. - PubMed
    1. Azuma M., Hirai T., Yamada K., Yamashita S., Ando Y., Tateishi M., al. Lateral asymmetry and spatial difference of iron deposition in the substantia nigra of patients with Parkinson disease measured with quantitative susceptibility mapping. AJNR Am J Neuroradiol. 2016;37:782–788. - PMC - PubMed
    1. Barbosa J.H., Santos A.C., Tumas V., Liu M., Zheng W., Haacke E.M., al. Quantifying brain iron deposition in patients with Parkinson's disease using quantitative susceptibility mapping, R2 and R2. Magn Reson Imaging. 2015;33(5):559–565. - PubMed

Further reading

    1. Wang J., Zhuang Q., Zhu L., Zhu H., Li T., Li R., al. Meta-analysis of brain iron levels of Parkinson’s disease patients determined by postmortem and MRI measurements. Sci Rep. 2016;6:36669. - PMC - PubMed