

Susceptible windows of exposure to fine particulate matter and fetal growth trajectories in the Spanish INMA (INfancia y Medio Ambiente) birth cohort
- PMID: 36279916
- PMCID: PMC9847009
- DOI: 10.1016/j.envres.2022.114628
Susceptible windows of exposure to fine particulate matter and fetal growth trajectories in the Spanish INMA (INfancia y Medio Ambiente) birth cohort
Abstract
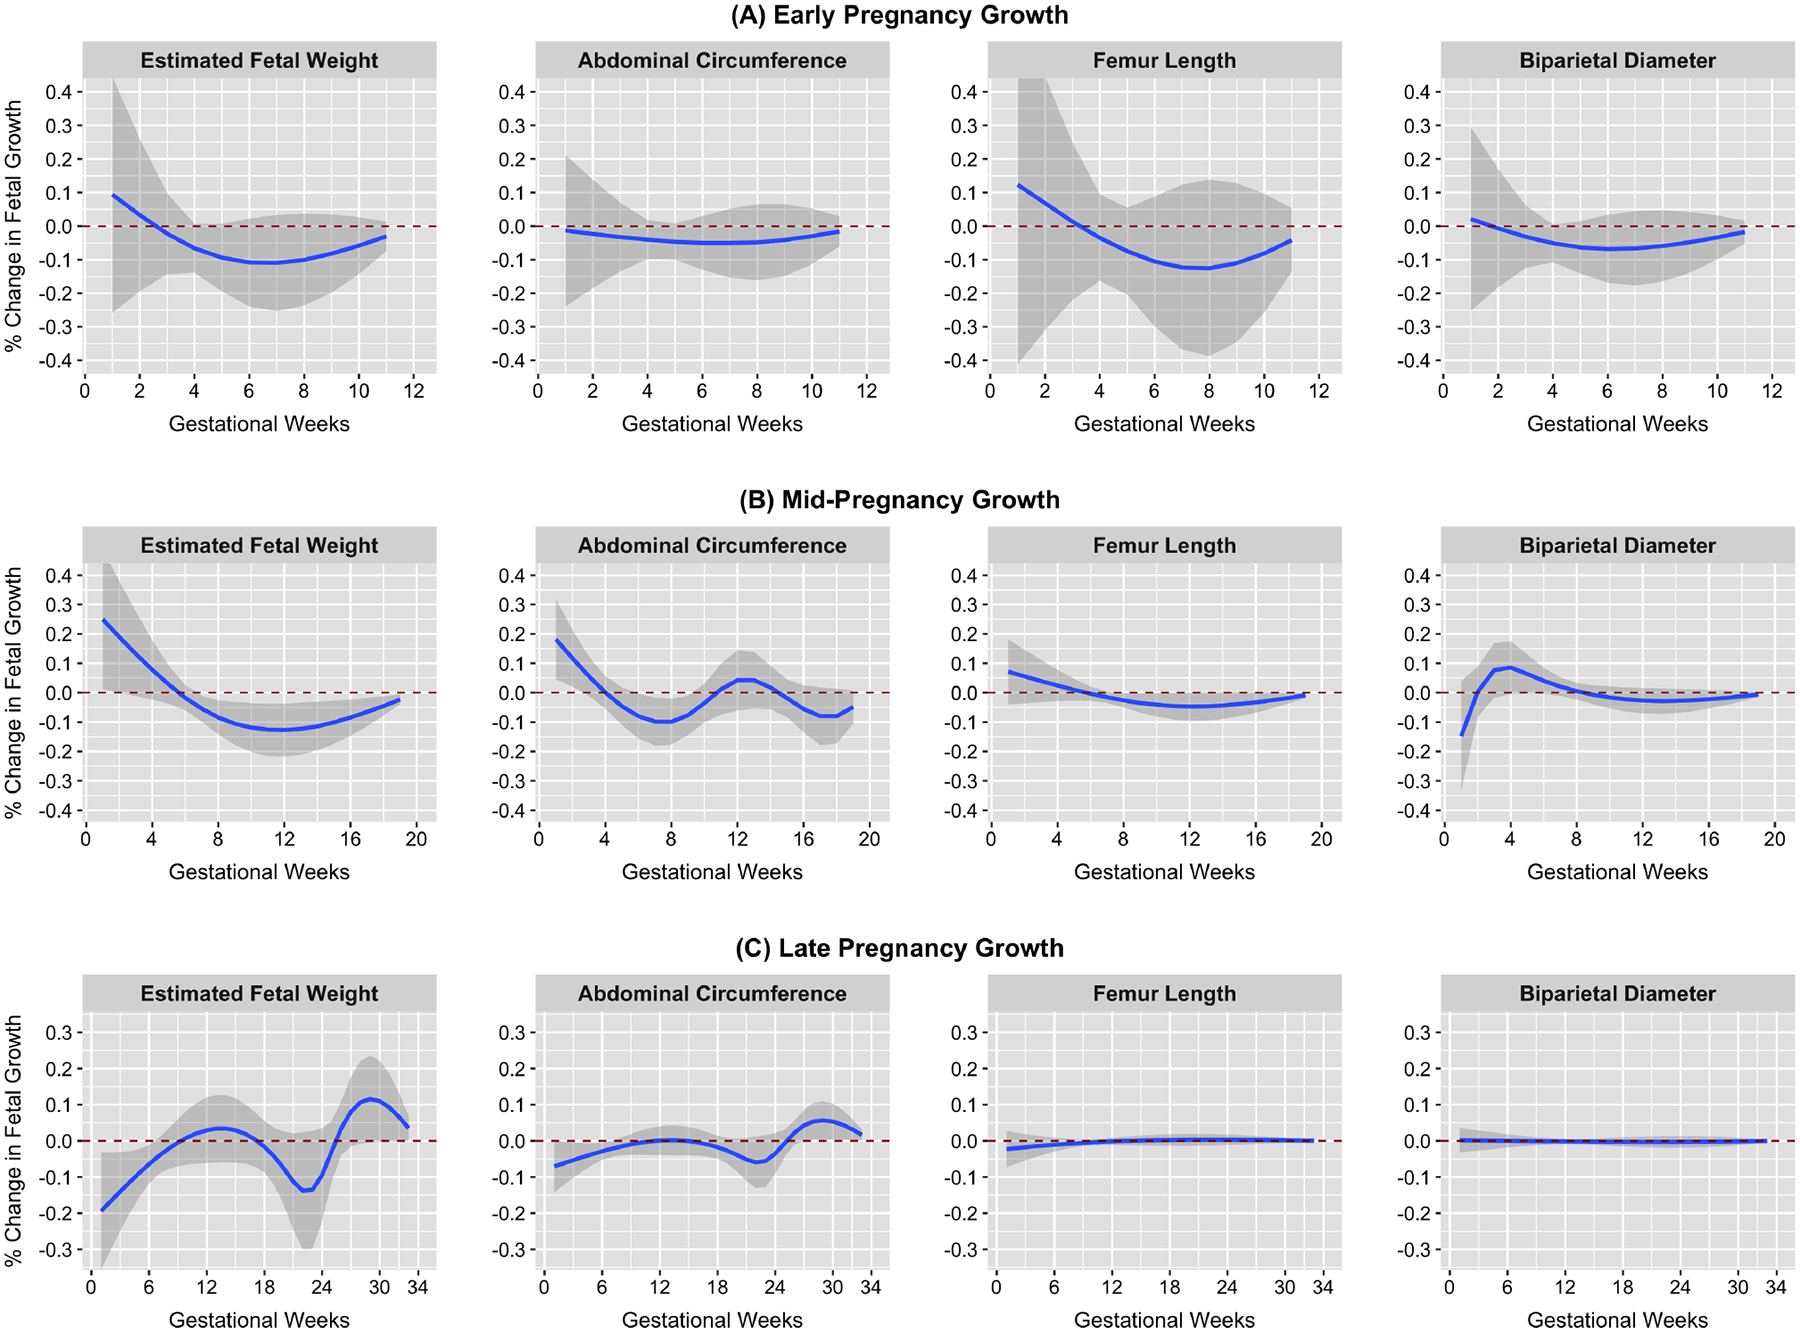
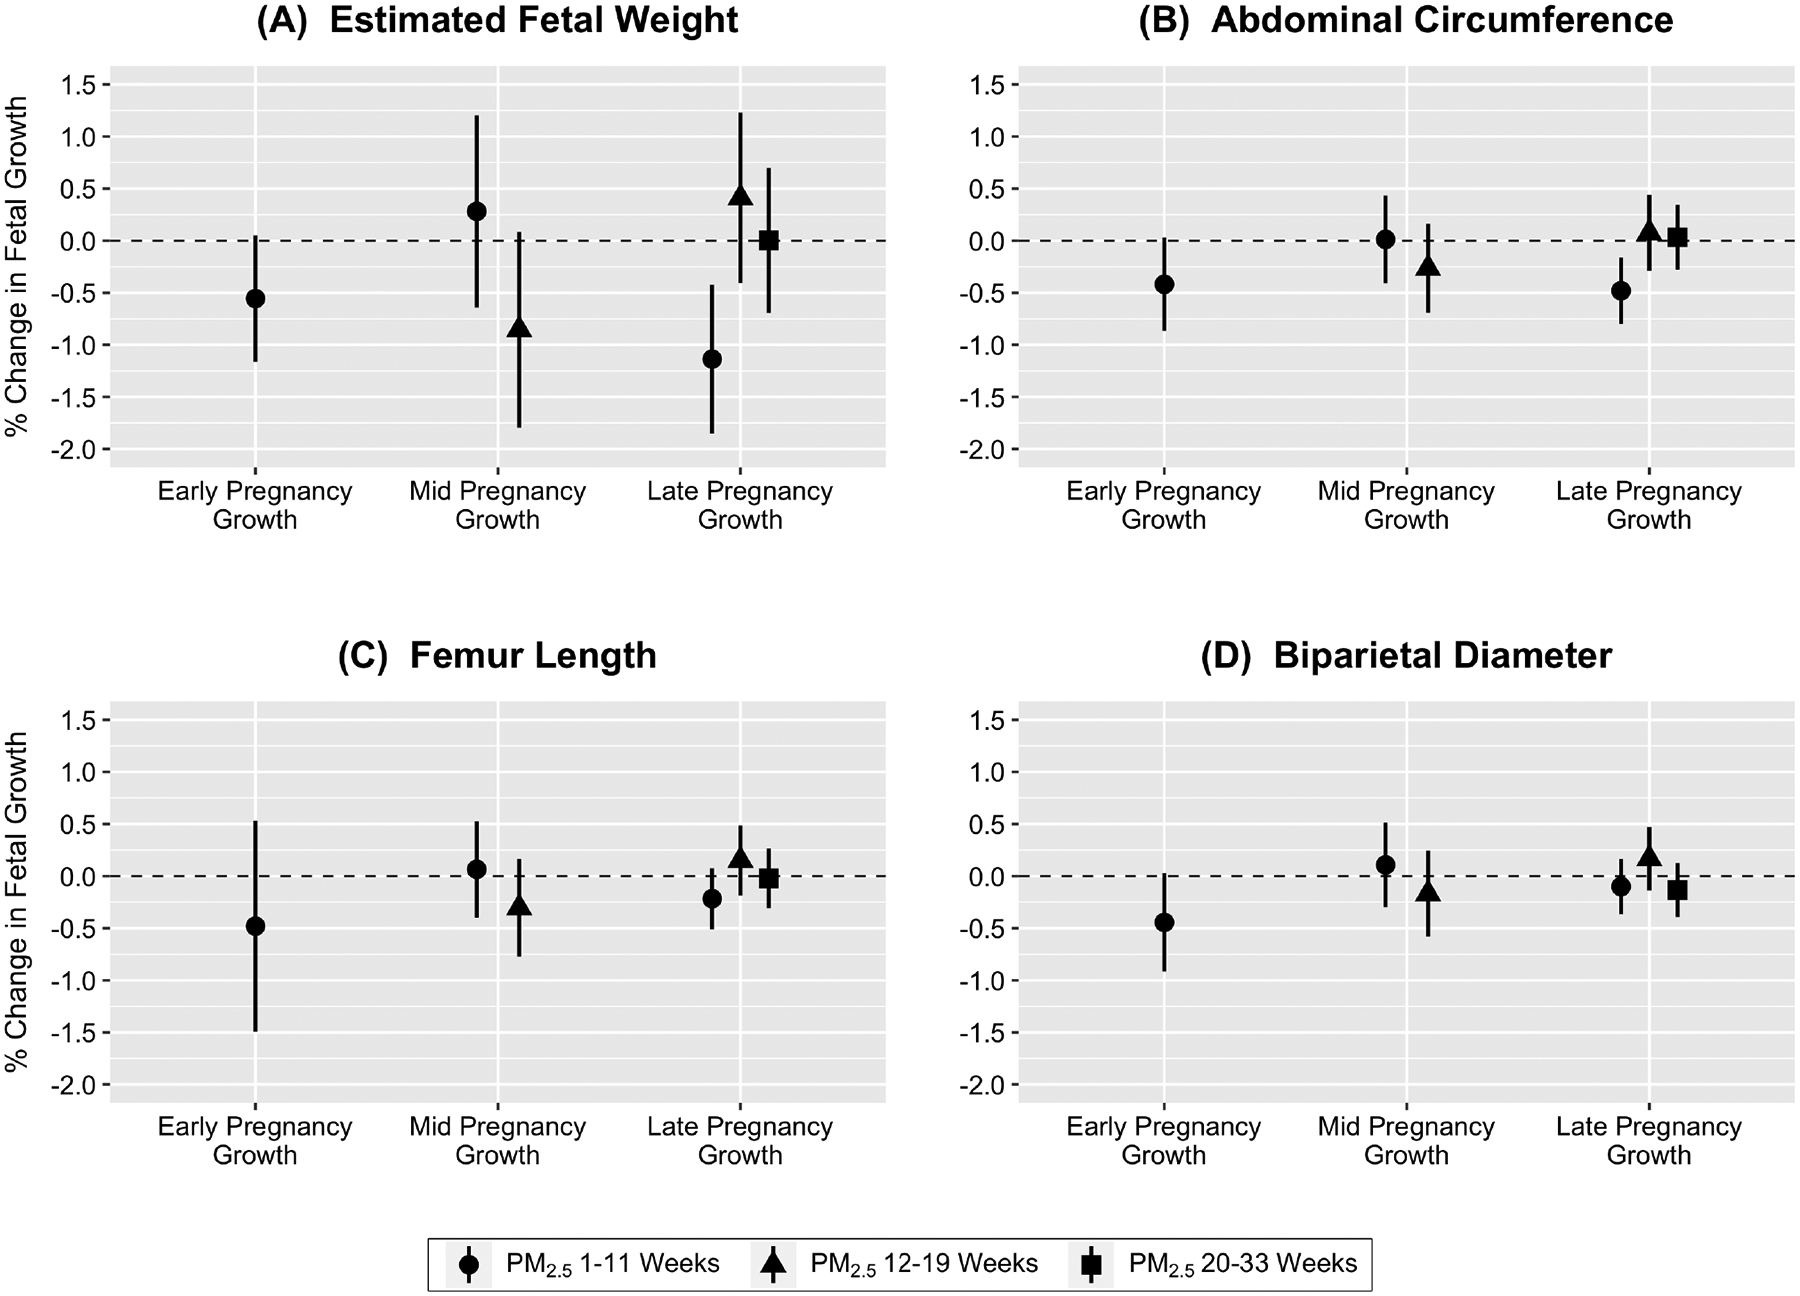
While prior studies report associations between fine particulate matter (PM2.5) exposure and fetal growth, few have explored temporally refined susceptible windows of exposure. We included 2328 women from the Spanish INMA Project from 2003 to 2008. Longitudinal growth curves were constructed for each fetus using ultrasounds from 12, 20, and 34 gestational weeks. Z-scores representing growth trajectories of biparietal diameter, femur length, abdominal circumference (AC), and estimated fetal weight (EFW) during early (0-12 weeks), mid- (12-20 weeks), and late (20-34 weeks) pregnancy were calculated. A spatio-temporal random forest model with back-extrapolation provided weekly PM2.5 exposure estimates for each woman during her pregnancy. Distributed lag non-linear models were implemented within the Bayesian hierarchical framework to identify susceptible windows of exposure for each outcome and cumulative effects [βcum, 95% credible interval (CrI)] were aggregated across adjacent weeks. For comparison, general linear models evaluated associations between PM2.5 averaged across multi-week periods (i.e., weeks 1-11, 12-19, and 20-33) and fetal growth, mutually adjusted for exposure during each period. Results are presented as %change in z-scores per 5 μg/m3 in PM2.5, adjusted for covariates. Weeks 1-6 [βcum = -0.77%, 95%CrI (-1.07%, -0.47%)] were identified as a susceptible window of exposure for reduced late pregnancy EFW while weeks 29-33 were positively associated with this outcome [βcum = 0.42%, 95%CrI (0.20%, 0.64%)]. A similar pattern was observed for AC in late pregnancy. In linear regression models, PM2.5 exposure averaged across weeks 1-11 was associated with reduced late pregnancy EFW and AC; but, positive associations between PM2.5 and EFW or AC trajectories in late pregnancy were not observed. PM2.5 exposures during specific weeks may affect fetal growth differentially across pregnancy and such associations may be missed by averaging exposure across multi-week periods, highlighting the importance of temporally refined exposure estimates when studying the associations of air pollution with fetal growth.
Keywords: Air pollution; Fetal growth; PM(2.5); Susceptible windows.
Copyright © 2022 The Authors. Published by Elsevier Inc. All rights reserved.
Conflict of interest statement
Declaration of competing interest The authors declare that they have no known competing financial interests or personal relationships that could have appeared to influence the work reported in this paper.
Figures
Similar articles
-
Relation of prenatal and postnatal PM2.5 exposure with cognitive and motor function among preschool-aged children.Int J Hyg Environ Health. 2024 Mar;256:114317. doi: 10.1016/j.ijheh.2023.114317. Epub 2024 Jan 3. Int J Hyg Environ Health. 2024. PMID: 38171265 Free PMC article.
-
Susceptible windows of prenatal and postnatal fine particulate matter exposures and attention-deficit hyperactivity disorder symptoms in early childhood.Sci Total Environ. 2024 Feb 20;912:168806. doi: 10.1016/j.scitotenv.2023.168806. Epub 2023 Nov 26. Sci Total Environ. 2024. PMID: 38016567 Free PMC article.
-
Identifying Sensitive Windows of Exposure to NO2 and Fetal Growth Trajectories in a Spanish Birth Cohort.Epidemiology. 2022 May 1;33(3):318-324. doi: 10.1097/EDE.0000000000001468. Epidemiology. 2022. PMID: 35213509 Free PMC article.
-
Ambient air pollution and pregnancy outcomes: A comprehensive review and identification of environmental public health challenges.Environ Res. 2018 Nov;167:144-159. doi: 10.1016/j.envres.2018.07.008. Epub 2018 Jul 5. Environ Res. 2018. PMID: 30014896 Review.
-
Prenatal exposure to air pollution and maternal and fetal thyroid function: a systematic review of the epidemiological evidence.Environ Health. 2024 Sep 27;23(1):78. doi: 10.1186/s12940-024-01116-9. Environ Health. 2024. PMID: 39334320 Free PMC article.
Cited by
-
Relation of prenatal and postnatal PM2.5 exposure with cognitive and motor function among preschool-aged children.Int J Hyg Environ Health. 2024 Mar;256:114317. doi: 10.1016/j.ijheh.2023.114317. Epub 2024 Jan 3. Int J Hyg Environ Health. 2024. PMID: 38171265 Free PMC article.
-
Susceptible windows of prenatal and postnatal fine particulate matter exposures and attention-deficit hyperactivity disorder symptoms in early childhood.Sci Total Environ. 2024 Feb 20;912:168806. doi: 10.1016/j.scitotenv.2023.168806. Epub 2023 Nov 26. Sci Total Environ. 2024. PMID: 38016567 Free PMC article.
-
Effect of Particulate Matter 2.5 on Fetal Growth in Male and Preterm Infants through Oxidative Stress.Antioxidants (Basel). 2023 Oct 26;12(11):1916. doi: 10.3390/antiox12111916. Antioxidants (Basel). 2023. PMID: 38001768 Free PMC article.
References
-
- Adams K, et al., 2015. Particulate matter components, sources, and health: Systematic approaches to testing effects. J Air Waste Manag Assoc. 65, 544–58. - PubMed
-
- Bertin M, et al., 2015. Sex-specific differences in fetal growth in newborns exposed prenatally to traffic-related air pollution in the PELAGIE mother-child cohort (Brittany, France). Environ Res. 142, 680–7. - PubMed
Publication types
MeSH terms
Substances
Grants and funding
LinkOut - more resources
Full Text Sources
Medical
