. 2022 Dec:225:109279.
doi: 10.1016/j.exer.2022.109279. Epub 2022 Oct 22.

Synaptotagmins 1 and 7 in vesicle release from rods of mouse retina

Affiliations

Synaptotagmins 1 and 7 in vesicle release from rods of mouse retina

C S Mesnard et al. Exp Eye Res. 2022 Dec.

Abstract

Synaptotagmins are the primary Ca2+ sensors for synaptic exocytosis. Previous work suggested synaptotagmin-1 (Syt1) mediates evoked vesicle release from cone photoreceptor cells in the vertebrate retina whereas release from rods may involve another sensor in addition to Syt1. We found immunohistochemical evidence for syntaptotagmin-7 (Syt7) in mouse rod terminals and so performed electroretinograms (ERG) and single-cell recordings using mice in which Syt1 and/or Syt7 were conditionally removed from rods and/or cones. Synaptic release was measured in mouse rods by recording presynaptic anion currents activated during glutamate re-uptake and from exocytotic membrane capacitance changes. Deleting Syt1 from rods reduced glutamate release evoked by short depolarizing steps but not long steps whereas deleting Syt7 from rods reduced release evoked by long but not short steps. Deleting both sensors completely abolished depolarization-evoked release from rods. Effects of various intracellular Ca2+ buffers showed that Syt1-mediated release from rods involves vesicles close to ribbon-associated Ca2+ channels whereas Syt7-mediated release evoked by longer steps involves more distant release sites. Spontaneous release from rods was unaffected by eliminating Syt7. While whole animal knockout of Syt7 slightly reduced ERG b-waves and oscillatory potentials, selective elimination of Syt7 from rods had no effect on ERGs. Furthermore, eliminating Syt1 from rods and cones abolished ERG b-waves and additional elimination of Syt7 had no further effect. These results show that while Syt7 contributes to slow non-ribbon release from rods, Syt1 is the principal sensor shaping rod and cone inputs to bipolar cells in response to light flashes.

Keywords: Cones; Electroretinogram; Exocytosis; Mouse; Neuroscience; Retina; Ribbon synapse; Rods.


Figures

Fig. 1.
Fig. 1.
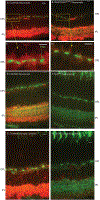
Immunohistochemical results showed the presence of Syt7 in the outer plexiform layer (OPL) and inner plexiform layer (IPL). A) Ribeye protein in synaptic ribbons was labeled with an antibody to CtBP2 (Santa Cruz) and stained with a rhodamine-conjugated secondary antibody (Thermo Fisher, red, left). Syt7 was labeled using the Synaptic Systems antibody along with a FITC-conjugated secondary antibody (BD Biosciences; green, middle). Merged images show overlap of Syt7 with CtBP2 labeling in the OPL and IPL (right). Merged image is overlaid on a bright-field image of the same slice in the panel at the far right. Along with OPL and IPL, layers shown in that image are photoreceptor outer segments (OS), outer nuclear layer (ONL) and inner nuclear layer (INL). The INL is stained by the CtBP2 antibody due to the presence of a shorter, non-Ribeye variant of CtBP2. B. Magnified view of the OPL showing CtBP2 (BD Biosciences) labeled with a FITC-conjugated secondary antibody (BD Biosciences, green) and Syt7 (Synaptic Systems) labeled with rhodamine-conjugated antibody (Thermo Fisher, red). The arrow points to a cone terminal with multiple ribbons in the merged image. C. Another retinal section labeled for CtBP2 (BD Biosciences, green) and Syt7 (Synaptic Systems, red). This image shows that labeling for Syt7 was abolished by pre-incubation with the fusion peptide used for immunization to create the Synaptic Systems antibody. D. OPL labeled with FITC-conjugated peanut agglutinin (PNA; green) and Syt7 antibody (Synaptic Systems) labeled with a rhodamine secondary (Thermo Fisher, red). PNA labels the base of cone terminals and the arrows in the merged image point to two cone terminals that are also labeled by the Syt7 antibody. E. OPL labeled with antibodies to the vesicle protein, SV2 (DSHB, green) and Syt7 (Synaptic Systems, red). Single confocal sections. Scale bar in A: 10 μm. Scale bar in B–E: 5 μm. (For interpretation of the references to colour in this figure legend, the reader is referred to the Web version of this article.)
Fig. 2.
Fig. 2.
A: Schematics showing the wild type locus and floxing design for targeting exon 5 of Syt7. The floxed allele was generated using the Easi-CRISPR method (Quadros et al., 2017) that uses long single-stranded DNA as the repair donor template. The lengths of ssDNA, homology arms, and the distance between the two LoxP sites are shown. B: Genotyping of F0 offspring. Two PCRs, one each for the two LoxP sites (5′ LoxP PCR, 5′ F + 5′ R primers; 3′ LoxP PCR, 3′ F + 3′ R primers) were used to identify targeted mice. The expected sizes of PCR amplicons (wild type or floxed) are shown at the left and right of the gel images. C: PCR-RFLP (Restriction Fragment Length Polymorphism) using EcoRI digestion was used to further confirm the correctly targeted mice. The expected sizes of RFLP fragments (wild type or floxed) are shown at the left and right of the gel images. Agarose gel images of the two sets of genotyping assays (B and C) showed that animals #5 and #11 contained correctly targeted floxed alleles. Animal #6 contained only 5′ LoxP site and animals #8 and 9 may have had deletion of the targeted region. Founders 5 and 11 were bred to establish floxed mice colonies. D: Western blot of whole brain protein shows deletion of a band at the predicted molecular weight of ~45 kDa in a homozygous Syt7KO mouse (Syt7flfl/CMVCre; labeled “CMV”) with no change evident in a heterozygous Syt7fl/CMVCre (“Het”) or Cre-negative Syt7fl/fl (“Fl/Fl”) mouse compared to a control C57Bl6J mouse (“WT”).
Fig. 3.
Fig. 3.
Syt7 labeling in the OPL and IPL of mouse retina. A: Control C57Bl6 mouse retina labeled with Neuromab antibodies to Syt7 and visualized with a rhodamine-conjugated secondary antibody (Thermo Fisher, red). These sections were co-stained with FITC-PNA (Sigma, green) to label cone terminals. FITC-PNA also stains cone inner segments and the IPL. B: Labeling with Syt7 antibodies in a Rod/ConeSyt7CKO mouse retina. Other than labeling of a blood vessel by the secondary antibody, staining in the OPL was largely eliminated by deletion of Syt7 from rods and cones, although bright labeling remained in the IPL as expected. Labeling for Syt7 in the OPL and its absence in Rod/ConeSyt7CKO mouse retina can be seen more readily in the magnified image in panels C and D, respectively. Brightness was increased in the red channel equally in panels C and D to enhance the visibility of Syt7 labeling. E: Control retina labeled with Neuromab Syt7 antibodies and FITC-PNA. F: Labeling for Syt7 was abolished from both the OPL and IPL in a Syt7KO mouse (CMVSyt7KO). G: Retina of a control C57Bl6 mouse labeled with Synaptic Systems Syt7 antibody along with FITC-PNA to label cone terminals. H: Labeling for Syt7 with the Synaptic Systems antibody was also abolished from both the OPL and IPL in a Syt7KO mouse (CMVSyt7KO). Single confocal sections. Scale bars: 5 μm. (For interpretation of the references to colour in this figure legend, the reader is referred to the Web version of this article.)
Fig. 4.
Fig. 4.
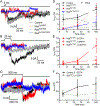
Effects of intracellular Ca2+ buffering on IA (Glu) in rods from control C57Bl6 and Cre mice evoked with strong depolarizing steps (−70 to −10 mV). A: Representative IA(Glu) evoked by 5 (A), 25 (B) and 500 (C) ms steps. Overlaid traces show currents evoked with different intracellular Ca2+ buffers introduced into rods through the patch whole cell recording pipette (0.1 mM EGTA, gray; 5 mM EGTA, black; 1 mM BAPTA, red; 10 mM BAPTA, blue). The stimulus trace is shown at the top of each panel. D. Summary data showing changes in IA(Glu) amplitude with the various buffers. Buffering with 1 mM BAPTA (open red triangles, n = 17 rods, 6 mice) reduced IA (Glu) evoked by 500 ms step significantly compared to control conditions (filled black circles, 5 mM EGTA, n = 56, p < 0.0001, t-test corrected for multiple comparisons). 0.1 mM EGTA (open gray circles, n = 10 rods, 7 mice) significantly enhanced responses evoked by 25 ms (p < 0.001) and 500 ms (p < 0.001) steps. Responses evoked by strong depolarizing steps were abolished by 10 mM BAPTA (filled blue triangles, n = 3 rods) compared to 5 mM EGTA with all step durations (p = 0.002, 5 ms; p = 0.008, 25 ms; p < 0.0001; 500 ms). Error bars show 95% confidence intervals. (For interpretation of the references to colour in this figure legend, the reader is referred to the Web version of this article.)
Fig. 5.
Fig. 5.
IA(Glu) recordings from rods show that eliminating Syt1 diminishes fast release whereas eliminating Syt7 diminishes slower components of depolarization-evoked glutamate release. The traces in A, B and C show overlaid examples of IA(Glu) recorded from rods in four different mouse lines: control (black traces), RodSyt1CKO (red traces), RodSyt7CKO (gray traces), and RodSyt1/Syt7CKO (blue traces) with 5 mM EGTA as the Ca2+ buffer. D. Plot of IA(Glu) amplitude as a function of test step duration (−70 to −10 mV) in recordings from control (filled black circles, n = 42–56), control + TBOA (0.3 mM, filled black triangles, n = 8 rods, 3 mice), RodSyt1CKO (filled red squares, n = 30 rods, 11 mice), RodSyt7CKO (filled gray diamonds, n = 7 rods, 5 mice), and RodSyt1/Syt7CKO mice (open blue squares, n = 8 rods, 3 mice). Responses of RodSyt7CKO and RodSyt1/Syt7CKO mice were both significantly different (Tukey’s multiple comparisons test) from control (P = 0.0024 and 0.021, respectively) and RodSyt1CKO (P = 0.0004 and 0.0049, respectively) mice at 500 ms. RodSyt1CKO rods were significantly different from control at 5 ms and 25 ms (p = 0.0013). Control data were replotted from Fig. 4D. E. IA(Glu) vs. step duration in rods from RodSyt1CKO mice recorded with pipette solutions containing 1 mM BAPTA (open red squares, n = 14 rods) and 10 mM BAPTA (red asterisks, n = 5 rods). Data from RodSyt1CKO mice recorded with 5 mM EGTA (filled red squares) are replotted from D for comparison. Responses were depressed at 500 ms by both 1 (p = 0.0003) and 10 mM BAPTA (p = 0.0002). F. IA (Glu) vs. step duration in rods from Syt7KO mice (CMVSyt7KO) recorded with 0.1 mM EGTA in the pipette solution (open gray diamonds, n = 13–17 rods). Data from control rods recorded with 0.1 mM EGTA are replotted from Fig. 4 for comparison (open black circles). Error bars show 95% confidence intervals. (For interpretation of the references to colour in this figure legend, the reader is referred to the Web version of this article.)
Fig. 6.
Fig. 6.
Exocytotic capacitance responses in rods showed that eliminating Syt1 reduces fast release whereas eliminating Syt7 reduces slower release. A. Examples of membrane capacitance (Cm), membrane conductance (Gm), and access conductance (Gs) from control, RodSyt1CKO, and Syt7KO rods. Test stimuli were 10 and 100 ms steps from −70 to −10 mV. Each stimulus pair was from the same rod. B. Exocytotic capacitance increases plotted as a function of test step duration. Control (filled black circles): 10 ms, n = 24 rods; 25 ms, n = 19; 50 ms, n = 16; 100 ms, n = 21; 200 ms, n = 15; 500 ms, n = 15. RodSyt1CKO (open red circles): 10 ms, n = 12 rods; 25 ms, n = 11; 50 ms, n = 9; 100 ms, n = 11; 200 ms, n = 7; 500 ms, n = 6. Syt7KO (open blue triangles): 10 ms, n = 9 rods; 25 ms, n = 8; 50 ms, n = 6; 100 ms, n = 5; 200 ms, n = 4; 500 ms, n = 8. Rod responses in RodSyt1CKO and Syt7KO mice were significantly smaller than control responses (control vs. RodSyt1CKO, P < 0.0001; control vs. Syt7KO, P = 0.0043, Dunnett’s multiple comparisons test). Error bars show 95% confidence intervals. **: p = 0.00419, t-test corrected for multiple comparisons with False Discovery Rate approach). (For interpretation of the references to colour in this figure legend, the reader is referred to the Web version of this article.)
Fig. 7.
Fig. 7.
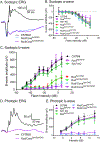
Minimal effects of Syt7 on the ERG. A: Example ERG waveforms evoked by a 20 ms high intensity (−3 dB) flash applied to dark-adapted mouse retina. Responses are from C57Bl6, Rod/ConeSyt1CKO and Rod/ConeSyt1Syt7CKO mice. B: Scotopic ERG a-wave amplitudes in C57Bl6 (filled black circles, n = 6), Syt7 KO (open green circles, n = 7), RodSyt7CKO (open purple squares, n = 4), RodSyt1CKO (filled red squares, n = 7), RodSyt1Syt7CKO (open green triangles, n = 5), Rod/ConeSyt1CKO (open pale blue squares, n = 7), and Rod/ConeSyt1Syt7CKO (open purple diamonds, n = 6) mice. C: B-wave amplitudes evoked under scotopic conditions as a function of flash intensity in C57Bl6 (n = 6 mice), Syt7 KO (n = 5), RodSyt7CKO (n = 4), RodSyt1CKO (n = 7), RodSyt1Syt7CKO (n = 5), Rod/ConeSyt1CKO (n = 7) and Rod/ConeSyt1Syt7CKO (n = 6) mice. Scotopic b-waves were significantly reduced relative to control in Syt7 KO (P = 0.0008), RodSyt1CKO (P = 0.0010), RodSyt1Syt7CKO (P = 0.0019), Rod/ConeSyt1CKO (P = 0.0023) and Rod/ConeSyt1Syt7CKO (P = 0.0016) mice. D: Example of photopic ERGs evoked by a bright flash (+13 dB) in C57Bl6 and Rod/ConeSyt1Syt7CKO mice. E: Photopic b-wave amplitudes in C57Bl6 (n = 6), Syt7 KO (n = 5), RodSyt7CKO (n = 4) mice, RodSyt1Syt7CKO (n = 5), Rod/ConeSyt1CKO (n = 7) and Rod/ConeSyt1Syt7CKO (n = 6) mice. Photopic b-waves from Rod/ConeSyt1CKO (p = 0.023) and Rod/ConeSyt1Syt7CKO mice (p = 0.032, Dunnett’s multiple comparisons test) both differed significantly from control. Error bars show ±S.D. (For interpretation of the references to colour in this figure legend, the reader is referred to the Web version of this article.)
Fig. 8.
Fig. 8.
Effects of Syt7 elimination from the whole retina on ERG oscillatory potentials. A: Example waveforms of ERG responses to a bright flash (5 dB) applied under scotopic conditions in control and Syt7 KO mice. B: Oscillatory potentials extracted from the same pair of responses by bandpass filtering to remove frequencies below 70 Hz and above 280 Hz. C: Oscillatory potential amplitude as a function of flash intensity. Circles show scotopic responses and triangles show photopic responses. Filled black symbols show responses of control C57Bl6 mice (n = 7 mice) whereas open red symbols show responses of Syt7 KO mice (n = 7). Under scotopic conditions, the two samples differed significantly (mixed effects analysis, P < 0.0001) and the reduction in OPs in Syt7 KO achieved statistical significance at two intensities (−9 dB, P = 0.00059; −3 dB, P = 0.00325; unpaired t-test corrected for multiple comparisons, Holm-Sidak method). D: The latency to the largest positive peak (indicated by the arrow in B) did not differ between control and Syt7 KO mice. **: P < 0.01; ***P < 0.001. Error bars show ±S.D. (For interpretation of the references to colour in this figure legend, the reader is referred to the Web version of this article.)

Similar articles

Cited by

References

    1. Adler EM, Augustine GJ, Duffy SN, Charlton MP, 1991. Alien intracellular calcium chelators attenuate neurotransmitter release at the squid giant synapse. J. Neurosci. 11, 1496–1507. - PMC - PubMed
    1. Arriza JL, Eliasof S, Kavanaugh MP, Amara SG, 1997. Excitatory amino acid transporter 5, a retinal glutamate transporter coupled to a chloride conductance. Proc. Natl. Acad. Sci. U. S. A. 94, 4155–4160. - PMC - PubMed
    1. Babai N, Morgans CW, Thoreson WB, 2010. Calcium-induced calcium release contributes to synaptic release from mouse rod photoreceptors. Neuroscience 165, 1447–1456. - PMC - PubMed
    1. Bacaj T, Wu D, Yang X, Morishita W, Zhou P, Xu W, Malenka RC, Sudhof TC, 2013. Synaptotagmin-1 and synaptotagmin-7 trigger synchronous and asynchronous phases of neurotransmitter release. Neuron 80, 947–959. - PMC - PubMed
    1. Bourgeois-Jaarsma Q, Miaja Hernandez P, Groffen AJ, 2021. Ca(2+) sensor proteins in spontaneous release and synaptic plasticity: limited contribution of Doc2c, rabphilin-3a and synaptotagmin 7 in hippocampal glutamatergic neurons. Mol. Cell. Neurosci. 112, 103613. - PubMed

Publication types