. 2023 Feb 1;72(2):196-209.
doi: 10.2337/db22-0471.

Profound Sensitivity of the Liver to the Direct Effect of Insulin Allows Peripheral Insulin Delivery to Normalize Hepatic but Not Muscle Glucose Uptake in the Healthy Dog

Profound Sensitivity of the Liver to the Direct Effect of Insulin Allows Peripheral Insulin Delivery to Normalize Hepatic but Not Muscle Glucose Uptake in the Healthy Dog

Guillaume Kraft et al. Diabetes. .

Abstract

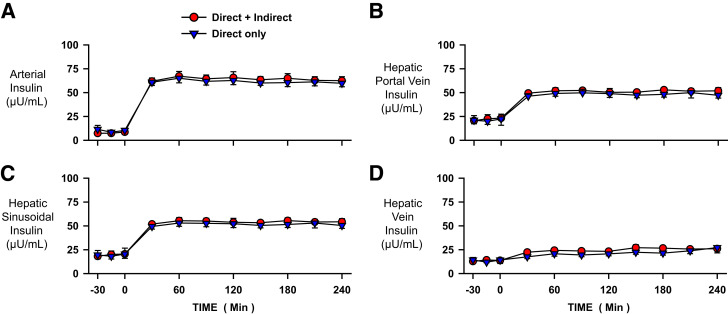
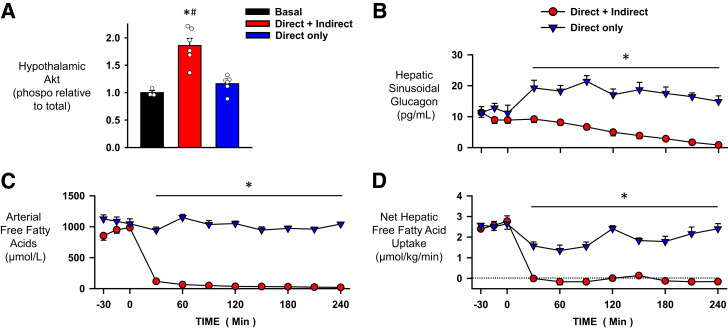
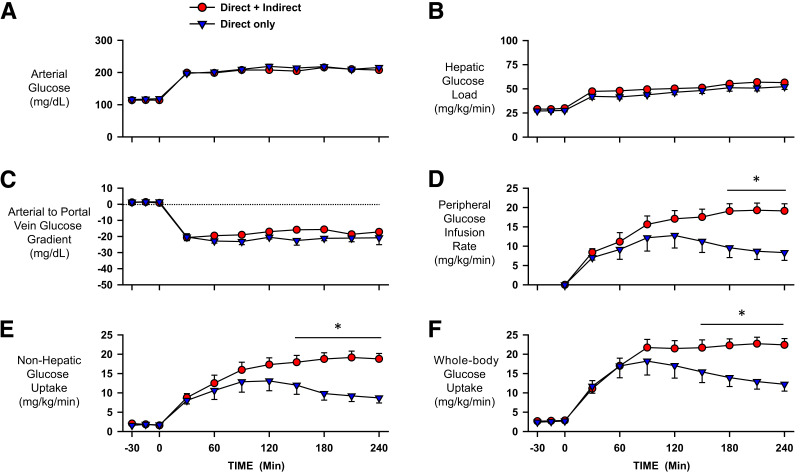
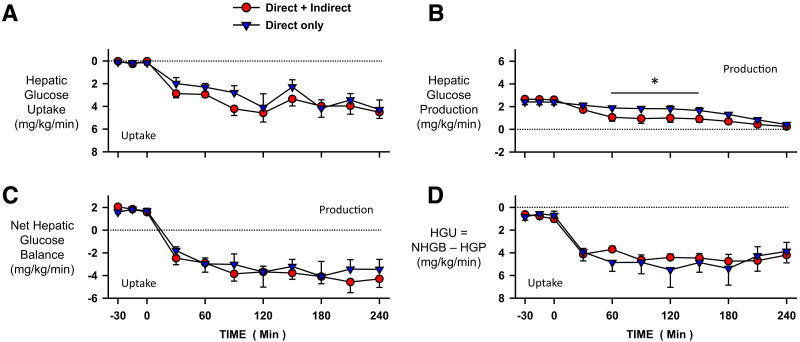
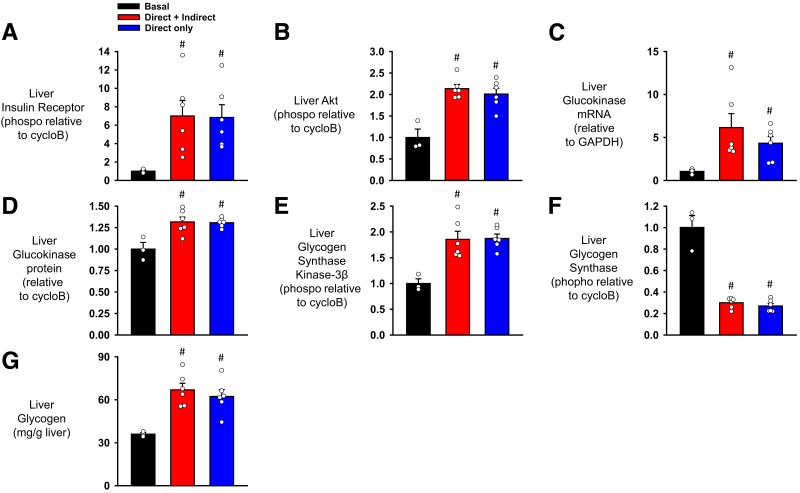
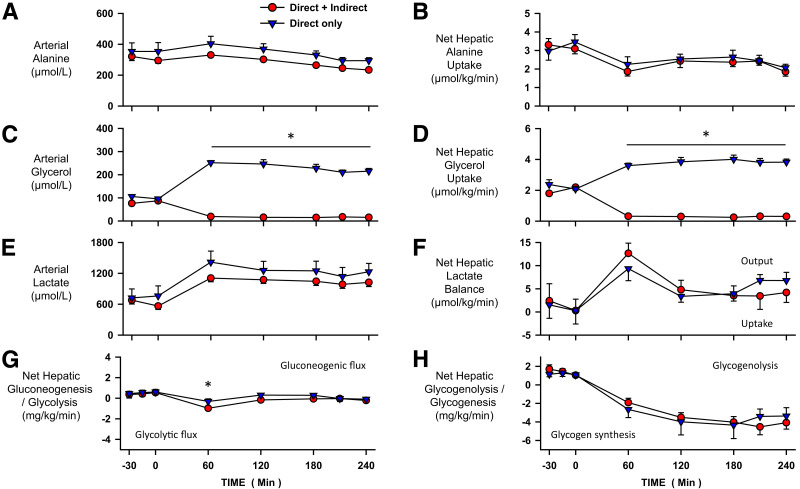
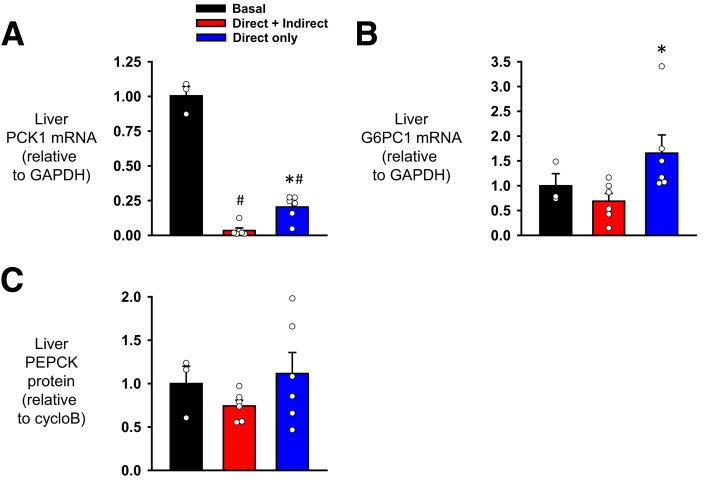
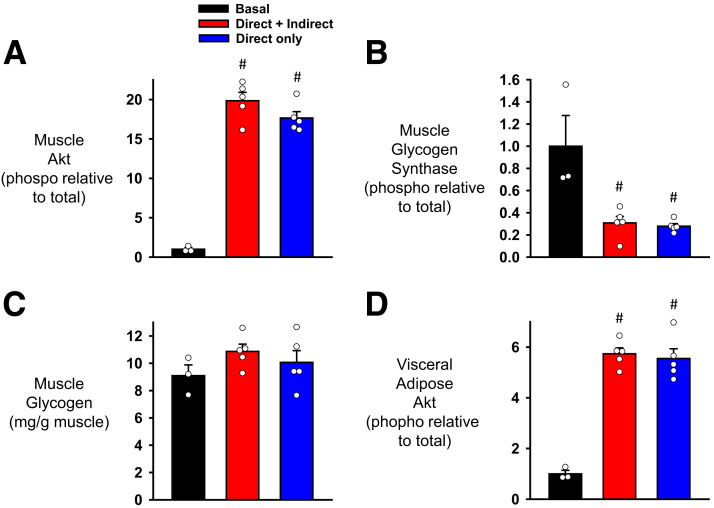
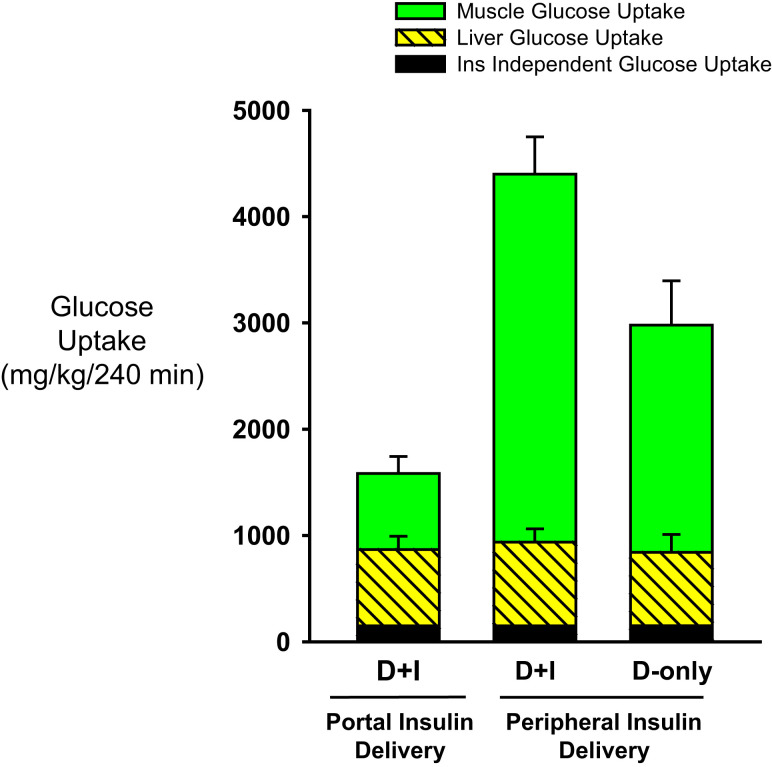
Endogenous insulin secretion is a key regulator of postprandial hepatic glucose metabolism, but this process is dysregulated in diabetes. Subcutaneous insulin delivery alters normal insulin distribution, causing relative hepatic insulin deficiency and peripheral hyperinsulinemia, a major risk factor for metabolic disease. Our aim was to determine whether insulin's direct effect on the liver is preeminent even when insulin is given into a peripheral vein. Postprandial-like conditions were created (hyperinsulinemia, hyperglycemia, and a positive portal vein to arterial glucose gradient) in healthy dogs. Peripheral (leg vein) insulin infusion elevated arterial and hepatic levels 8.0-fold and 2.8-fold, respectively. In one group, insulin's full effects were allowed. In another, insulin's indirect hepatic effects were blocked with the infusion of triglyceride, glucagon, and inhibitors of brain insulin action (intracerebroventricular) to prevent decreases in plasma free fatty acids and glucagon, while blocking increased hypothalamic insulin signaling. Despite peripheral insulin delivery the liver retained its full ability to store glucose, even when insulin's peripheral effects were blocked, whereas muscle glucose uptake markedly increased, creating an aberrant distribution of glucose disposal between liver and muscle. Thus, the healthy liver's striking sensitivity to direct insulin action can overcome the effect of relative hepatic insulin deficiency, whereas excess insulin in the periphery produces metabolic abnormalities in nonhepatic tissues.


Figures

Figure 1
Figure 1
Schematic representation of experimental protocols.
Figure 2
Figure 2
Plasma insulin levels throughout the body. Arterial (A), hepatic portal vein (B), hepatic sinusoidal (C), and hepatic vein (D) insulin. Overnight-fasted conscious dogs were studied under hyperinsulinemic/hyperglycemic conditions where, following a basal period in which there was endogenous insulin secretion (−30 to 0 min), insulin was infused into a peripheral vein to create hyperinsulinemia during the experimental period (0–240 min). In one group, the liver was exposed to insulin’s full effects (D+I) (n = 6), while in the other, only insulin’s direct hepatic effects were present (D-only) (n = 6). Mean ± SEM. There were no significant differences between groups.
Figure 3
Figure 3
The known indirect mediators of hepatic insulin action were allowed to occur (D+I) or were blocked (D-only). A: Hypothalamic Akt, phosphorylated (phospho)/total. B: Hepatic sinusoidal plasma glucagon levels. C: Arterial plasma FFA levels. D: Net hepatic FFA uptake. Overnight-fasted conscious dogs were studied under hyperinsulinemic/hyperglycemic conditions where, following a basal period (−30 to 0 min), during the experimental period (0–240 min) inhibitors of insulin action or artificial CSF were infused into the 3rd ventricle of the brain, and glucagon (portal vein) and triglyceride (peripheral vein) were infused such that the liver was exposed to either insulin’s full effects (D+I) (n = 6) or only insulin’s direct effects (D-only) (n = 6). Hypothalamic samples from overnight-fasted animals (n = 3) were used to provide baseline control data (basal insulin and glucose conditions) for comparison with tissue taken at the end of each study. Mean ± SEM. #P < 0.05 vs. basal; *P < 0.05 between groups.
Figure 4
Figure 4
Glucose parameters. A: Arterial plasma glucose. B: Hepatic glucose load. C: Arterial to portal vein glucose gradient. D: Peripheral glucose infusion rate. E: Nonhepatic glucose uptake. F: Whole-body glucose uptake. Overnight-fasted conscious dogs were studied under hyperinsulinemic/hyperglycemic conditions where, following a basal period (−30 to 0 min), glucose was infused into the portal vein (4 mg/kg/min) to create a glucose feeding signal and into a peripheral vein to double the plasma glucose level during the experimental period (0–240 min). In one group, the liver was exposed to insulin’s full effects (D+I) (n = 6), while in the other, only insulin’s direct hepatic effects were present (D-only) (n = 6). Mean ± SEM. *P < 0.05 between groups; unless indicated, there were no significant differences between groups.
Figure 5
Figure 5
Hepatic glucose metabolism. A: HGU. B: HGP. C: Net hepatic glucose balance (NHGB). D: An estimate of HGU calculated by subtracting HGP from net hepatic glucose balance. Overnight-fasted conscious dogs were studied under hyperinsulinemic/hyperglycemic conditions where, following a basal period (−30 to 0 min), animals were exposed to either the full effects of insulin (D+I) (n = 6) or only insulin’s direct effects (D-only) (n = 6) during the experimental period (0–240 min). Mean ± SEM. *P < 0.05 between groups; unless indicated, there were no significant differences between groups.
Figure 6
Figure 6
Hepatic insulin signaling. A: Liver insulin receptor β subunit, tyrosine phosphorylation/cyclophilin B. B: Liver Akt, phosphorylated (Phospho)/cyclophilin B (cycloB). C: Liver glucokinase mRNA/GAPDH. D: Liver glucokinase protein, total/cyclophilin B. E: Liver glycogen synthase kinase-3β, phosphorylated/cyclophilin B. F: Liver glycogen synthase, phosphorylated/cyclophilin B. G: Liver glycogen. Overnight-fasted conscious dogs were studied under hyperinsulinemic/hyperglycemic conditions in groups that were exposed to either the full effects of insulin (D+I) (n = 6) or only insulin’s direct effects (D-only) (n = 6). Liver samples from overnight-fasted animals (n = 3) were used to provide baseline control data (basal insulin and glucose conditions) for comparison with tissue taken at the end of each study. Mean ± SEM. *P < 0.05 between groups, #P < 0.05 vs. basal period; unless indicated, there were no significant differences between groups.
Figure 7
Figure 7
Metabolites and intrahepatic gluconeogenic, glycolytic, and glycogen fluxes. A: Arterial blood alanine. B: Net hepatic alanine uptake. C: Arterial blood glycerol. D: Net hepatic glycerol uptake. E: Arterial blood lactate. F: Net hepatic lactate balance. G: Net hepatic gluconeogenic and glycolytic fluxes. H: Net hepatic glycogenolytic and glycogenic fluxes. Overnight-fasted conscious dogs were studied under hyperinsulinemic/hyperglycemic conditions where, following a basal period (−30 to 0 min), animals were exposed to either the full effects of insulin (D+I) (n = 6) or only insulin’s direct effects (D-only) (n = 6) during the experimental period (0–240 min). Mean ± SEM. *P < 0.05 between groups; unless indicated, there were no significant differences between groups.
Figure 8
Figure 8
Hepatic gluconeogenic enzyme regulation. A: Liver phosphoenolpyruvate carboxykinase mRNA/GAPDH. B: Liver glucose-6-phosphatase catalytic subunit-1 mRNA/GAPDH. C: Liver phosphoenolpyruvate carboxykinase protein, total/cyclophilin B. Overnight-fasted conscious dogs were studied under hyperinsulinemic/hyperglycemic conditions in groups that were exposed to either the full effects of insulin (D+I) (n = 6) or only insulin’s direct effects (D-only) (n = 6). Liver samples from overnight-fasted animals (n = 3) were used to provide baseline control data (basal insulin and glucose conditions) for comparison with tissue taken at the end of each study. Mean ± SEM. *P < 0.05 between groups, #P < 0.05 vs. basal period; unless indicated, there were no significant differences between groups.
Figure 9
Figure 9
Skeletal muscle and visceral adipose parameters. A: Muscle Akt, phosphorylated (phospho)/total. B: Muscle glycogen synthase kinase-3β, phosphorylated/total. C: Muscle glycogen. D: Visceral adipose Akt, phosphorylated/total. Overnight-fasted conscious dogs were studied under hyperinsulinemic/hyperglycemic conditions in groups that were exposed to either the full effects of insulin (D+I) (n = 5) or only insulin’s direct effects (D-only) (n = 5). Liver samples from overnight fasted animals (n = 3) were used to provide baseline control data (basal insulin and glucose conditions) for comparison with tissue taken at the end of each study. Mean ± SEM. #P < 0.05 vs. basal period; unless indicated, there were no significant differences between groups.
Figure 10
Figure 10
Rates of muscle, liver, and insulin-independent (Ins independent) glucose uptake during the experimental period in overnight-fasted conscious dogs studied under matched glycemic conditions. Insulin was either delivered into the portal vein (1.2 mU/kg/min, n = 5 [data from 36]); D+I effects were present) or a peripheral vein at (1.35 mU/kg/min [data from the current study]) where animals were exposed to either the full effects of insulin (D+I) (n = 6) or only insulin’s direct effects (D-only) (n = 6) during the experimental period (0–240 min). With portal insulin delivery (36) there was the physiologic distribution of insulin between peripheral tissues and the liver (arterial and hepatic sinusoidal insulin levels were 20 ± 2 vs. 63 ± 5 µU/mL, respectively, during the experimental period), which resulted in an equal distribution of glucose between the liver and muscle. With peripheral insulin delivery (present study) arterial and hepatic sinusoidal insulin levels were 64 ± 4 and 54 ± 3 µU/mL (D+I) and 61 ± 4 and 52 ± 3 µU/mL (D-only). HGU was normal, but the response at muscle was defective. Mean ± SEM.

Similar articles

Cited by

References

    1. Corkey BE. Banting lecture 2011: hyperinsulinemia: cause or consequence? Diabetes 2012;61:4–13 - PMC - PubMed
    1. Czech MP. Insulin action and resistance in obesity and type 2 diabetes. Nat Med 2017;23:804–814 - PMC - PubMed
    1. Ferrannini E, Haffner SM, Mitchell BD, Stern MP. Hyperinsulinaemia: the key feature of a cardiovascular and metabolic syndrome. Diabetologia 1991;34:416–422 - PubMed
    1. Gregory JM, Cherrington AD, Moore DJ. The peripheral peril: injected insulin induces insulin insensitivity in type 1 diabetes. Diabetes 2020;69:837–847 - PMC - PubMed
    1. Janssen JAMJL. Hyperinsulinemia and its pivotal role in aging, obesity, type 2 diabetes, cardiovascular disease and cancer. Int J Mol Sci 2021;22:7797. - PMC - PubMed