. 2023 Jan 5;146(1):75-90.
doi: 10.1093/brain/awac309.

Cerebrovascular insulin receptors are defective in Alzheimer's disease

Affiliations

Cerebrovascular insulin receptors are defective in Alzheimer's disease

Manon Leclerc et al. Brain. .

Abstract

Central response to insulin is suspected to be defective in Alzheimer's disease. As most insulin is secreted in the bloodstream by the pancreas, its capacity to regulate brain functions must, at least partly, be mediated through the cerebral vasculature. However, how insulin interacts with the blood-brain barrier and whether alterations of this interaction could contribute to Alzheimer's disease pathophysiology both remain poorly defined. Here, we show that human and murine cerebral insulin receptors (INSRs), particularly the long isoform INSRα-B, are concentrated in microvessels rather than in the parenchyma. Vascular concentrations of INSRα-B were lower in the parietal cortex of subjects diagnosed with Alzheimer's disease, positively correlating with cognitive scores, leading to a shift towards a higher INSRα-A/B ratio, consistent with cerebrovascular insulin resistance in the Alzheimer's disease brain. Vascular INSRα was inversely correlated with amyloid-β plaques and β-site APP cleaving enzyme 1, but positively correlated with insulin-degrading enzyme, neprilysin and P-glycoprotein. Using brain cerebral intracarotid perfusion, we found that the transport rate of insulin across the blood-brain barrier remained very low (<0.03 µl/g·s) and was not inhibited by an insulin receptor antagonist. However, intracarotid perfusion of insulin induced the phosphorylation of INSRβ that was restricted to microvessels. Such an activation of vascular insulin receptor was blunted in 3xTg-AD mice, suggesting that Alzheimer's disease neuropathology induces insulin resistance at the level of the blood-brain barrier. Overall, the present data in post-mortem Alzheimer's disease brains and an animal model of Alzheimer's disease indicate that defects in the insulin receptor localized at the blood-brain barrier strongly contribute to brain insulin resistance in Alzheimer's disease, in association with β-amyloid pathology.

Keywords: Alzheimer’s disease; blood–brain barrier; insulin receptor; insulin resistance.


Figures

Figure 1
Figure 1
INSRα-B levels are reduced in Alzheimer’s disease, correlating with cognitive dysfunction. (A) Pro-INSR, INSRα and INSRβ are enriched in vascular fractions from the parietal cortex, along with endothelial markers claudin-5, ABCB1(P-gp) and CD31, whereas NeuN, a neuronal marker, is rather concentrated in the microvessel-depleted parenchymal fraction. (B) Schematic representation of the transmembrane INSR: the extracellular α chain binds circulating insulin and the intracellular β chain acts as a primary effector of insulin signaling pathway through auto-phosphorylation. INSRα is expressed as isoforms A and B due to alternative splicing (exon 11 is spliced for isoform B). (C) Human INSR is colocalized with claudin-5 and collagen IV in brain microvessels and hippocampal section, whereas no colocalization was observed with NeuN-labelled neurons in microvessel-depleted fractions (magnification ×20, scale bar = 20 μm). (DM) Dot plots of the concentrations of INSR forms in microvessels comparing participants based on neuropathological diagnosis following the ABC criteria (DH) or clinical diagnosis (IM). Unpaired t-test ($P < 0.05) or one-way ANOVA followed by Tukey’s post hoc test (**P < 0.01). (N) Correlation between the levels of vascular INSRα-B and the global cognitive score. Linear regression analyses were controlled for educational level, age at death, sex and apoE genotype. F ratio and P-value are shown. (O and P) Dot plots of the concentrations of pro-INSR and INSRα-B in microvessels comparing APOE4 carriers based on the ABC neuropathological diagnosis. Welch-ANOVA followed by Dunnett’s post hoc test (¤P < 0.05). (Q) Representative western blots of consecutive bands are shown. Data were log transformed for statistical analysis and are represented as scatter plots with a logarithmic scale. Horizontal bars indicate mean ± SEM. ABC = Dx Neuropathological Diagnosis; A-AD = Alzheimer’s disease; ColIV = Collagen-IV; C = Control; Clinical Dx = Clinical Diagnosis; CypB = Cyclophilin B; EC = Extracellular; IC = Intracellular; O.D. = optical density; P = Microvessel-depleted parenchymal fraction; T = Total homogenate; Va = Vascular fraction enriched in microvessels.
Figure 2
Figure 2
Cerebrovascular levels of INSRα-B correlate with neuritic plaques and Aβ-related proteins located on the BBB. (AG) Correlations between cerebrovascular INSRs and neurofibrillary tangle counts, phosphorylated-tau T231/S235 (AT180), S396/404 (AD2, confirmed with PHF1) (Tau neuropathology), cortex neuritic plaque counts and Aβ concentrations (Aβ-neuropathology) in brain homogenates. Correlations were also established with other proteins assessed in microvessel-enriched fractions. Soluble and insoluble proteins are found in TBS-soluble and formic acid-soluble fractions, respectively. Linear regressions analyses were controlled for educational level, age at death, sex and ApoE genotype, and were performed to generate F-ratios and P-values in the heatmap (•P < 0.05; ••P < 0.01; •••P < 0.001; ••••P < 0.0001). Red and blue highlighted cells, respectively, indicate significant positive and negative correlations (A). Graphical representation of noteworthy correlations between INSRα-B and Aβ-related markers (BD) and transporters (E), as well as microvessel markers (F and G). APP = amyloid precursor protein; O.D. = optical density; RAGE = receptor for advanced glycation end products.
Figure 3
Figure 3
Lower vascular INSR in old 3xTg-AD mice. (A) Representative western blots showing enriched content in pro-INSR, INSRα and INSRβ in vascular fractions compared to parenchymal fractions (rich in neuronal marker NeuN) and total homogenates from the mouse brain, along with known endothelial markers claudin-5, CD31 and ABCB1(P-gp). (BF) Vascular levels of pro-INSR, INSRβ, INSRα-A, INSRα-B and BACE1 in 3xTg-AD and Non-Tg mice at 6, 12 and 18 months of age (42 males and 34 females). Two-way ANOVA followed by Tukey’s post hoc test (*P < 0.05; ns = non-significant), and linear trend model. Data are presented as mean ± SEM. (G) Representative western blots of consecutive bands are shown. 3xTg-AD = tri-transgenic mice; CypB = Cyclophilin B; EC = Extracellular; IC = Intracellular; NTg-Non-Tg = non-Tg mice; O.D. = optical density; P = Microvessel-depleted parenchymal fraction; T = Total homogenate; Va = Vascular fraction enriched in microvessels.
Figure 4
Figure 4
The activation of INSR after intracarotid injection of insulin is restricted to brain microvessels and is blunted in 3xTg-AD mice. (A) Illustration of the ISCP technique. (B) Brain uptake coefficient of 125I-insulin (0.01 nM) perfused alone or with S961 (20 nM), a selective INSR antagonist competing with insulin, in Balb/c mice aged 15 weeks. 3H-Diazepam (0.3 µCi/µl) was perfused in age-matched C57Bl6 mice to emphasize the difference between a highly diffusible drug and insulin (left). No significant change in cerebrovascular volume due to the treatment was observed by coperfusing the vascular marker 3H-sucrose (0.3 µCi/ml) (right). Unpaired t-test or parametric one-way analysis of variance (ns, non-significant). Data are presented as mean ± SEM. (C) Brain uptake coefficient of 125I-insulin (0.01 nM) comparing non-Tg and 3xTg-AD mice aged 13.5 months (left). No significant change in cerebrovascular volume due to the treatment was observed by coperfusing the vascular marker 3H-sucrose (0.3 µCi/ml) (right). Unpaired t-test (ns, non-significant). Data are presented as mean ± SEM. (D) Representative western blots showing phosphorylated INSRβ in vascular fractions following perfusion of insulin (Aspart or Toronto) by ISCP in 6-month-old C57Bl6 mice, compared to parenchymal fractions. Endothelial markers CD31 and ABCB1 (P-gp) as well as the neuronal markers β-tubulin III, NeuN and GAP43 and were immunoblotted on the same membranes. (EL) Dot plots of the concentrations of INSR isoforms in microvessels comparing mice based on genotype and insulin perfusion (EI), and cerebrovascular proteins BACE1, eNOS and caveolin-1 (J–L). One-way or two-way analysis of variance followed by Tukey’s post hoc test (*P < 0.05; ****P < 0.0001). Data were log transformed for statistical analysis. Outliers were removed from statistical analyses as described in the 'Methods section'. Horizontal bars indicate mean ± SEM. (M) Representative western blots of consecutive bands are shown, from the same samples, but from a different randomization. 3xTg-AD = tri-transgenic mice; As = insulin Aspart (NovoRapid®); CypB = Cyclophilin B; Diaz = Diazepam; Ins = insulin perfusion; GAP43 = Growth Associated Protein 43; NTg-Non-Tg = non-Tg mice; P = Microvessel-depleted parenchymal fraction; S961 = INSR antagonist; S-Sal = saline perfusion; To = regular insulin Toronto (Novolin® ge); Va = Vascular fraction enriched in microvessels.
Figure 5
Figure 5
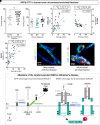
BACE1 cleavage product APPβ-CTF is negatively associated with human neurovascular levels of INSRα-B. (A and B) Dot plots of the concentrations of APPβ-CTF in microvessels comparing participants based on neuropathological diagnosis following the ABC criteria (A) or clinical diagnosis (B). Unpaired t-test ($P < 0.05) or parametric one-way analysis of variance followed by Tukey’s post hoc test. Data were log transformed for statistical analysis and are represented as scatter plots with a logarithmic scale. Horizontal bars indicate mean ± SEM. (CE) Correlations between the levels of vascular APPβ-CTF, INSRα-A/B ratio, INSRα-B and BACE1, in human brain vascular fractions. Linear regression analyses were controlled for educational level, age at death, sex and ApoE genotype. F-ratio and P-values are shown. (F) Representative immunofluorescence labelling of human INSRα showing the colocalization with Aβ42 and collagen IV in brain microvessels of an Alzheimer’s disease patient with stage 4 cerebral amyloid angiopathy (CAA) pathology (magnification ×40, scale bar = 20 μm). (G) Representative immunofluorescence labelling of BACE1 showing its colocalization with collagen IV in brain microvessels of an Alzheimer’s disease patient (magnification ×20, scale bar = 20 μm). (H) Illustration of the role of β-secretase in cleaving APP and, hypothetically, INSR in the brain vasculature of Alzheimer’s disease patients. ABC Dx = neuropathological diagnosis; AD = Alzheimer’s disease; APP = amyloid precursor protein; APPβ-CTF = β-secretase-derived βAPP C-terminal fragment; AICD = amyloid precursor protein intracellular domain; BACE1 = β-site APP cleaving enzyme; CAA = cerebral amyloid angiopathy; Clinical Dx = clinical diagnosis; ColIV = collagen IV; EC = extracellular; IC = intracellular; O.D. = optical density; sAPPβ = β-secretase-derived βAPP soluble fragment.

Comment in

Similar articles

Cited by

References

    1. Lewis GF, Brubaker PL. The discovery of insulin revisited: Lessons for the modern era. J Clin Invest. 2021;131(1):e1422399. - PMC - PubMed
    1. Polyzos SA, Mantzoros CS. Diabetes mellitus: 100 years since the discovery of insulin. Metabolism. 2021;118:154737. - PubMed
    1. Heni M, Kullmann S, Preissl H, Fritsche A, Häring H-U. Impaired insulin action in the human brain: Causes and metabolic consequences. Nat Rev Endocrinol. 2015;11:701–11. - PubMed
    1. Arnold SE, Arvanitakis Z, Macauley-Rambach SL, et al. . Brain insulin resistance in type 2 diabetes and Alzheimer disease: Concepts and conundrums. Nat Rev Neurol. 2018;14:168–81. - PMC - PubMed
    1. Kellar D, Craft S. Brain insulin resistance in Alzheimer's disease and related disorders: Mechanisms and therapeutic approaches. Lancet Neurol. 2020;19:758–66. - PMC - PubMed

Publication types