

Neurofilament Light Chain Levels Are Predictive of Clinical Conversion in Radiologically Isolated Syndrome
- PMID: 36280258
- PMCID: PMC9621336
- DOI: 10.1212/NXI.0000000000200044
Neurofilament Light Chain Levels Are Predictive of Clinical Conversion in Radiologically Isolated Syndrome
Abstract
Background and objectives: To evaluate the predictive value of serum neurofilament light chain (sNfL) and CSF NfL (cNfL) in patients with radiologically isolated syndrome (RIS) for evidence of disease activity (EDA) and clinical conversion (CC).
Methods: sNfL and cNfL were measured at RIS diagnosis by single-molecule array (Simoa). The risk of EDA and CC according to sNfL and cNfL was evaluated using the Kaplan-Meier analysis and multivariate Cox regression models including age, spinal cord (SC) or infratentorial lesions, oligoclonal bands, CSF chitinase 3-like protein 1, and CSF white blood cells.
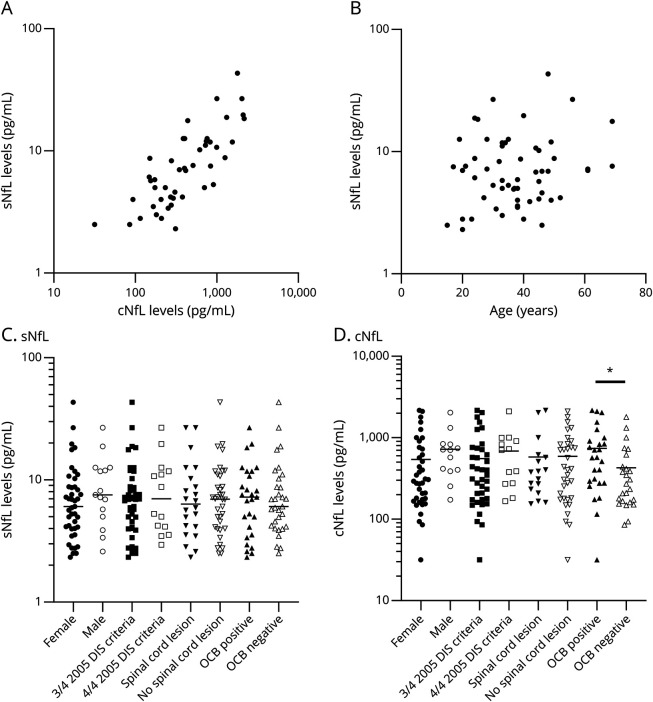
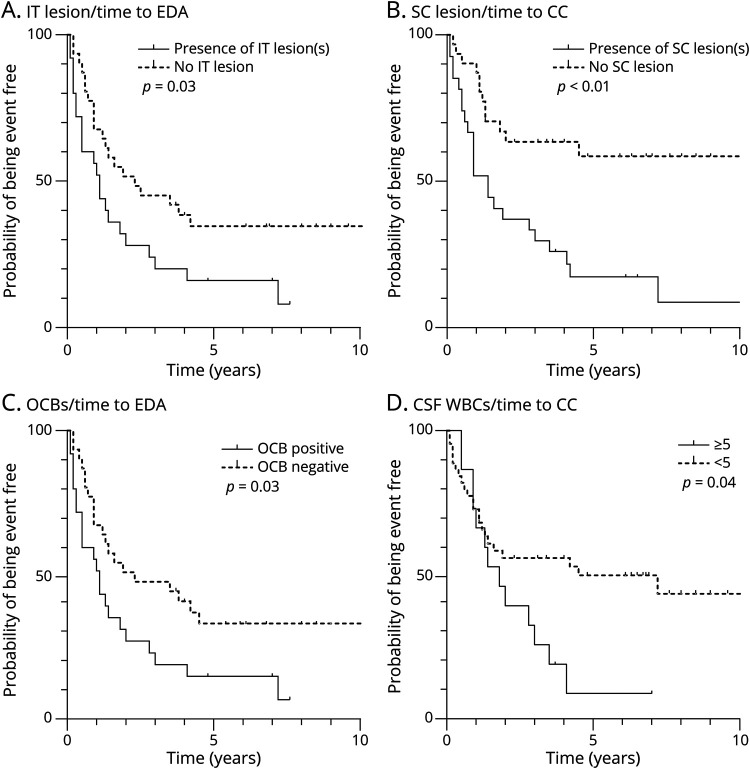
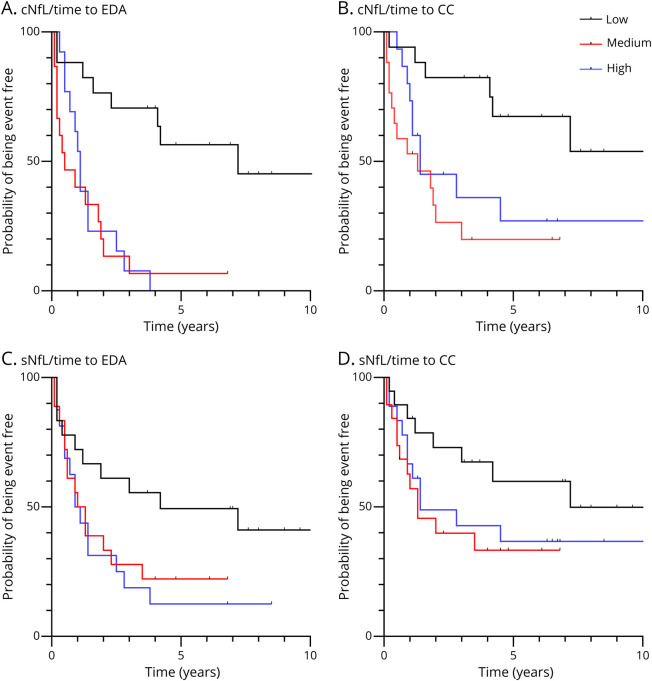
Results: Sixty-one patients with RIS were included. At diagnosis, sNfL and cNfL were correlated (Spearman r = 0.78, p < 0.001). During follow-up, 47 patients with RIS showed EDA and 36 patients showed CC (median time 12.6 months, 1-86). When compared with low levels, medium and high cNfL (>260 pg/mL) and sNfL (>5.0 pg/mL) levels were predictive of EDA (log rank, p < 0.01 and p = 0.02, respectively). Medium-high cNfL levels were predictive of CC (log rank, p < 0.01). In Cox regression models, cNfL and sNfL were independent factors of EDA, while SC lesions, cNfL, and sNfL were independent factors of CC.
Discussion: cNfL >260 pg/mL and sNfL >5.0 pg/mL at diagnosis are independent predictive factors of EDA and CC in RIS. Although cNfL predicts disease activity better, sNfL is more accessible than cNfL and can be considered when a lumbar puncture is not performed.
Classification of evidence: This study provides Class II evidence that in people with radiologic isolated syndrome (RIS), initial serum and CSF NfL levels are associated with subsequent evidence of disease activity or clinical conversion.
Copyright © 2022 The Author(s). Published by Wolters Kluwer Health, Inc. on behalf of the American Academy of Neurology.
Figures
References
-
- Okuda DT, Mowry EM, Beheshtian A, et al. Incidental MRI anomalies suggestive of multiple sclerosis: the radiologically isolated syndrome. Neurology. 2009;72(9):800-805. - PubMed
-
- Polman CH, Reingold SC, Edan G, et al. Diagnostic criteria for multiple sclerosis: 2005 revisions to the “McDonald criteria”. Ann Neurol. 2005;58(6):840-846. - PubMed
-
- Lebrun-Frenay C, Kantarci O, Siva A, Sormani MP, Pelletier D, Okuda DT; 10-Year RISC Study Group on behalf of SFSEP, OFSEP. Radiologically isolated syndrome: 10-year risk estimate of a clinical event. Ann Neurol. 2020;88(2):407-417. - PubMed
Publication types
MeSH terms
Substances
LinkOut - more resources
Full Text Sources
Research Materials