. 2022 Dec 7;42(49):9263-9277.
doi: 10.1523/JNEUROSCI.0545-22.2022. Epub 2022 Oct 24.

The Absence of Parkin Does Not Promote Dopamine or Mitochondrial Dysfunction in PolgAD257A/D257A Mitochondrial Mutator Mice

Affiliations

The Absence of Parkin Does Not Promote Dopamine or Mitochondrial Dysfunction in PolgAD257A/D257A Mitochondrial Mutator Mice

Laura Scott et al. J Neurosci. .

Abstract

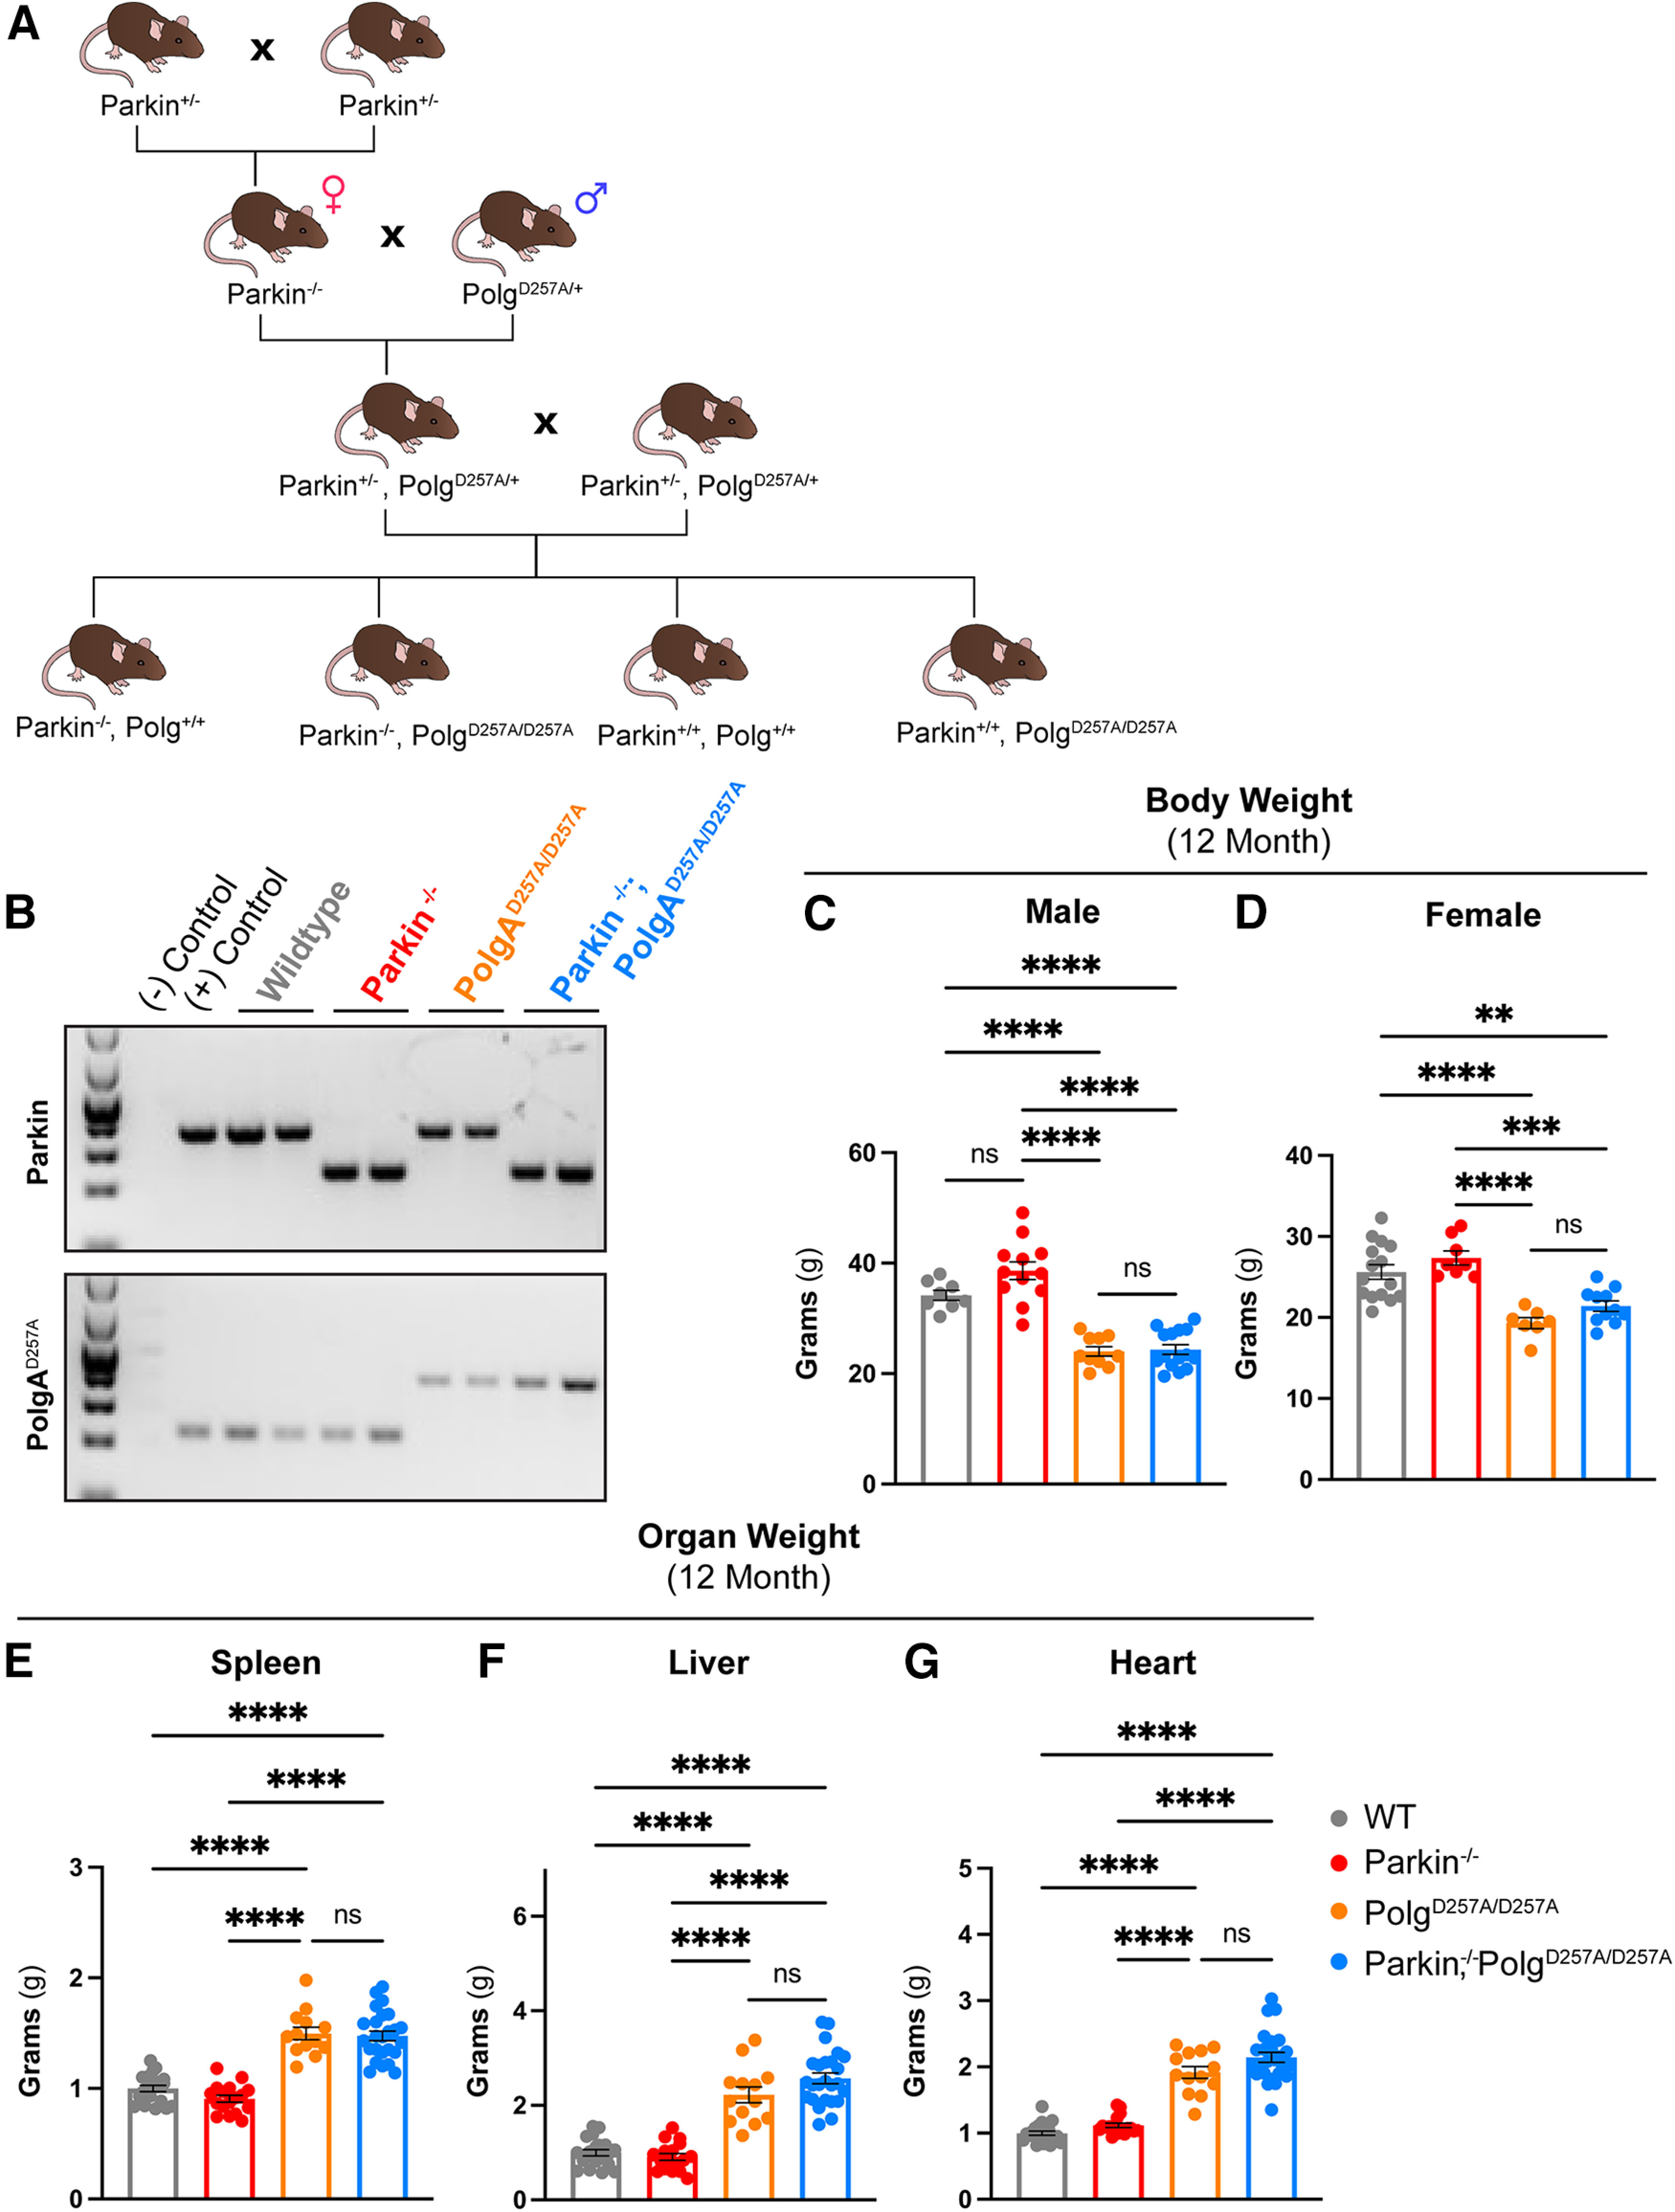
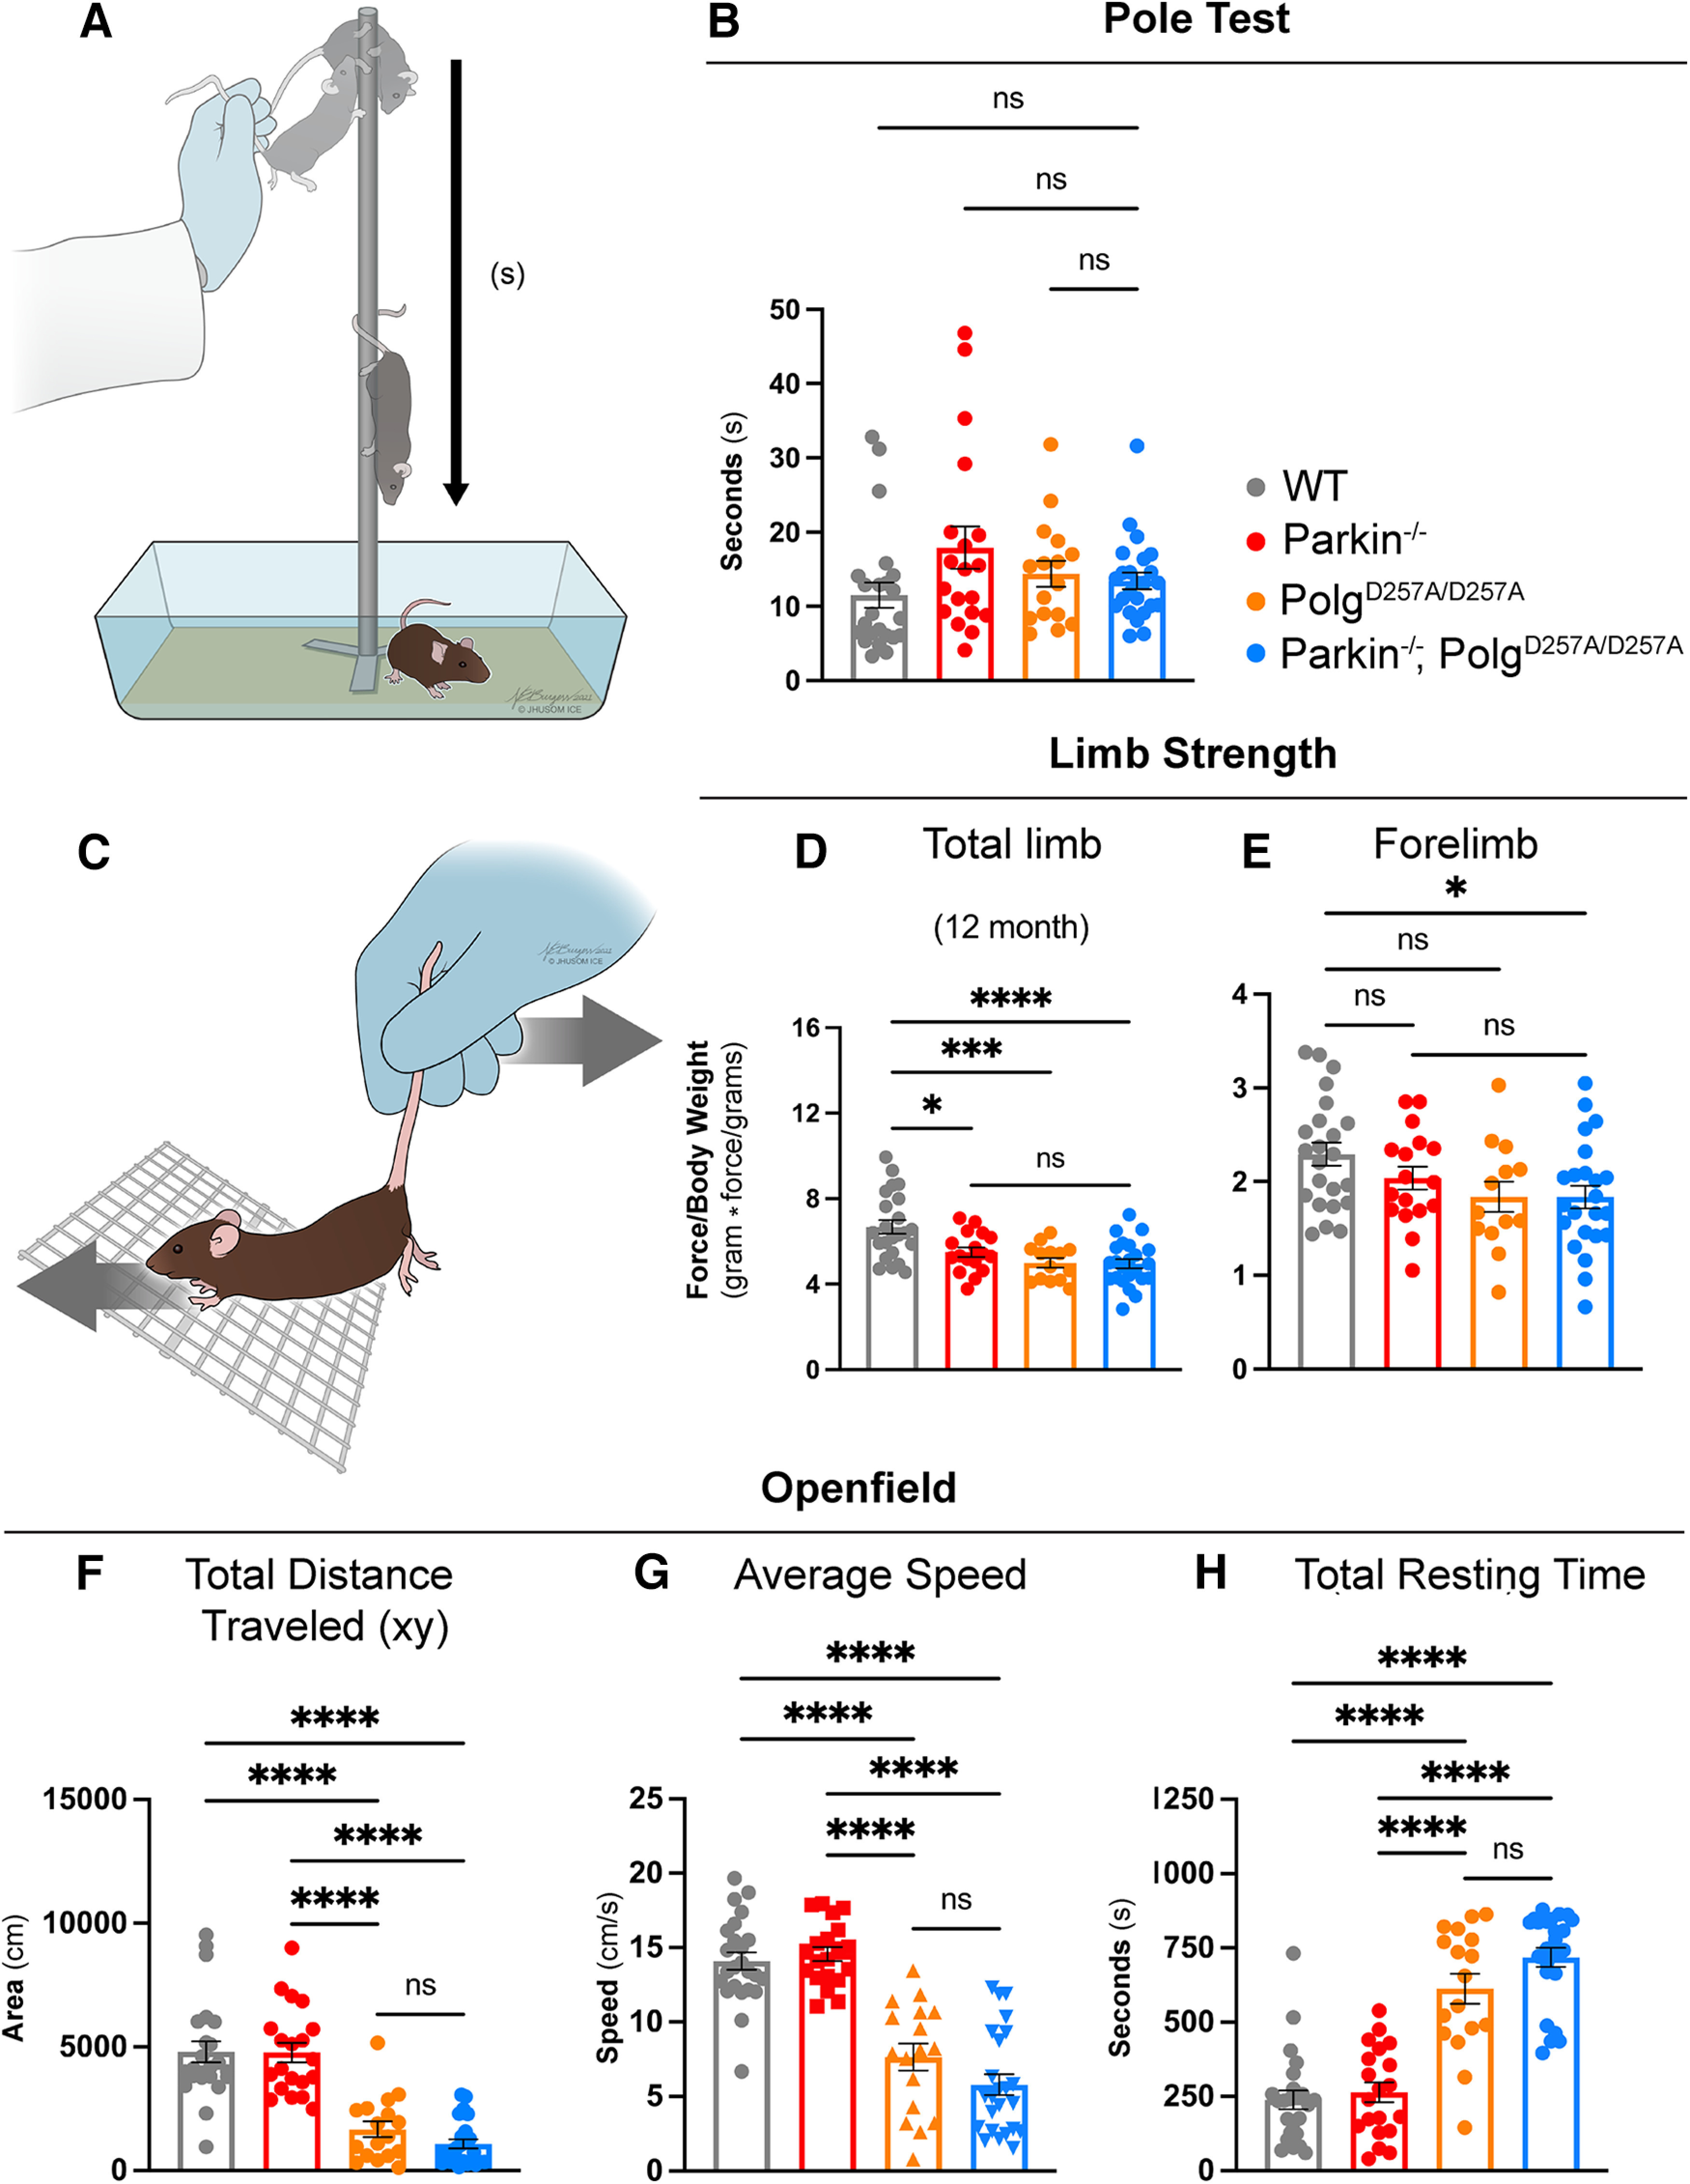
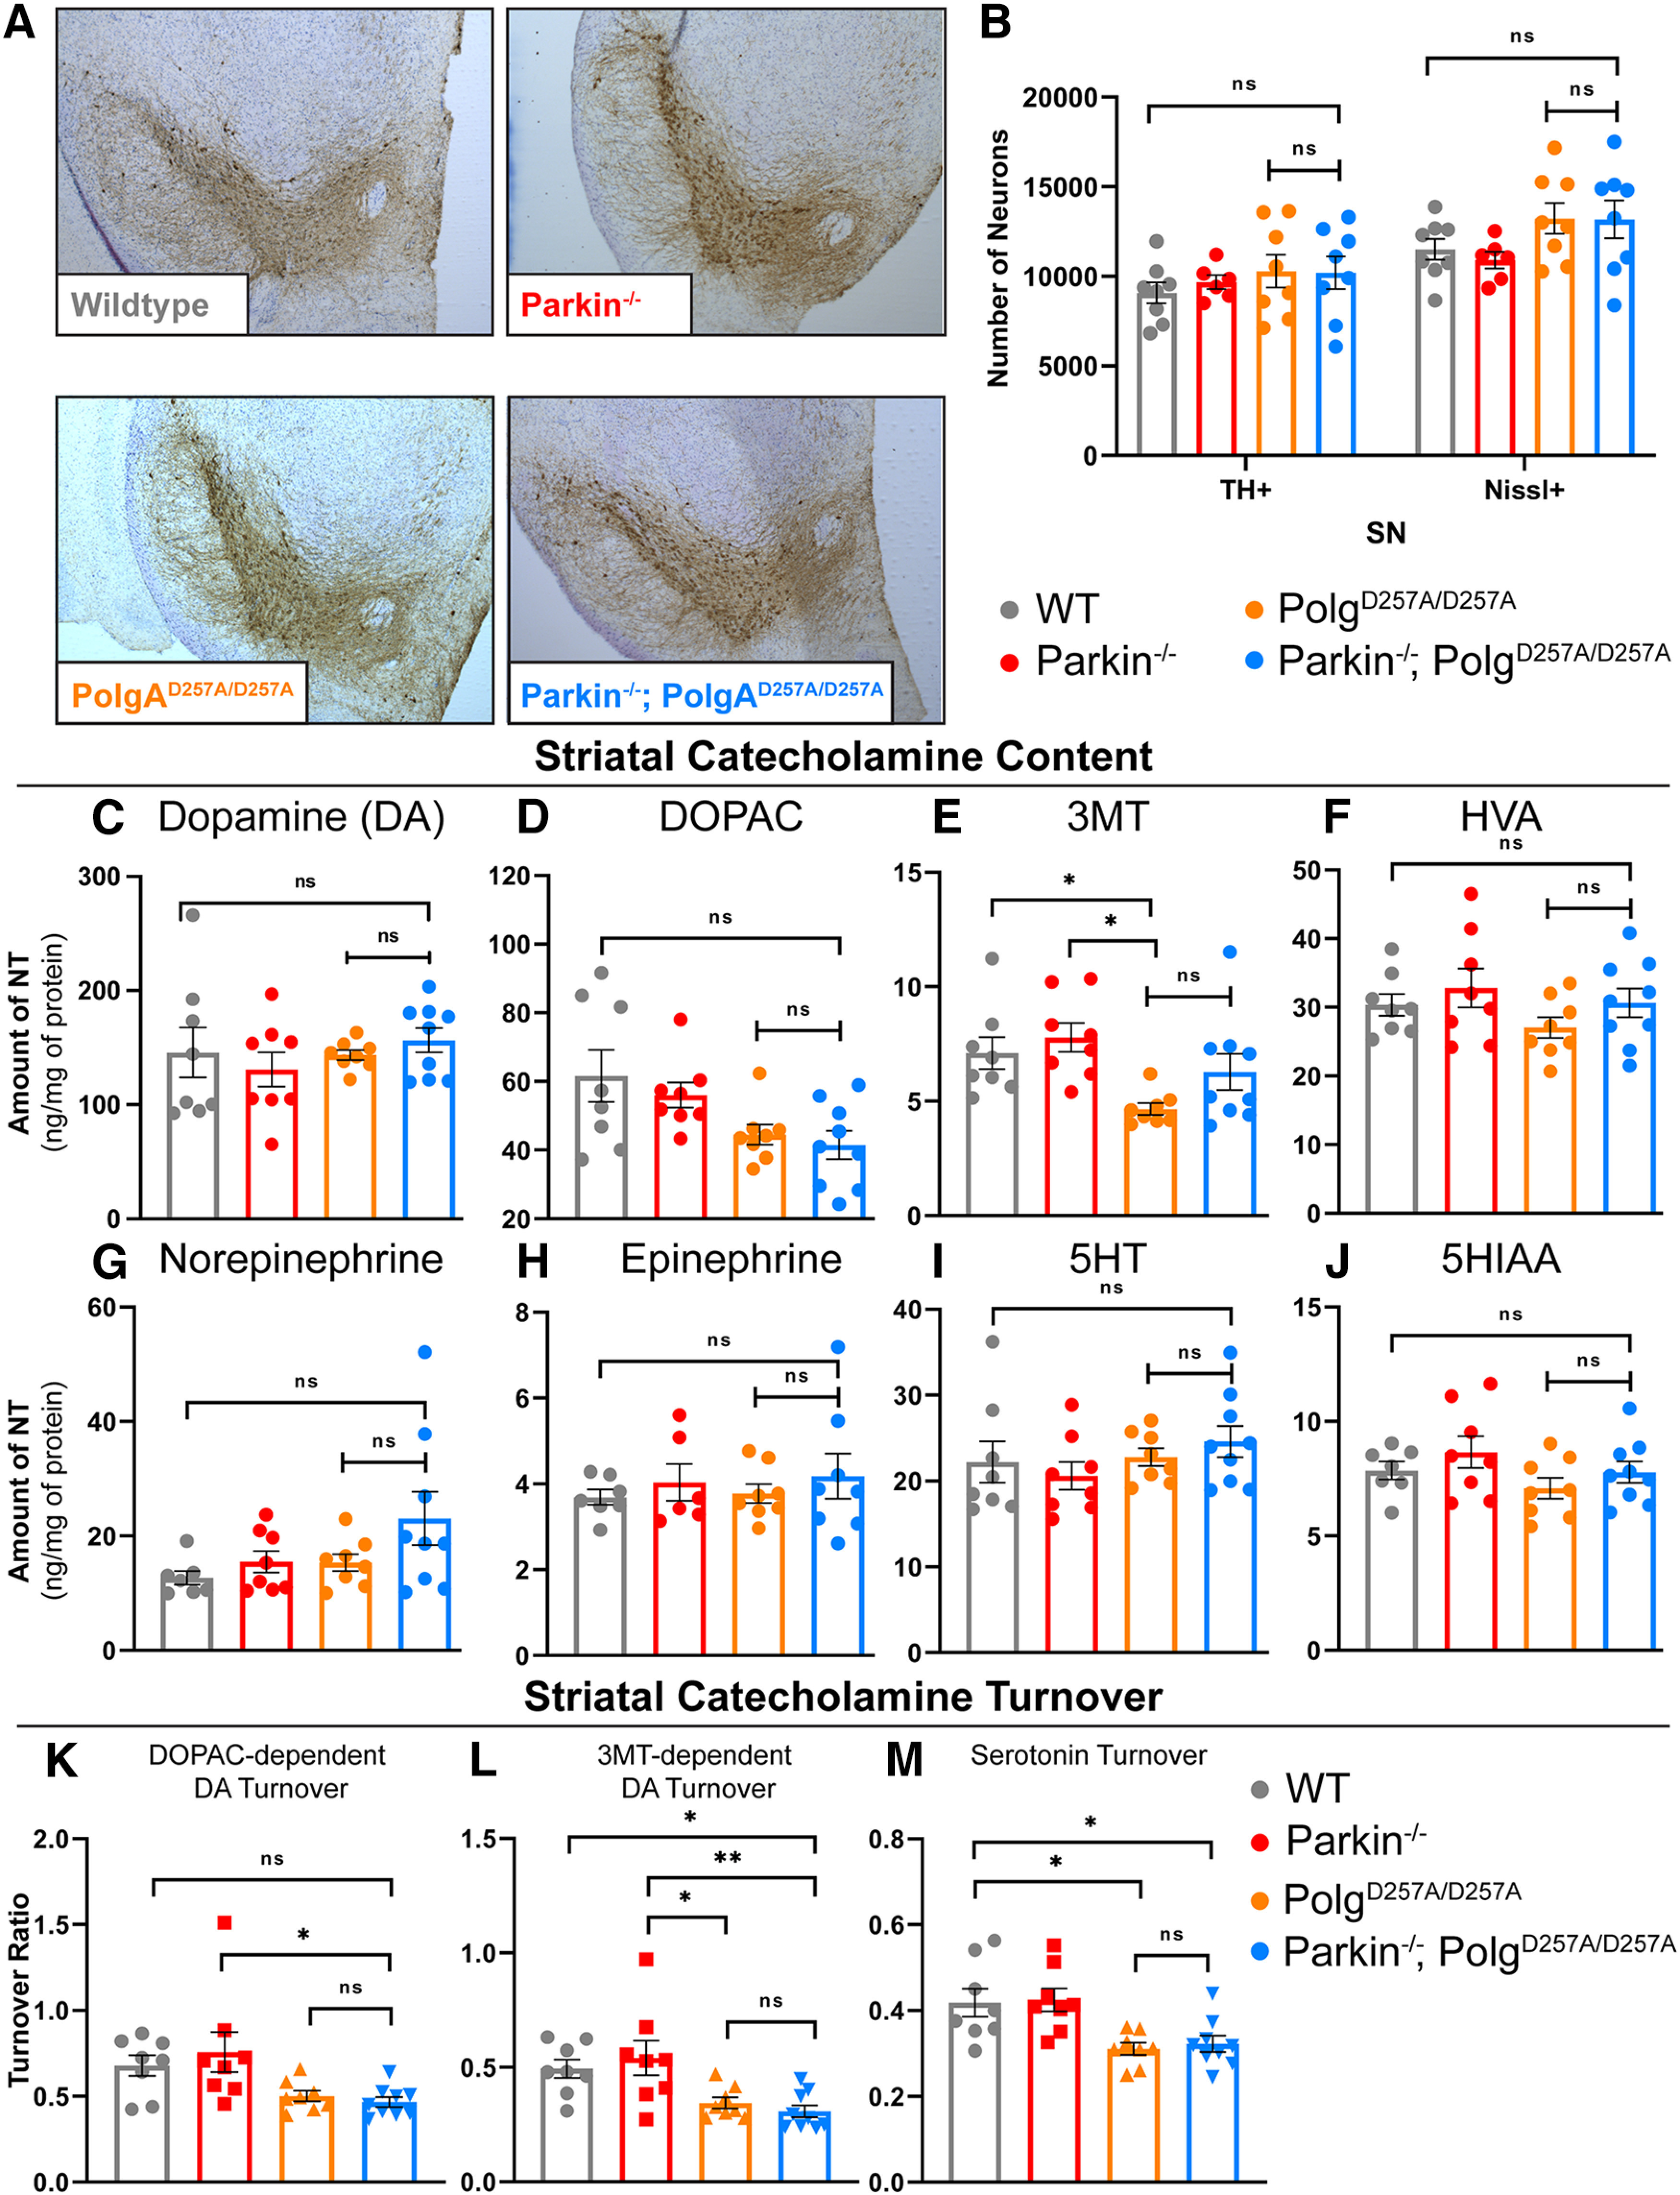
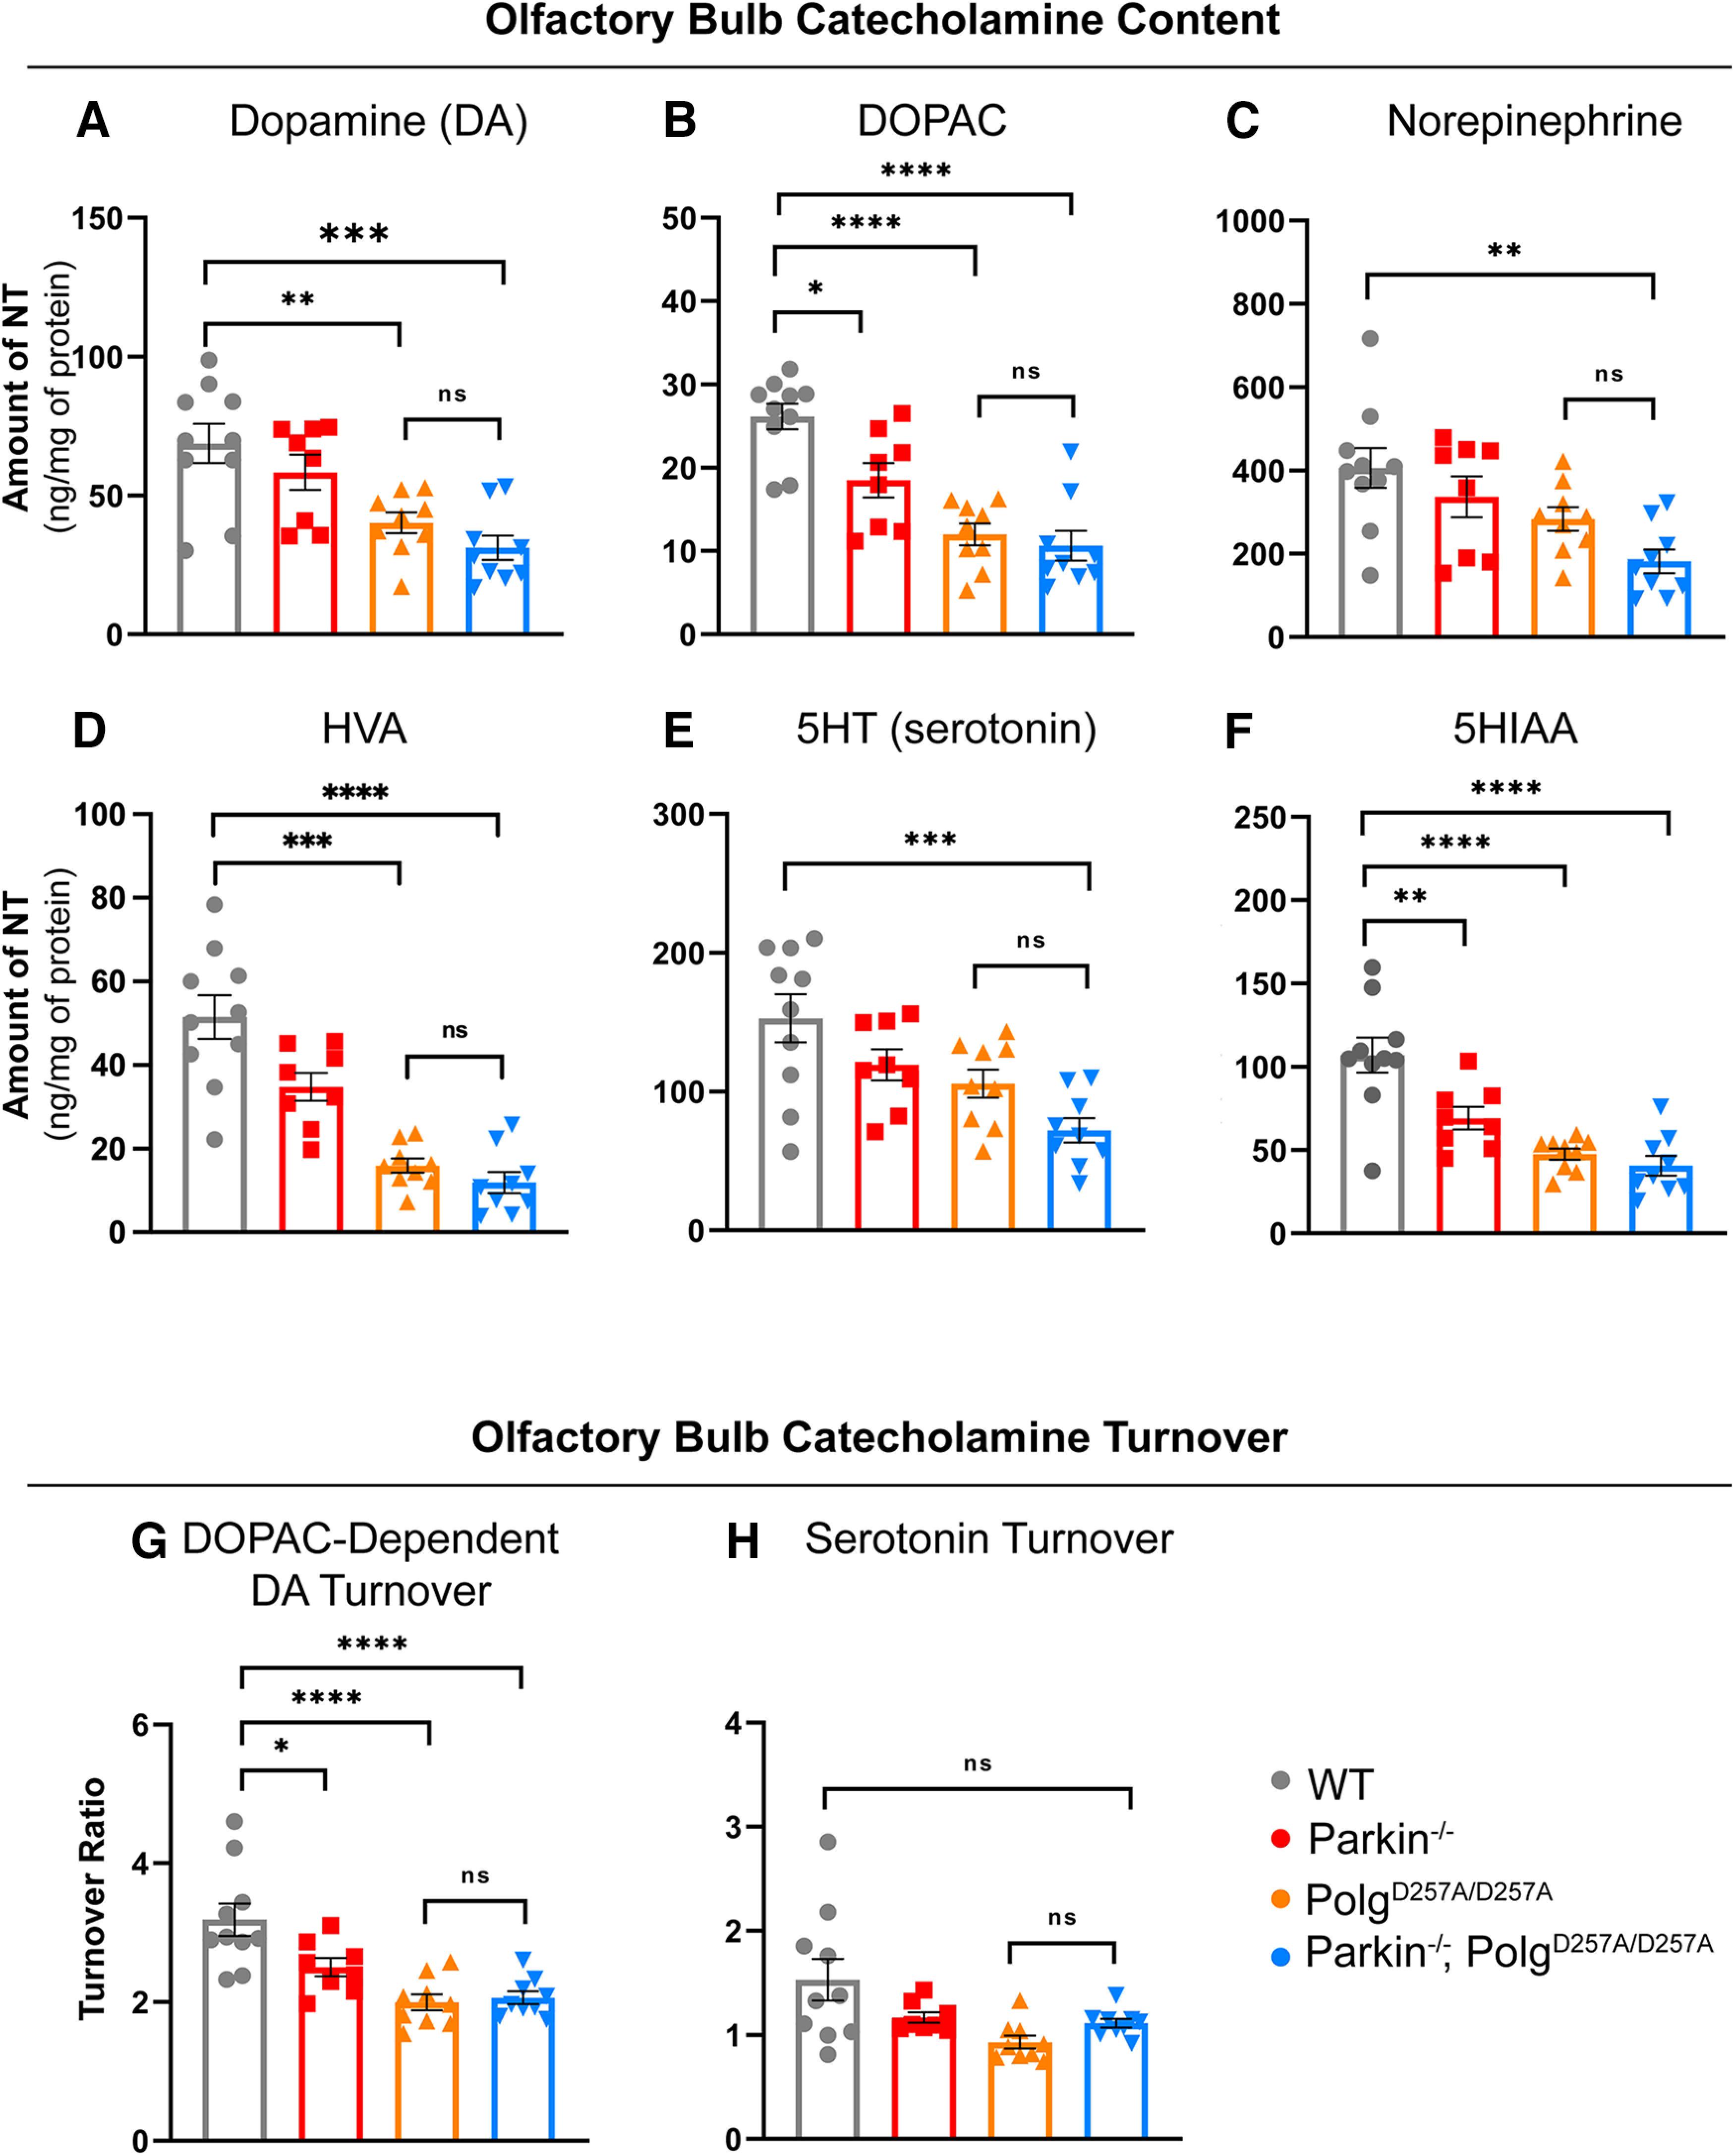
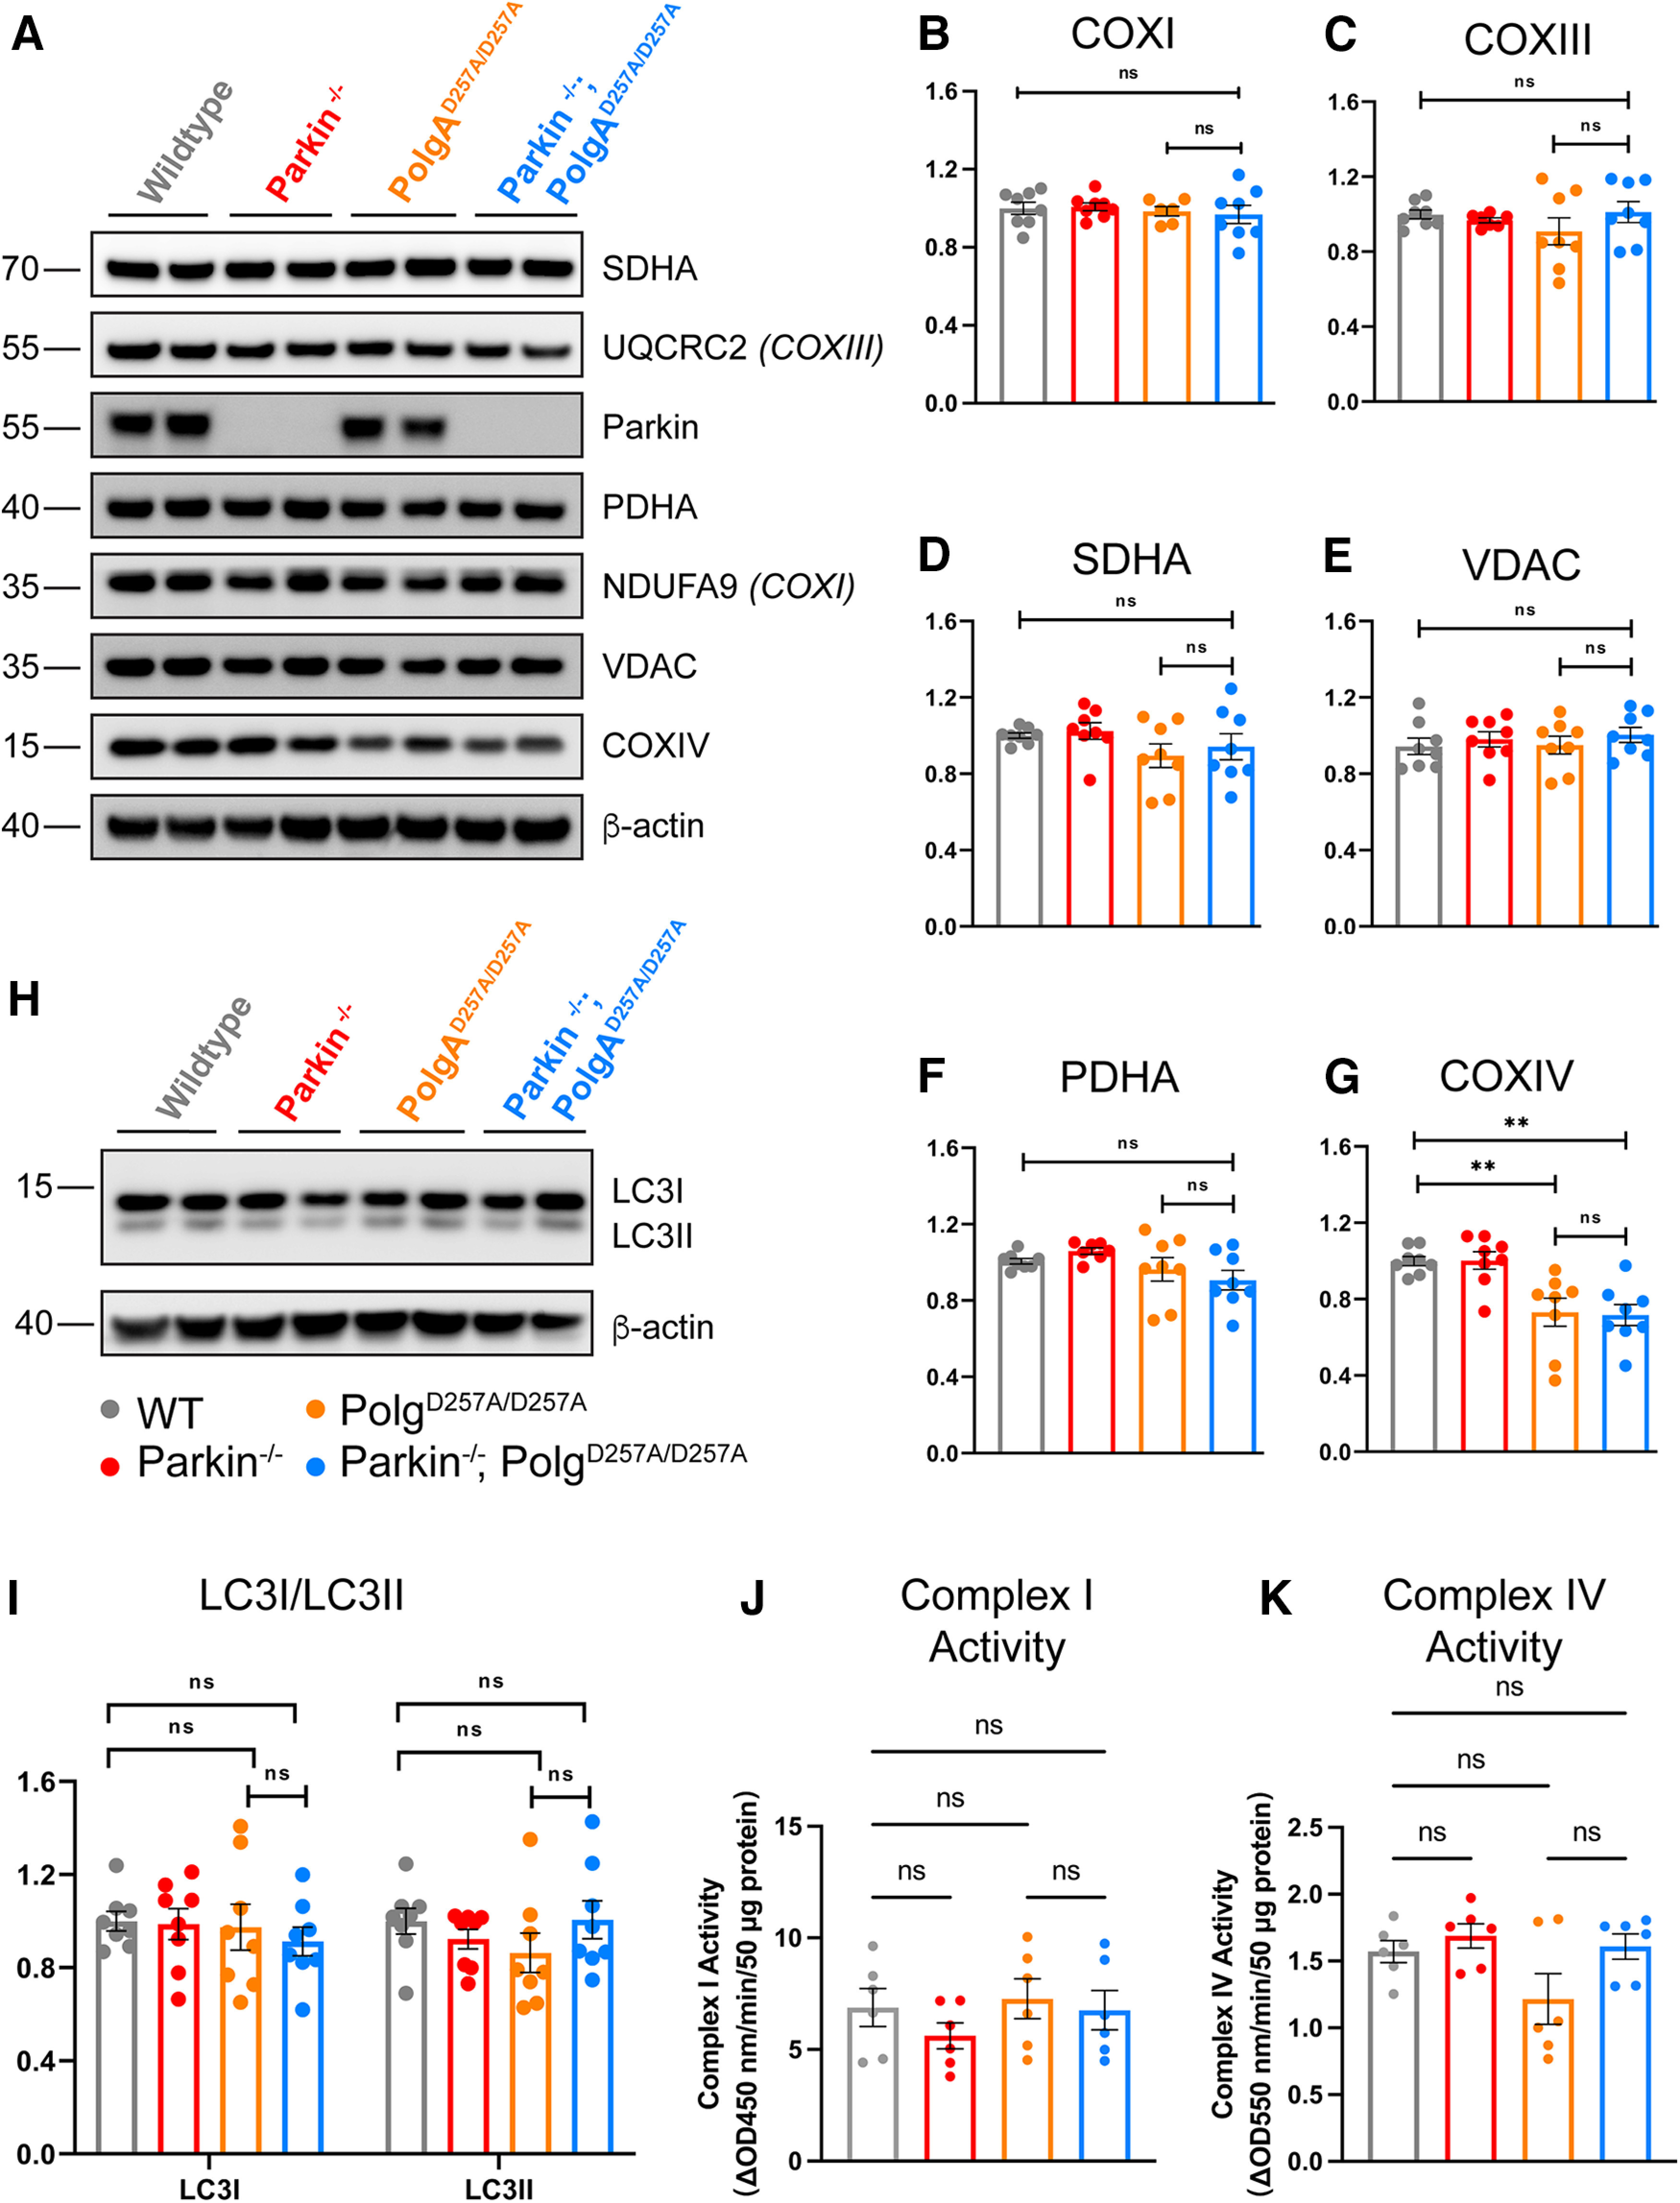
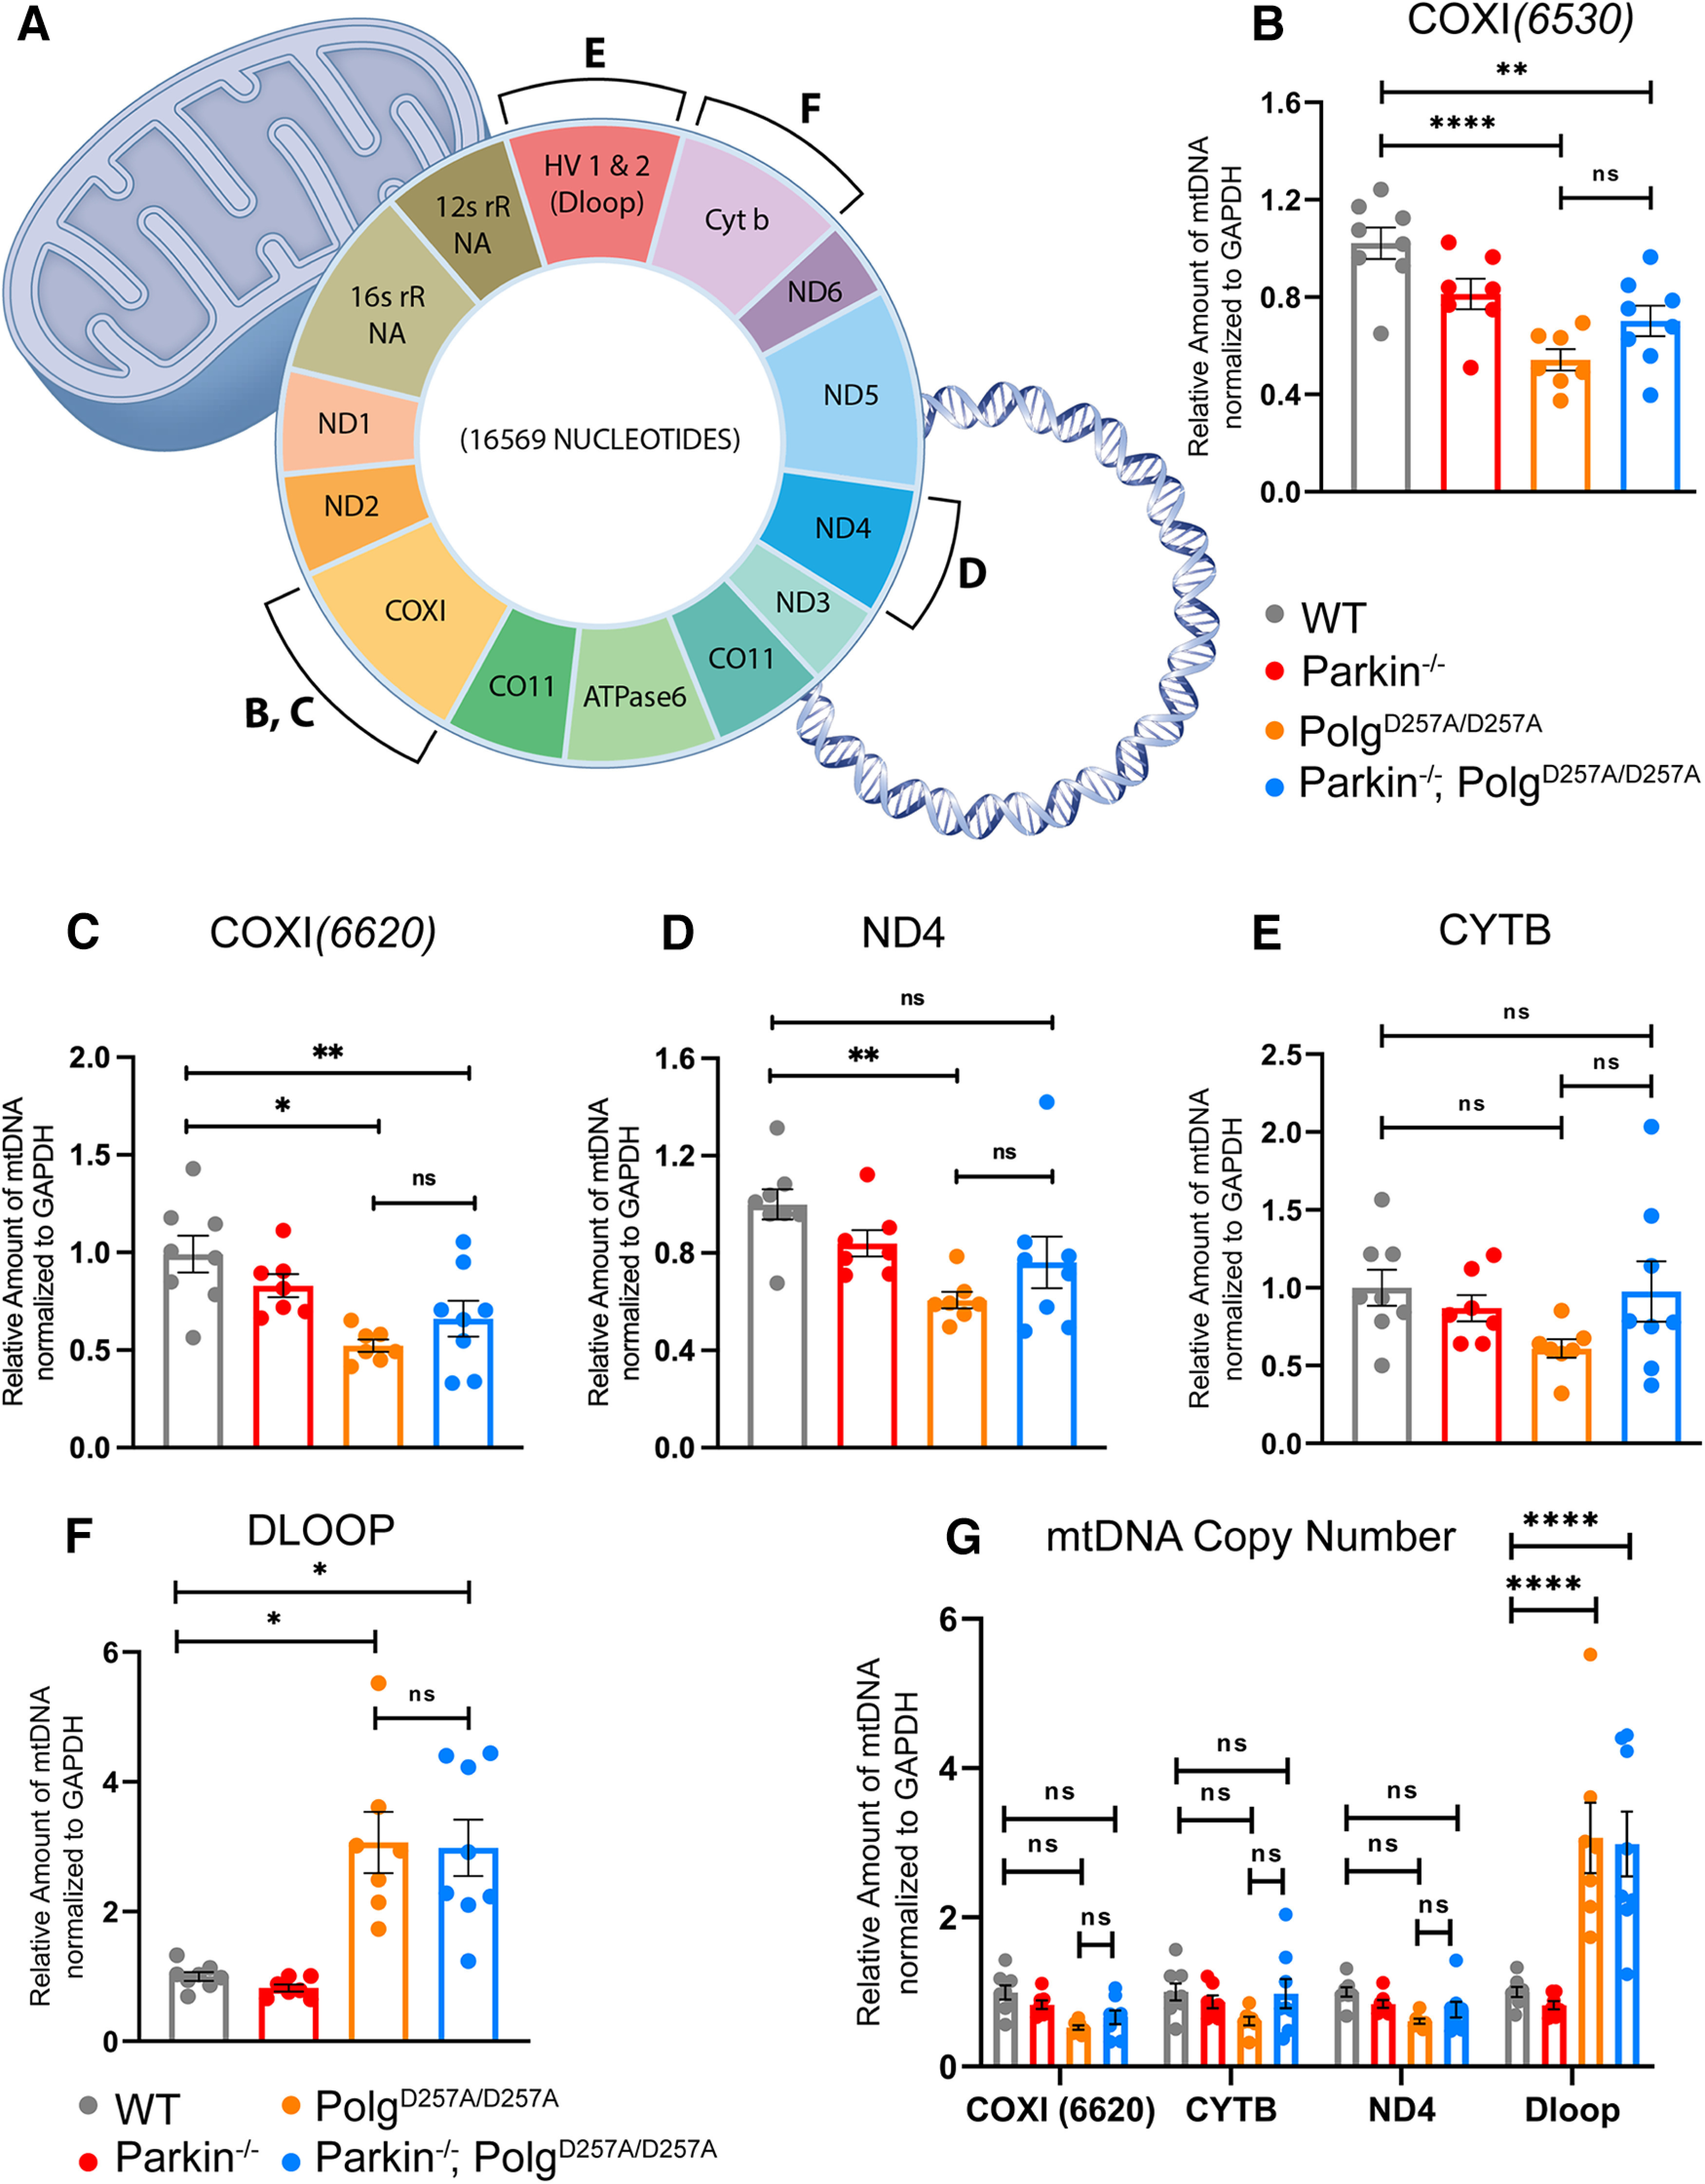
Parkinson's disease (PD) is characterized by the progressive loss of dopaminergic neurons in the substantia nigra pars compacta (SNpc). In this study, we generated a transgenic model by crossing germline Parkin-/- mice with PolgAD257A mice, an established model of premature aging and mitochondrial stress. We hypothesized that loss of Parkin-/- in PolgAD257A/D257A mice would exacerbate mitochondrial dysfunction, leading to loss of dopamine neurons and nigral-striatal specific neurobehavioral motor dysfunction. We found that aged Parkin-/-/PolgAD257A/D257A male and female mice exhibited severe behavioral deficits, nonspecific to the nigral-striatal pathway, with neither dopaminergic neurodegeneration nor reductions in striatal dopamine. We saw no difference in expression levels of nuclear-encoded subunits of mitochondrial markers and mitochondrial Complex I and IV activities, although we did observe substantial reductions in mitochondrial-encoded COX41I, indicating mitochondrial dysfunction as a result of PolgAD257A/D257A mtDNA mutations. Expression levels of mitophagy markers LC3I/LC3II remained unchanged between cohorts, suggesting no overt mitophagy defects. Expression levels of the parkin substrates, VDAC, NLRP3, and AIMP2 remained unchanged, suggesting no parkin dysfunction. In summary, we were unable to observe dopaminergic neurodegeneration with corresponding nigral-striatal neurobehavioral deficits, nor Parkin or mitochondrial dysfunction in Parkin-/-/PolgAD257A/D257A mice. These findings support a lack of synergism of Parkin loss on mitochondrial dysfunction in mouse models of mitochondrial deficits.SIGNIFICANCE STATEMENT Producing a mouse model of Parkinson's disease (PD) that is etiologically relevant, recapitulates clinical hallmarks, and exhibits reproducible results is crucial to understanding the underlying pathology and in developing disease-modifying therapies. Here, we show that Parkin-/-/PolgAD257A/D257A mice, a previously reported PD mouse model, fails to reproduce a Parkinsonian phenotype. We show that these mice do not display dopaminergic neurodegeneration nor nigral-striatal-dependent motor deficits. Furthermore, we report that Parkin loss does not synergize with mitochondrial dysfunction. Our results demonstrate that Parkin-/-/PolgAD257A/D257A mice are not a reliable model for PD and adds to a growing body of work demonstrating that Parkin loss does not synergize with mitochondrial dysfunction in mouse models of mitochondrial deficits.

Keywords: POLG; Parkinson's disease; mitochondria; mitophagy; parkin.


Figures

Figure 1.
Figure 1.
Physiologic data of 12-month-old mice. A, Schematic depicting breeding scheme to produce Parkin–/–/PolgAD257A/D257A mice. Female and male mice are depicted with the symbol for females and males respectively. B, Representative gel confirming genotypes of pups. C, D, Body weight of 12-month-old female and male mice. Results are the mean ± SEM, n = 7–15 per group. Datasets were unbiasedly analyzed using ROUT outlier analysis with a maximum false discovery rate (q) of 0.1%. Data were found to be normally distributed via D'Agostino and Pearson test. SDs did not significantly differ per Brown–Forsythe test of variance. Significance of means was analyzed via ordinary one-way ANOVA (C: F(3,41) = 40.94 ****p < 0.0001; D: F(5,37) = 15.97 ****p < 0.0001). Post hoc Tukey's test resulted in ****p < 0.0001 for all PolgAD257A/D257A-expressing mice compared with wild-type and Parkin–/– for both male and female cohorts, ns, not significant. E, F, Mass of spleen and liver (organs with known defects in PolgAD257A/D257A mice) were recorded. Mass was normalized to body weight and then further normalized to the average wild-type organ mass/body weight ratio. Results are the mean ± SEM, n = 14–25 per group. Datasets were unbiasedly analyzed using ROUT outlier analysis with a maximum false discovery rate (q) of 0.1%. Data were found to be normally distributed via D'Agostino and Pearson test. Brown–Forsythe test of variance found that SDs differed significantly; therefore, significance of means was determined via a Welch one-way ANOVA (E: W(3.0,42.16) = 65.89 ****p < 0.0001; F: W(3.0,43.85) = 93.922 ****p < 0.0001). Post hoc Dunnett's T3 test resulted in E: ****p < 0.0001 for all PolgAD257A/D257A-expressing mice compared with wild-type and Parkin–/–; F: ****p < 0.0001 for all PolgAD257A/D257A-expressing mice compared with wild-type and Parkin–/–, ns, not significant. G, Mass of hearts were recorded. Mass was normalized to body weight and then further normalized to the average wild-type organ mass/body weight ratio. Results are the mean ± SEM, n = 14–25 per group. Datasets were unbiasedly analyzed using ROUT outlier analysis with a maximum false discovery rate (q) of 0.1%. Data were found to be normally distributed via D'Agostino and Pearson test. SDs for heart mass did not significantly differ. Significance of means was analyzed via an ordinary one-way ANOVA (G: F(371) = 55.26 ****p < 0.0001). Post hoc Tukey's test resulted ****p < 0.0001 for all PolgAD257A/D257A-expressing mice compared with wild-type and Parkin–/–, ns, not significant. Analysis and graphs were produced using GraphPad Prism 8.4.3.
Figure 2.
Figure 2.
Behavioral and neuromuscular data of 12-month-old mice. A, Schematic of the pole test. B, Latency values of pole test of 12-month-old mice. Results are the median ± SEM, n = 17–25 per group with an average of five trials per mouse used for analysis. Datasets were unbiasedly analyzed using ROUT outlier analysis with a maximum false discovery rate (q) of 0.1%. Data were found to be non-normally distributed via D'Agostino and Pearson test (with two out of the four groups being found to be non-normally distributed). Significance of medians was analyzed via Kruskal–Wallis nonparametric ANOVA (KW(4,82) = 7.271, p = 0.0637). Post hoc Kruskal–Wallis test for multiple comparisons resulted in no significant differences (ns) between groups. C, Schematic depicting directionality of force (mouse) versus tester in grip strength testing. D, E, Total limb and forelimb strength (in gram*force) normalized to body weight (grams). Results are the mean ± SEM, n = 13–23 per group. Datasets were unbiasedly analyzed using ROUT outlier analysis with a maximum false discovery rate (q) of 0.1%. Data were found to be normally distributed via D'Agostino and Pearson test. Brown–Forsythe test of variance found no difference in SDs. Significance of means was analyzed via an ordinary one-way ANOVA (D: F(3,73) = 10.21 ****p < 0.0001; E: F(3,72) = 3.012 *p = 0.0536). Post hoc Tukey's test was performed and resulted in D: *p = 0.0117 for wild-type versus Parkin–/–, ***p = 0.0003 for wild-type versus PolgAD257A/D257A, and ****p < 0.0001 for wild-type versus Parkin–/–/PolgAD257A/D257A; E: *p = 0.0398 for wild-type versus Parkin–/–/PolgAD257A/D257A, ns, not significant. Forelimb and total limb strength at three, six, and nine months is provided in Extended Data Figure 2-1. F, Openfield data analyzing total distance traveled in the xy direction during the 15-min testing period. Results are the mean ± SEM, n = 17–24 per group. Datasets were unbiasedly analyzed using ROUT outlier analysis with a maximum false discovery rate (q) of 0.1%. Data were found to be normally distributed via D'Agostino and Pearson test. SDs were found to differ significantly per Brown–Forsythe test of variance. Therefore, significance of means was analyzed via a Welch one-way ANOVA (W(5.0,51.85) = 36.71 ****p < 0.0001). Post hoc Dunnett's T3 test resulted in ****p < 0.0001 for wild-type versus all PolgAD257A/D257A-expressing mice and for Parkin–/– versus all PolgAD257A/D257A-expressing mice. G, Average speed of locomotion during 15-min test period. Results are the mean ± SEM, n = 17–24 per group. Datasets were unbiasedly analyzed using ROUT outlier analysis with a maximum false discovery rate (q) of 0.1%. Data were found to be normally distributed via D'Agostino and Pearson test. SDs were not found to differ significantly. Significance of means was analyzed via an ordinary one-way ANOVA (F(5,121) = 52.80 ****p < 0.0001). Post hoc Tukey's test was performed for and resulted in ****p < 0.0001 for wild-type versus all PolgAD257A/D257A-expressing mice and for Parkin–/– versus all PolgAD257A/D257A-expressing mice, ns, not significant. H, Total resting time, defined as a period of four or more seconds with no photobeam breaks, in 15-min test period. Results are the mean ± SEM, n = 17–24 per group. Datasets were unbiasedly analyzed using ROUT outlier analysis with a maximum false discovery rate (q) of 0.1%. Data were found to be normally distributed via D'Agostino and Pearson test. SDs were found to differ significantly per Brown–Forsythe test of variance. Therefore, significance of means was analyzed via a Welch one-way ANOVA (W(5.0,74.83) = 68.21 ****p < 0.0001). Post hoc Dunnett's T3 test resulted in ****p < 0.0001 for wild-type versus all PolgAD257A/D257A-expressing mice and for Parkin–/– versus all PolgAD257A/D257A-expressing mice, ns, not significant. Analysis and graphs were produced using GraphPad Prism 8.4.3. Distance traveled, average speed and total resting time at three, six, and nine months is provided in Extended Data Figure 2-2. Pole test, forelimb and total strength, distance traveled, average speed, and total resting time in male and female mice at 12 months is provided in Extended Data Figure 2-3.
Figure 3.
Figure 3.
Neuropathological analysis of ventral midbrain tissue of 12-month-old mice. A, Representative images of immunohistochemical analysis of 12-month-old ventral midbrain sections. TH+ neurons are stained via, 3'-diaminobenzidine (D)AB (Brown) and Nissl+ (a pan-neuronal marker) are stained blue. B, Stereological quantification of TH+ and Nissl + neurons in the substantia nigra. Quantifications multiplied by factor of two to extrapolate to whole-brain values. Results are the mean ± SEM, n = 6–8 per group. Datasets were unbiasedly analyzed using ROUT outlier analysis with a maximum false discovery rate (q) of 0.1%. No outliers were removed. Data were found to be normally distributed via D'Agostino and Pearson test. Data analyzed using two-way ANOVA (Fc(3,52) = 2.143 p = 0.1060), ns, not significant. C, D, HPLC analysis of striatal dopamine and DOPAC content normalized to total protein concentration. Striatum of right hemisphere of 12-month-old mice were used. Quantifications multiplied by factor of two to extrapolate to whole-brain values. Results are the mean ± SEM, n = 8–9 per group. Datasets were unbiasedly analyzed using ROUT outlier analysis with a maximum false discovery rate (q) of 0.1%. Data were found to be normally distributed via D'Agostino and Pearson test. SDs were found to differ significantly per Brown–Forsythe test of variance. Therefore, significance of means was analyzed via a Welch one-way ANOVA (D: W(3.0,13.86) = 0.6434 p = 0.5999; E: W(3.00,15.59) = 3.661 *p = 0.0357). Post hoc Dunnett's T3 test resulted in no significant differences between groups, ns, not significant. E, HPLC analysis of striatal 3MT content normalized to total protein concentration. Striatum of right hemisphere of 12-month-old mice were used. Quantifications multiplied by factor of two to extrapolate to whole-brain values. Results are the median ± SEM, n = 8–9 per group. Datasets were unbiasedly analyzed using ROUT outlier analysis with a maximum false discovery rate (q) of 0.1%. Data were found to be non-normally distributed per D'Agostino and Pearson test. Significance of medians was analyzed via Kruskal–Wallis nonparametric ANOVA (KW(4,33) = 13.17, *p = 0.0043). Post hoc Kruskal–Wallis test for multiple comparisons resulted in **p = 0.0024 for wild-type versus PolgAD257A/D257A and **p = 0.0042 for Parkin–/– versus PolgAD257A/D257A, ns, not significant. F–H, HPLC analysis of striatal HVA, norepinephrine, and epinephrine content normalized to total protein concentration. Striatum of right hemisphere of 12-month-old mice were used. Quantifications multiplied by factor of two to extrapolate to whole-brain values. Results are the median ± SEM, n = 8–9 per group. Datasets were unbiasedly analyzed using ROUT outlier analysis with a maximum false discovery rate (q) of 0.1%. Data were found to be normally distributed via D'Agostino and Pearson test. SDs were not found to differ significantly. Significance of means was analyzed via an ordinary one-way ANOVA (G: F(3,29) = 1.2 p = 0.3050; H: F(3,28) = 2.4 p = 0.0868; H: F(2,25) = 0.3 p = 0.7653), ns, not significant. I, J, HPLC analysis of striatal 5HT and 5HIAA, a 5HT metabolite, content normalized to total protein concentration. Striatum of right hemisphere of 12-month-old mice were used. Quantifications multiplied by factor of two to extrapolate to whole-brain values. Results are the median ± SEM, n = 8–9 per group. Datasets were unbiasedly analyzed using ROUT outlier analysis with a maximum false discovery rate (q) of 0.1%. Data were found to be normally distributed via D'Agostino and Pearson test. SDs were not found to differ significantly. Significance of means was analyzed via an ordinary one-way ANOVA (J: F(3,29) = 0.8779 p = 0.4642; K: F(3,28) = 1.529 p = 0.2286), ns, not significant. K, DOPAC-dependent dopamine turnover as assessed by (DOPAC+HVA)/dopamine. Significance of means analyzed via ordinary one-way ANOVA (F(2,29) = 4.367 *p = 0.0118). Post hoc Tukey's test resulted in *p = 0.0208 for Parkin–/– versus Parkin–/–/PolgAD257A/D257A, ns, not significant. L, 3MT-dependent dopamine turnover as assessed by (3MT+HVA)/dopamine. Significance of means analyzed via ordinary one-way ANOVA (F(2,29) = 6.282 **p = 0.0020). Post hoc Tukey's test resulted in *p = 0.0310 for wild-type versus Parkin–/–/PolgAD257A/D257A, *p = 0.0254 for Parkin–/– versus PolgAD257A/D257A, and **p = 0.0049 for Parkin–/– versus Parkin–/–/PolgAD257A/D257A, ns, not significant. M, Serotonin (5HT) turnover as assessed by 5HIAA/5HT. Significance of means analyzed via ordinary one-way ANOVA (F(2,29) = 6.449 **p = 0.0118). Post hoc Tukey's test resulted in *p = 0.0195 for wild-type versus PolgAD257A/D257A, *p = 0.0355 for wild-type versus Parkin–/–/PolgAD257A/D257A, *p = 0.0121 for Parkin–/– versus PolgAD257A/D257A, and **p = 0.0222 for Parkin–/– versus Parkin–/–/PolgAD257A/D257A, ns, not significant. Analysis and graphs were produced using GraphPad Prism 8.4.3.
Figure 4.
Figure 4.
Neuropathological analysis of striatal tissue of 12-month-old mice. A–C, HPLC analysis of olfactory bulb dopamine, DOPAC, and norepinephrine content normalized to total protein concentration. Olfactory bulb of right hemisphere of 12-month-old mice were used. Quantifications multiplied by factor of two to extrapolate to whole-brain values. Results are the mean ± SEM, n = 8–9 per group. Datasets were unbiasedly analyzed using ROUT outlier analysis with a maximum false discovery rate (q) of 0.1%. Data were found to be normally distributed via D'Agostino and Pearson test. SDs were not found to differ significantly. Significance of means was analyzed via an ordinary one-way ANOVA (A: F(3,32) = 9.4 ***p = 0.0001; B: F(3,32) = 2.4 ****p < 0.00001; C: F(3,32) = 5.886 **p = 0.0026). Post hoc Tukey's test resulted in A: **p = 0.046 for wild-type versus PolgAD257A/D257A, ***p = 0.0002 for wild-type versus Parkin–/–/PolgAD257A/D257A, and *p = 0.0116 for Parkin–/– versus Parkin–/–/PolgAD257A/D257A; B: *p = 0.0154 for wild-type versus Parkin–/–, ****p < 0.00001 for wild-type versus PolgAD257A/D257A and for wild-type versus Parkin–/–/PolgAD257A/D257A, and *p = 0.0153 for Parkin–/– versus Parkin–/–/PolgAD257A/D257A; C: **p = 0.0015 for wild-type versus Parkin–/–/PolgAD257A/D257A, ns, not significant. D, HPLC analysis of olfactory bulb HVA content normalized to total protein concentration. Olfactory bulb of right hemisphere of 12-month-old mice were used. Quantifications multiplied by factor of two to extrapolate to whole-brain values. Results are the mean ± SEM, n = 8–9 per group. Datasets were unbiasedly analyzed using ROUT outlier analysis with a maximum false discovery rate (q) of 0.1%. Data were found to be normally distributed via D'Agostino and Pearson test. SDs were found to differ significantly per Brown–Forsythe test of variance. Therefore, significance of means was analyzed via a Welch one-way ANOVA (D: W(3.0,16.71) = 28.77 ****p < 0.00001). Post hoc Dunnett's T3 test resulted in ***p = 0.046 for wild-type versus PolgAD257A/D257A, ****p < 0.00001 for wild-type versus Parkin–/–/PolgAD257A/D257A, **p = 0.0031 for Parkin–/– versus PolgAD257A/D257A, and ***p = 0.0007 Parkin–/– versus Parkin–/–/PolgAD257A/D257A, ns, not significant. E, F, HPLC analysis of olfactory bulb 5HT and 5HIAA content normalized to total protein concentration. Olfactory bulb of right hemisphere of 12-month-old mice were used. Quantifications multiplied by factor of two to extrapolate to whole-brain values. Results are the mean ± SEM, n = 8–9 per group. Datasets were unbiasedly analyzed using ROUT outlier analysis with a maximum false discovery rate (q) of 0.1%. Data were found to be normally distributed via D'Agostino and Pearson test. SDs were not found to differ significantly. Significance of means was analyzed via an ordinary one-way ANOVA (E: F(3,32) = 7.249 ***p = 0.0008; F: F(3,32) = 17.31 ****p < 0.00001). Post hoc Tukey's test resulted in E: ***p = 0.004 for wild-type versus Parkin–/–/PolgAD257A/D257A; F: **p = 0.0056 for wild-type versus Parkin–/–, ****p < 0.00001 for wild-type versus PolgAD257A/D257A and for wild-type versus Parkin–/–/PolgAD257A/D257A, ns, not significant. G, DOPAC-dependent dopamine turnover as assessed by (DOPAC+HVA)/dopamine. Significance of means analyzed via ordinary one-way ANOVA (F(3,32) = 12.41 ****p < 0.00001). Post hoc Tukey's test resulted in *p = 0.0260 for wild-type versus Parkin–/–, ****p < 0.00001 for wild-type versus PolgAD257A/D257A and for wild-type versus Parkin–/–/PolgAD257A/D257A, ns, not significant. H, Serotonin (5HT) turnover as assessed by 5HIAA/5HT. Data were found to be normally distributed via D'Agostino and Pearson test. SDs were found to differ significantly per Brown–Forsythe test of variance. Therefore, significance of means was analyzed via a Welch one-way ANOVA (D: W(3.0,17.32) = 4.339 *p = 0.0142). Post hoc Dunnett's T3 test resulted in no significant differences (ns) between groups. Analysis and graphs were produced using GraphPad Prism 8.4.3.
Figure 5.
Figure 5.
Steady-state expression of mitochondrial and mitophagy markers. A, Representative Western blot illustrating mitochondrial marker expression in ventral midbrain tissue of 12-month-old mice. B–E, Quantification of Western blot mitochondrial marker expression analysis of ventral midbrain tissue of 12-month-old mice. Results are the mean ± SEM, n = 8 mice per group. Experiments were run in a minimum of experimental triplicate with the average of results used for analysis. ImageJ was used for optical density analysis. Quantifications were normalized to β-actin to account for loading differences and then to wild-type values to normalize against batch effect. Datasets were unbiasedly analyzed using ROUT outlier analysis with a maximum false discovery rate (q) of 0.1%. Data were found to be normally distributed via D'Agostino and Pearson test. SDs were found to differ significantly per Brown–Forsythe test, likely because of batch effect. Therefore, significance of means was analyzed via a Welch one-way ANOVA (B: W(3.0,13.89) = 0.2700 p = 0.8459; C: W(3,13.58) = 0.7985 p = 0.5156; D: W(3,13.98) = 3.607 *p = 0.0406; E: W(3,13.0) = 1.145 p = 0.3068). Post hoc Dunnett's T3 multiple comparisons test was conducted on D data and resulted in no significant (ns) differences between groups. F, G, Quantification of Western blot mitochondrial marker expression analysis of ventral midbrain tissue of 12-month-old mice. Results are the mean ± SEM, n = 8 per group. Experiments were run in a minimum of experimental triplicate with the average of results used for analysis. ImageJ was used for optical density analysis. Quantifications were normalized to β-actin to account for loading differences and then to wild-type values to normalize against batch effect. Datasets were unbiasedly analyzed using ROUT outlier analysis with a maximum false discovery rate (q) of 0.1%. Data were found to be normally distributed via D'Agostino and Pearson test. SDs were not found to differ significantly per Brown–Forsythe test. Significance of means was analyzed via ordinary one-way ANOVA (F: F(3,28) = 9.173 ***p = 0.0002; G: F(3,28) = 0.4631 p = 0.9739). Post hoc Tukey's test for data in F resulted in **p = 0.0064 for wild-type versus PolgAD257A/D257A, **p = 0.0039 for wild-type versus Parkin–/–/PolgAD257A/D257A, **p = 0.0059 for Parkin–/– versus PolgAD257A/D257A, and **p = 0.0036 for Parkin–/– versus Parkin–/–/PolgAD257A/D257A, ns, not significant. H, Representative Western blot illustrating blot mitophagy marker expression analysis in ventral midbrain tissue of 12-month-old mice. I, Quantification of Western blot mitophagy marker expression analysis of ventral midbrain tissue of 12-month-old mice. Results are the mean ± SEM, n = 8 per group. Experiments were run in a minimum of experimental triplicate with the average of results used for analysis. ImageJ was used for optical density analysis. Quantifications were normalized to β-actin to account for loading differences and then to wild-type values to normalize against batch effect. Datasets were unbiasedly analyzed using ROUT outlier analysis with a maximum false discovery rate (q) of 0.1%. Data were found to be normally distributed via D'Agostino and Pearson test. Data were analyzed using two-way ANOVA (Fc(3,28) = 0.2892 p = 0.8328). Uncropped Western blottings for this figure are provided in Extended Data Figure 5-1. J, Mitochondrial Complex I activity of ventral midbrain tissue of 12-month-old mice. Results are the mean ± SEM, n = 6 per group. Experiments were run in experimental duplicate on one plate with the average of results used for analysis. Datasets were unbiasedly analyzed using ROUT outlier analysis with a maximum false discovery rate (q) of 0.1%. Data were found to be normally distributed via Shapiro–Wilk test. Data were analyzed using two-way ANOVA with repeated measures F(15,18) = 32.18 p < 0.0001 and a Geisser–Greenhouse's ε correction of 0.6569. Post hoc Tukey's multiple comparisons test was performed and demonstrated no significant (ns) differences between group. The results are as follows: p = 0.2569 for wild-type versus Parkin–/–/; p = 0.9281 for wild-type versus PolgAD257A/D257A, p = 0.995 for wild-type versus Parkin–/– versus PolgAD257A/D257A, and p = 0.9522 for PolgAD257A/D257A versus Parkin–/–/PolgAD257A/D257A. K, Mitochondrial Complex IV activity of ventral midbrain tissue of 12-month-old mice. Results are the mean ± SEM, n = 6 per group. Experiments were run in experimental duplicate on one plate with the average of results used for analysis. Datasets were unbiasedly analyzed using ROUT outlier analysis with a maximum false discovery rate (q) of 0.1%. Data were found to be normally distributed via Shapiro–Wilk test. Data were analyzed using two-way ANOVA with repeated measures F(15,18) = 1.758 p = 0.1269 and a Geisser–Greenhouse's ε correction of 0.6621. Post hoc Tukey's multiple comparisons test was performed and demonstrated no significant (ns) differences between group. The results are as follows: p = 0.6015 for wild-type versus Parkin–/–/; p = 0.2631 for wild-type versus PolgAD257A/D257A, p = 0.9822 for wild-type versus Parkin–/– versus PolgAD257A/D257A, and p = 0.3271 for PolgAD257A/D257A versus Parkin–/–/PolgAD257A/D257A. Analysis and graphs were produced using GraphPad Prism 9.4.1. The levels of the parkin substrates, NLRP3, AIMP2 normalized to β-actin are presented in Extended Data Figure 5-2.
Figure 6.
Figure 6.
Analysis of mtDNA copy number in aged mice. A, Schematic denoting mtDNA genome and loci of selected primer sets. Sequences are listed in Materials and Methods. B–G, qRT-PCR analysis of ventral midbrain tissue of 12-month-old mice. Results are the mean ± SEM, n = 6 mice per group. Experiments run in experimental triplicate with the average of results used for analysis. Quantifications were normalized to GAPDH (COXI6520 to GAPDH_Neuron, while COXI6620, CYTB, ND4, and Dloop3' were normalized to GAPDH_PNAS) to normalize variance across groups and then to wild-type values to normalize against batch effect. Datasets were unbiasedly analyzed using ROUT outlier analysis with a maximum false discovery rate (q) of 0.1%. SDs did not significantly differ per Brown–Forsythe test. Significance of means analyzed via ordinary one-way ANOVA (B: F(3,26) = 11.33 ****p < 0.00001; C: F(3,26) = 7.042 **p = 0.0013; D: F(3,26) = 5.130 **p = 0.0064; E: F(3,26) = 1.831 p = 0.1663). Post hoc Tukey's test resulted in B: ****p < 0.00001 for wild-type versus PolgAD257A/D257A, **p = 0.0033 for wild-type versus Parkin–/–/PolgAD257A/D257A, and *p = 0.0236 for Parkin–/– versus PolgAD257A/D257A; C: **p = 0.0011 for wild-type versus PolgAD257A/D257A, and *p = 0.0205 for wild-type versus Parkin–/–/PolgAD257A/D257A; D: **p = 00.37 for wild-type versus PolgAD257A/D257A, ns, not significant. F, qRT-PCR analysis of Dloop of ventral midbrain tissue of 12-month-old mice. Results are the mean ± SEM, n = 6 mice per group. Experiments run in experimental triplicate with the average of results used for analysis. Quantifications were normalized to GAPDH (GAPDH_PNAS primer set) to normalize variance across groups and then to wild-type values to normalize against batch effect. Datasets were unbiasedly analyzed using ROUT outlier analysis with a maximum false discovery rate (q) of 0.1%. SDs did significantly differ per Brown–Forsythe test. Significance of means were analyzed via a Welch one-way ANOVA W(3.0,13.01) = 14.24 ***p = 0.0002. Post hoc Dunnett's T3 multiple comparisons test resulted in *p = 0.0237 for wild-type versus PolgAD257A/D257A, *p = 0.0142 for wild-type versus Parkin–/–/PolgAD257A/D257A, *p = 0.0159 for Parkin–/– versus PolgAD257A/D257A, and **p = 0.0088 for Parkin–/– versus Parkin–/–/PolgAD257A/D257A, ns, not significant. G, qRT-PCR analysis of ventral midbrain tissue of 12-month-old mice. Results are the mean ± SEM, n = 6 mice per group. Experiments run in experimental triplicate with the average of results used for analysis. Quantifications were normalized to GAPDH_PNAS to normalize variance across groups and then to wild-type values to normalize against batch effect. Datasets were unbiasedly analyzed using ROUT outlier analysis with a maximum false discovery rate (q) of 0.1%. Data were analyzed using the mixed effects model (REML) with matching factors across rows Fc(3,80) = 2.660, Fr(3,80) = 27.20 ****p < 0.00001, Fi(9,80) = 10.64 ****p < 0.00001. Post hoc Tukey's test resulted in ****p < 0.00001 for Dloop3' amplification for wild-type versus PolgAD257A/D257A, wild-type versus Parkin–/–/PolgAD257A/D257A, Parkin–/– versus PolgAD257A/D257A, and Parkin–/– versus Parkin–/–/PolgAD257A/D257A, ns, not significant. Analysis and graphs were produced using GraphPad Prism 8.4.3.

Similar articles

Cited by

References

    1. Andres-Mateos E, Perier C, Zhang L, Blanchard-Fillion B, Greco TM, Thomas B, Ko HS, Sasaki M, Ischiropoulos H, Przedborski S, Dawson TM, Dawson VL (2007) DJ-1 gene deletion reveals that DJ-1 is an atypical peroxiredoxin-like peroxidase. Proc Natl Acad Sci U S A 104:14807–14812. 10.1073/pnas.0703219104 - DOI - PMC - PubMed
    1. Bonifati V (2014) Genetics of Parkinson's disease–state of the art, 2013. Parkinsonism Relat Disord 20 [Suppl 1]:S23–S28. 10.1016/S1353-8020(13)70009-9 - DOI - PubMed
    1. Brahmachari S, et al. . (2019) Parkin interacting substrate zinc finger protein 746 is a pathological mediator in Parkinson's disease. Brain 142:2380–2401. 10.1093/brain/awz172 - DOI - PMC - PubMed
    1. Charnay Y, Léger L (2010) Brain serotonergic circuitries. Dialogues Clin Neurosci 12:471–487. - PMC - PubMed
    1. Dai Y, Kiselak T, Clark J, Clore E, Zheng K, Cheng A, Kujoth GC, Prolla TA, Maratos-Flier E, Simon DK (2013) Behavioral and metabolic characterization of heterozygous and homozygous POLG mutator mice. Mitochondrion 13:282–291. 10.1016/j.mito.2013.03.006 - DOI - PMC - PubMed

Publication types