. 2022 Nov 15;9(6):ENEURO.0164-22.2022.
doi: 10.1523/ENEURO.0164-22.2022. Print 2022 Nov-Dec.

Chronic Intermittent Ethanol Exposure Dysregulates Nucleus Basalis Magnocellularis Afferents in the Basolateral Amygdala

Affiliations

Chronic Intermittent Ethanol Exposure Dysregulates Nucleus Basalis Magnocellularis Afferents in the Basolateral Amygdala

Sarah E Sizer et al. eNeuro. .

Abstract

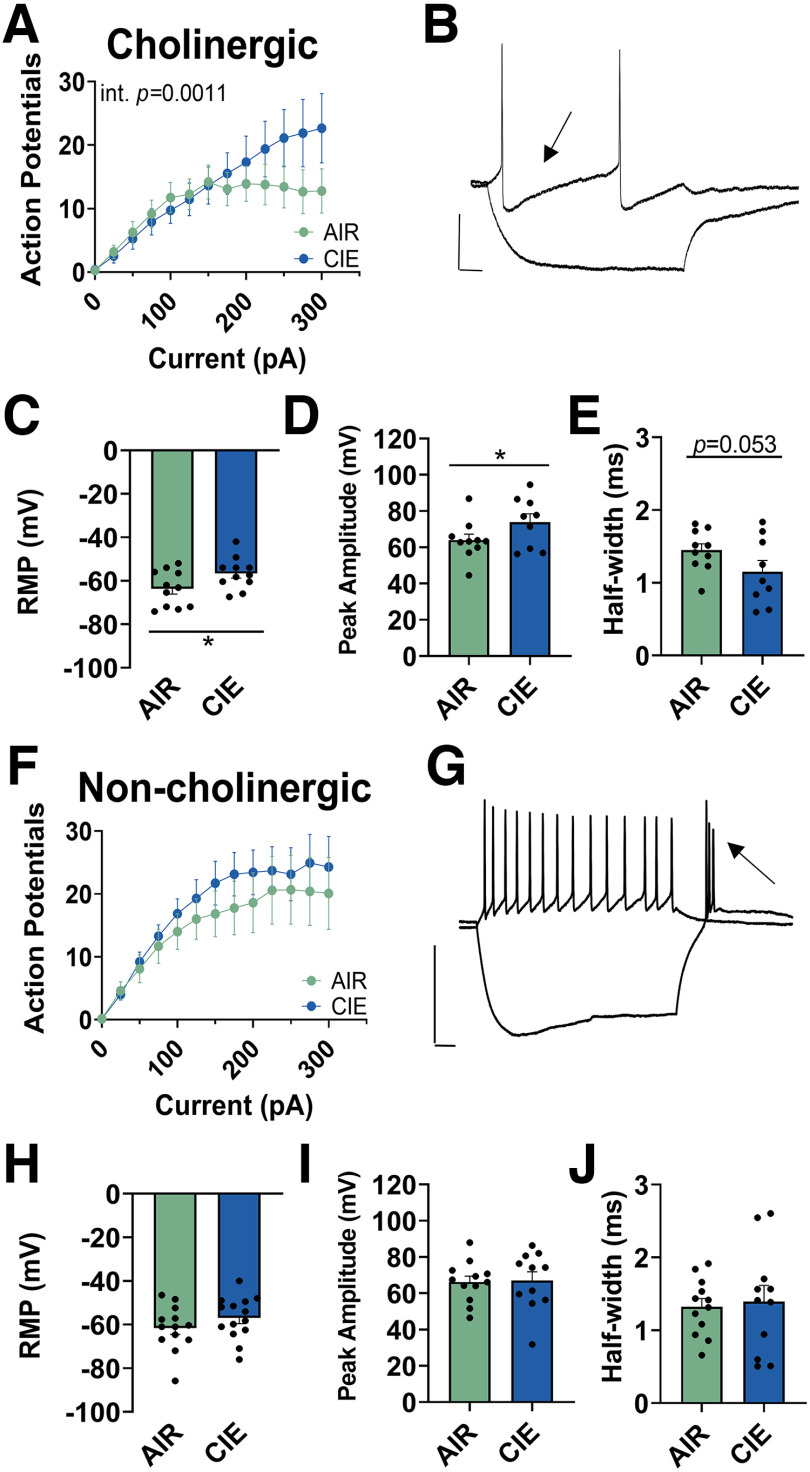
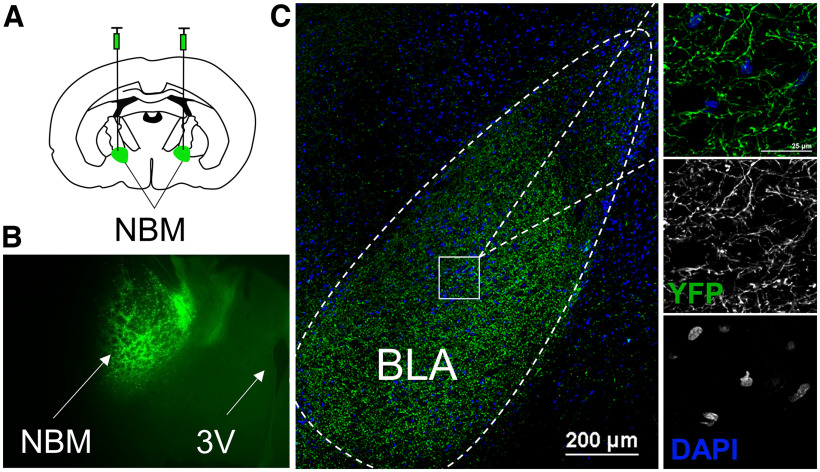
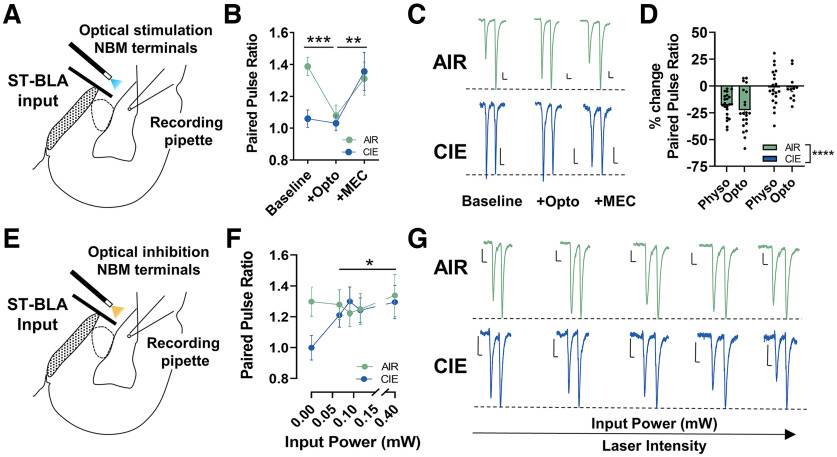
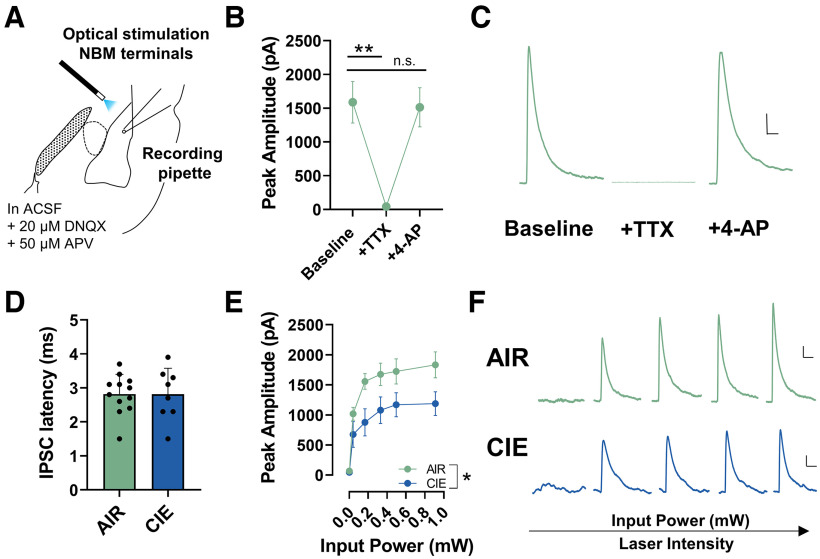
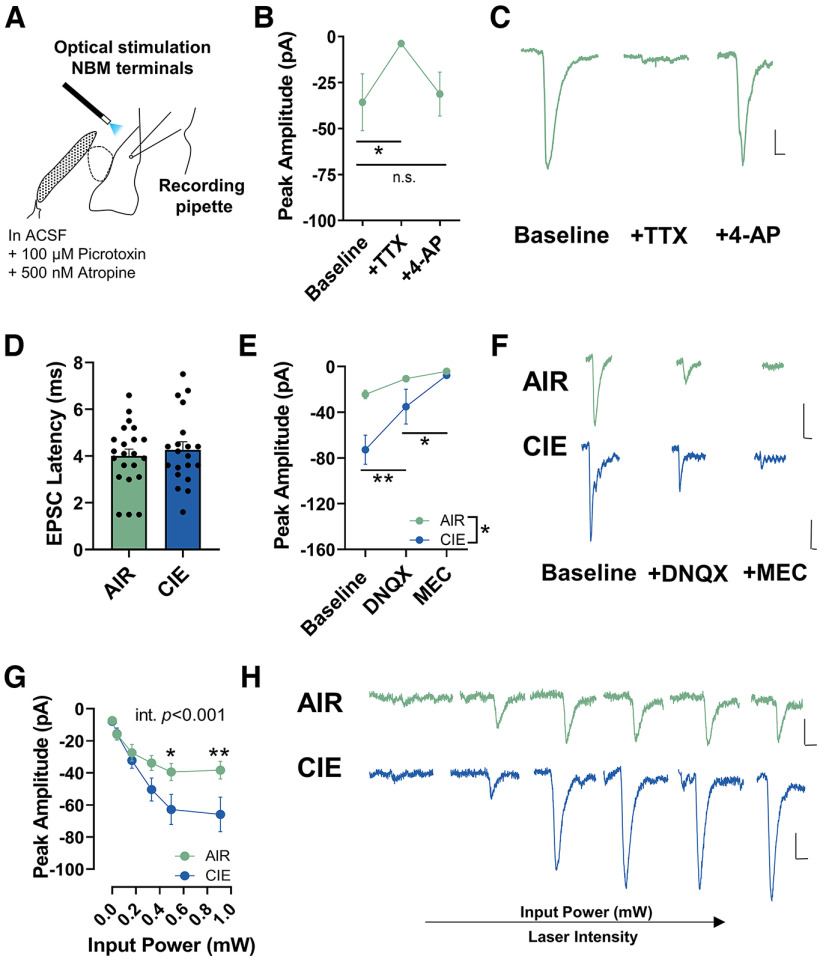
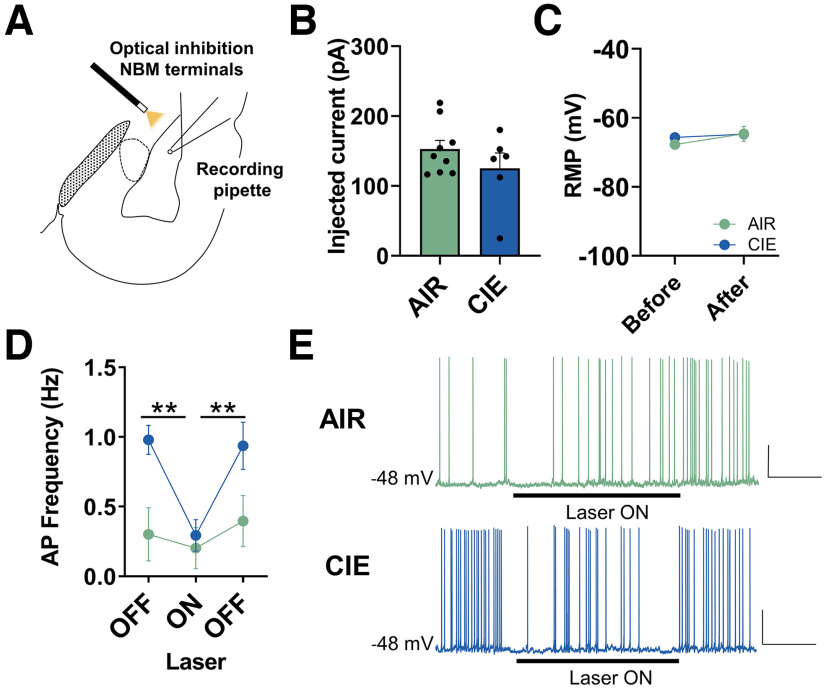
Nucleus basalis magnocellularis (NBM) cholinergic projections to the basolateral amygdala (BLA) regulate the acquisition and consolidation of fear-like and anxiety-like behaviors. However, it is unclear whether the alterations in the NBM-BLA circuit promote negative affect during ethanol withdrawal (WD). Therefore, we performed ex vivo whole-cell patch-clamp electrophysiology in both the NBM and the BLA of male Sprague Dawley rats following 10 d of chronic intermittent ethanol (CIE) exposure and 24 h of WD. We found that CIE exposure and withdrawal enhanced the neuronal excitability of NBM putative "cholinergic" neurons. We subsequently used optogenetics to directly manipulate NBM terminal activity within the BLA and measure cholinergic modulation of glutamatergic afferents and BLA pyramidal neurons. Our findings indicate that CIE and withdrawal upregulate NBM cholinergic facilitation of glutamate release via activation of presynaptic nicotinic acetylcholine receptors (AChRs). Ethanol withdrawal-induced increases in NBM terminal activity also enhance BLA pyramidal neuron firing. Collectively, our results provide a novel characterization of the NBM-BLA circuit and suggest that CIE-dependent modifications to NBM afferents enhance BLA pyramidal neuron activity during ethanol withdrawal.

Keywords: GABA; acetylcholine; amygdala; basal forebrain; ethanol; glutamate.


Conflict of interest statement

The authors declare no competing financial interests.

Figures

Figure 1.
Figure 1.
Withdrawal enhances the excitability of NBM “cholinergic” neurons. A, CIE exposure and withdrawal increases the excitability of NBM “cholinergic” neurons (n = 11) compared with age-matched AIR controls (n = 11). Repeated-measures mixed-effects analysis, current X exposure interaction (p =0.0011). B, Representative trace of 600-ms current steps of –100 and +25 pA in “cholinergic” neuron, with the arrow denoting the typical long afterhyperpolarization (AHP) duration. C, Cholinergic neurons have increased resting membrane potential (AIR: n = 11, CIE: n = 11, unpaired t test, p =0.024), (D) increased peak amplitude (AIR: n = 10, CIE: n = 9, unpaired t test, p =0.049), and (E) a trend in decreased half-width (AIR: n = 10, CIE: n = 9, unpaired t test, p =0.053) during withdrawal (F) CIE exposure and withdrawal does not alter the excitability of NBM “noncholinergic” neurons (n = 14) compared with AIR controls (n = 13). Repeated-measures mixed-effects analysis (no current X CIE interaction, p =0.94). G, Representative trace of 600-ms current steps of –100 and +25 pA in “noncholinergic” neuron, with the arrow denoting burst firing after hyperpolarizing current ends. Scale bars: y-axis 20 mV and x-axis 50 ms for all traces in figure. H, Noncholinergic neurons show no changes in resting membrane potential (AIR: n = 13, CIE: n = 14, unpaired t test, p =0.119), (I) peak amplitude (AIR: n = 12, CIE: n = 11, unpaired t test, p =0.417), or (J) half-width (AIR: n = 12, CIE: n = 11, unpaired t test, p =0.400) during withdrawal. *p < 0.05. Figure Contributions: Sarah E. Sizer, Michaela E. Price, and Brian C. Parrish performed the experiments. Sarah E. Sizer analyzed the data.
Figure 2.
Figure 2.
Immunohistochemical validation of opsin expression in NBM-BLA projection neurons. A, Schematic illustrating microinjection of AAV5-hSyn-ChR2(H134R)-eYFP into the NBM (AP −1.5 mm, ML ±2.5 mm, DV 7.2 mm). B, Representative fluorescent 4× image of NBM injection site and (C) representative fluorescent 20× image (left) of YFP+ NBM terminal fields in the BLA following a four-week recovery period. 60× images (right) illustrate opsin expression within NBM afferents (YFP) and not the soma of BLA neurons (DAPI). BLA, basolateral amygdala; NBM, nucleus basalis magnocellularis; 3V, third ventricle. Figure Contributions: Sarah E. Sizer, Kimberly F. Raab-Graham, Chelcie F. Heaney, and Samuel H. Barth performed the experiments.
Figure 3.
Figure 3.
Tonic activation of presynaptic nicotinic acetylcholine receptors facilitates pathologic glutamate release at stria terminalis inputs during withdrawal. A, Schematic illustrating placement of electrical stimulation of stria terminalis (ST) afferents and optical stimulation of NBM terminals while recording from BLA pyramidal neurons. B, Optical stimulation (10 Hz, 5 ms) of NBM terminals with 473-nm laser before electrical stimulation of ST afferents increases glutamate release (decreases paired-pulse ratio) in AIR neurons (n = 20), with no effect in CIE neurons (n = 11). Mecamylamine (MEC; nonselective nAChR antagonist; 100 μm) perfusion illustrates presynaptic nicotinic receptors mediate this effect [repeated-measures two-way ANOVA, main effect of laser stimulation + MEC (p =0.0002) and laser X exposure interaction (p =0.012)]. Bonferroni’s post hoc tests show significant differences in AIR: baseline versus opto (***p =0.0004), opto versus MEC (**p =0.0091), and CIE: opto versus MEC (**p =0.0091) and baseline versus MEC (p =0.015). C, Representative traces of paired-pulse ratios (PPRs) in AIR (green) and CIE (purple) neurons. D, Upregulation of synaptic acetylcholine levels with the acetylcholinesterase antagonist physostigmine (0.5 μm) causes similar effects on the PPR as optical stimulation of NBM terminals in AIR and CIE animals (Opto AIR: n = 20 cells, Opto CIE: n = 11 cells, physostigmine AIR: n = 23 cells, physostigmine CIE: n = 21 cells). Two-way ANOVA; significant main effect of CIE (****p <0.0001), no significant effect of method of acetylcholine upregulation (p =0.3202), no significant CIE X acetylcholine interaction (p =0.7769). E, Schematic illustrating placement of electrical stimulation of ST afferents and optical inhibition of NBM terminals. F, 589-nm laser inhibition (10 Hz, 5 ms) of NBM terminals at increasing laser intensity (measured as input power, mW) reverses pathologic glutamate release at ST afferents in CIE neurons (n = 14), with no effect in AIR neurons (n = 12). Mixed-effects analysis, laser X exposure interaction. Bonferroni’s post hoc tests reveal a significant increase in PPR in CIE neurons following laser inhibition of NBM terminals relative to baseline (*p <0.05 see Results for stats). G, Representative traces of PPRs in AIR and CIE neurons with increasing laser intensity. Scale bars: y-axis 20 pA and x-axis 20 ms for all traces in figure. Figure Contributions: Sarah E. Sizer performed the experiments. Sarah E. Sizer analyzed the data.
Figure 4.
Figure 4.
CIE exposure and withdrawal decrease IPSCs elicited from NBM GABAergic terminals. A, Schematic illustrating placement of 473-nm laser for optical activation of NBM GABAergic neuron terminals. B, TTX (1 μm) perfusion occludes IPSCs and is fully recovered with 4-AP (1 mm) perfusion in AIR neurons (n = 4 cells; repeated-measures one-way ANOVA; p =0.002), Bonferroni’s multiple comparisons test (baseline vs TTX, **p =0.002 and baseline vs 4-AP, p >0.999). C, Representative traces of optically evoked IPSCs in AIR neurons following TTX and 4-AP perfusion. D, No significant differences in IPSC latency between AIR (n = 12) and CIE (n = 8) neurons (unpaired t test, p = 0.400). E, Activation of GABAergic terminals with 473-nm laser (5 ms) elicits a large GABAergic IPSC in AIR (n = 12) and CIE (n = 8) neurons. Mixed effects analysis showed main effect of laser stimulation (p <0.001), main effect of exposure (*p =0.048), and laser X exposure interaction (p =0.031). F, Representative traces of AIR neurons and CIE neurons. Scale bars: y-axis 200 pA and x-axis 50 ms for all traces in figure. Figure Contributions: Sarah E. Sizer performed the experiments. Sarah E. Sizer analyzed the data.
Figure 5.
Figure 5.
CIE exposure and withdrawal potentiates monosynaptic glutamatergic and nicotinic EPSCs elicited from NBM terminals. A, Schematic illustrating placement of 473-nm laser for optical activation of NBM terminals while recording from BLA pyramidal neurons. B, TTX (1 μm) perfusion occludes EPSC and is fully recovered with 4-AP (1 mm) perfusion in AIR neurons (n = 5 cells; repeated-measures one-way ANOVA; p =0.050), Bonferroni’s multiple comparisons test (baseline vs TTX, *p = 0.049 and baseline vs 4-AP, p =0.99). C, Representative traces of NBM EPSCs following TTX and 4-AP perfusion. D, No significant differences in EPSC latency in AIR (n = 20) and CIE (n = 22) neurons (unpaired t test, p =0.282) EPSC latency and TTX + 4-AP data indicate that the optically evoked NBM EPSCs are monosynaptic. E, DNQX (AMPA/kainate receptor antagonist; 20 μm) and mecamylamine (MEC; nonselective nicotinic receptor antagonist; 100 μm) ablate optically evoked EPSC in AIR (n = 7) and CIE neurons (n = 5). Mixed-effects analysis, main effect of CIE exposure (*p =0.016), main effect of DNQX + MEC (p =0.0002), CIE X DNQX + MEC interaction (p =0.0303). Bonferroni’s multiple comparisons test (CIE baseline vs DNQX, **p =0.0047 and DNQX vs MEC, *p =0.0395). F, Representative traces of AIR and CIE EPSCs following DNQX and MEC perfusion. G, Optical excitation of NBM terminals at increasing laser intensities [measured as input power (mW)] in AIR (n = 22) and CIE (n = 20) neurons. Mixed-effects analysis showed main effect of laser (p <0.0001), trending main effect of exposure (p =0.051), and laser X exposure interaction (p =0.0005). Bonferroni’s post hoc tests show significant differences in AIR and CIE EPSCs at the two highest laser intensities (*p =0.023 and **p <0.002). H, Representative traces of EPSCs in AIR and CIE neurons. Scale bars: y-axis 20 pA and x-axis 20 ms for all traces in figure. Figure Contributions: Sarah E. Sizer performed the experiments. Sarah E. Sizer analyzed the data.
Figure 6.
Figure 6.
NBM terminal activity upregulates BLA pyramidal neuron firing following CIE exposure and withdrawal. A, Schematic illustrating placement of 589-nm laser for optical inhibition of NBM terminals expressing halorhodopsin while recording from BLA pyramidal neurons. BLA pyramidal neurons were injected with depolarizing current to a membrane potential of –48 mV. Action potential firing frequency was recorded for 30-s baseline (laser OFF), during 60-s laser inhibition of NBM terminals (laser ON), and 30-s recovery (laser ON). B, Depolarizing current injected to reach –48-mV membrane potential is not significantly different in AIR (n = 9 cells) and CIE neurons (n = 6 cells), unpaired t test (p =0.131). C, Resting membrane potential (RMP) was not significantly different between AIR-exposed and CIE-exposed neurons, or before and after application of depolarizing current during recording (repeated-measures two-way ANOVA, see Results). D, Inhibition of NBM terminals with 589-nm laser (10 Hz, 60 s) reverses increases in BLA pyramidal neuron firing in CIE neurons (n = 6), with no effect in AIR neurons (n = 9). Two-way repeated-measures ANOVA, main effect of laser (p =0.001), trending effect of exposure (p =0.052), and laser X exposure interaction (p =0.036). Bonferroni’s post hoc tests show significant differences between laser OFF (baseline) and laser ON (**p =0.001) and laser ON versus laser OFF (recovery; **p =0.003). E, Representative traces of AIR neurons and CIE neurons. Scale bars: y-axis 20 mV and x-axis20 s for all traces in figure. Figure Contributions: Sarah E. Sizer performed the experiments. Sarah E. Sizer analyzed the data.
Figure 7.
Figure 7.
Schematic representation of NBM afferents in AIR control rodents (left) and CIE and withdrawal rodents (right). CIE and withdrawal potentiate NBM cholinergic neuron excitability and increases NBM cholinergic terminal activity in the BLA. The upregulation of NBM acetylcholine release in the BLA tonically activates presynaptic nAChRs and facilitates glutamate release from stria terminalis afferents. CIE also decreases release from NBM GABAergic terminals in the BLA. The effects together appear to enhance BLA pyramidal neuron excitability. Figure Contributions: Sarah E. Sizer and Brian McCool composed the figure.

Similar articles

Cited by

References

    1. Aitta-Aho T, Hay YA, Phillips BU, Saksida LM, Bussey TJ, Paulsen O, Apergis-Schoute J (2018) Basal forebrain and brainstem cholinergic neurons differentially impact amygdala circuits and learning-related behavior. Curr Biol 28:2557–2569.e4. - PubMed
    1. Allen TG, Abogadie FC, Brown DA (2006) Simultaneous release of glutamate and acetylcholine from single magnocellular “cholinergic” basal forebrain neurons. J Neurosci 26:1588–1595. - PMC - PubMed
    1. Alonso A, Khateb A, Fort P, Jones BE, Mühlethaler M (1996) Differential oscillatory properties of cholinergic and noncholinergic nucleus basalis neurons in guinea pig brain slice. Eur J Neurosci 8:169–182. - PubMed
    1. Andreasen M, Hablitz JJ (1994) Paired-pulse facilitation in the dentate gyrus: a patch-clamp study in rat hippocampus in vitro. J Neurophysiol 72:326–336. 10.1152/jn.1994.72.1.326 - DOI - PubMed
    1. Arieli E, Gerbi R, Shein-Idelson M, Moran A (2020) Temporally-precise basolateral amygdala activation is required for the formation of taste memories in gustatory cortex. J Physiol 598:5505–5522. - PubMed

LinkOut - more resources