

Prediction of Retention Time and Collision Cross Section (CCSH+, CCSH-, and CCSNa+) of Emerging Contaminants Using Multiple Adaptive Regression Splines
- PMID: 36280383
- PMCID: PMC9709913
- DOI: 10.1021/acs.jcim.2c00847
Prediction of Retention Time and Collision Cross Section (CCSH+, CCSH-, and CCSNa+) of Emerging Contaminants Using Multiple Adaptive Regression Splines
Abstract
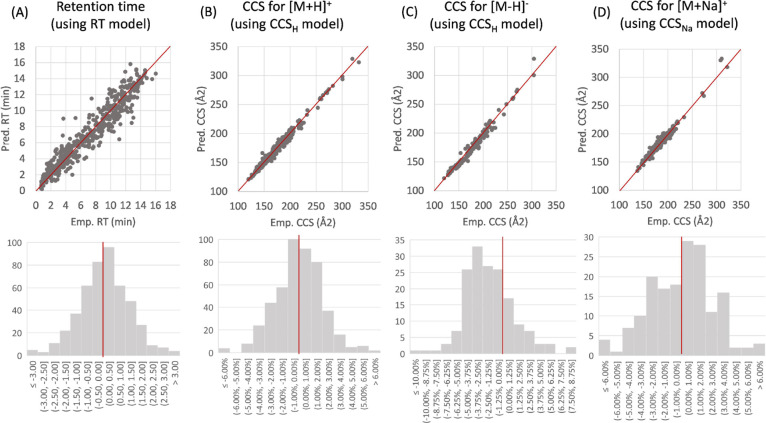
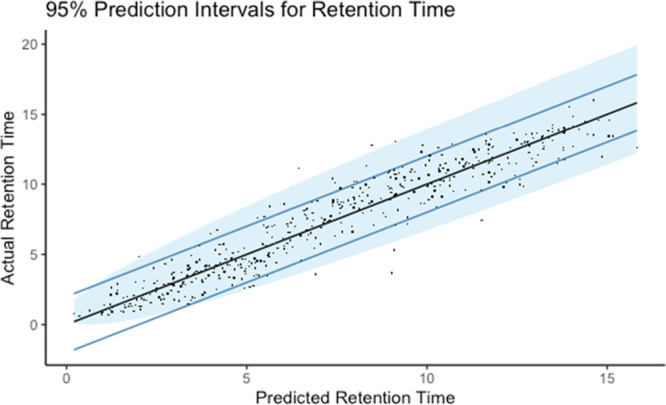
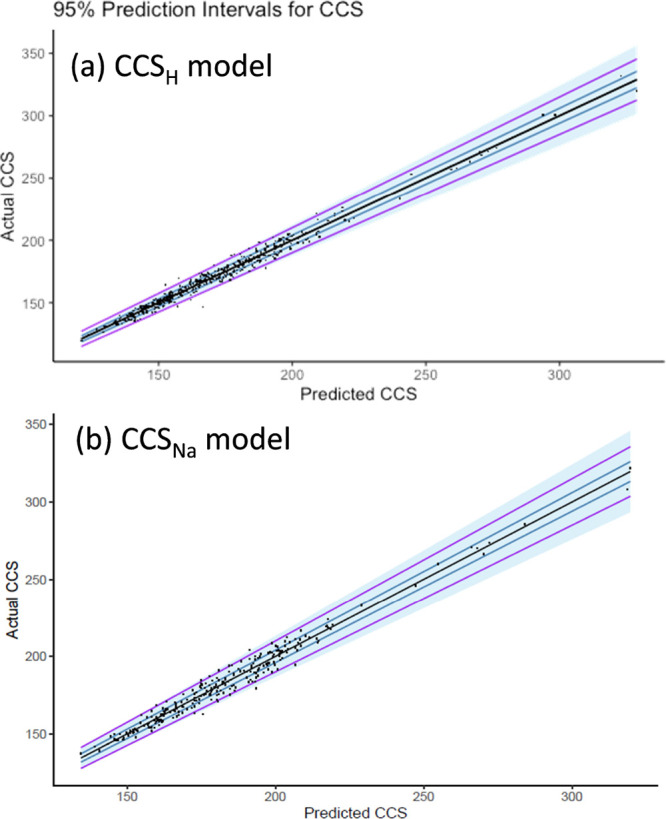
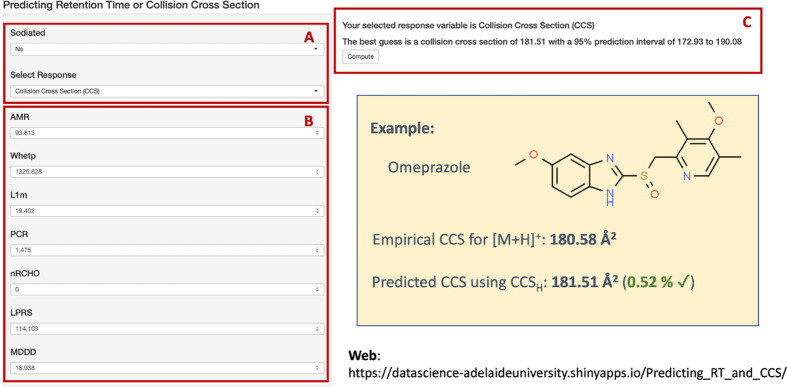
Ultra-high performance liquid chromatography coupled to ion mobility separation and high-resolution mass spectrometry instruments have proven very valuable for screening of emerging contaminants in the aquatic environment. However, when applying suspect or nontarget approaches (i.e., when no reference standards are available), there is no information on retention time (RT) and collision cross-section (CCS) values to facilitate identification. In silico prediction tools of RT and CCS can therefore be of great utility to decrease the number of candidates to investigate. In this work, Multiple Adaptive Regression Splines (MARS) were evaluated for the prediction of both RT and CCS. MARS prediction models were developed and validated using a database of 477 protonated molecules, 169 deprotonated molecules, and 249 sodium adducts. Multivariate and univariate models were evaluated showing a better fit for univariate models to the experimental data. The RT model (R2 = 0.855) showed a deviation between predicted and experimental data of ±2.32 min (95% confidence intervals). The deviation observed for CCS data of protonated molecules using the CCSH model (R2 = 0.966) was ±4.05% with 95% confidence intervals. The CCSH model was also tested for the prediction of deprotonated molecules, resulting in deviations below ±5.86% for the 95% of the cases. Finally, a third model was developed for sodium adducts (CCSNa, R2 = 0.954) with deviation below ±5.25% for 95% of the cases. The developed models have been incorporated in an open-access and user-friendly online platform which represents a great advantage for third-party research laboratories for predicting both RT and CCS data.
Conflict of interest statement
The authors declare no competing financial interest.
Figures
Similar articles
-
Revealing the differences in collision cross section values of small organic molecules acquired by different instrumental designs and prediction models.Anal Chim Acta. 2022 Oct 9;1229:340361. doi: 10.1016/j.aca.2022.340361. Epub 2022 Sep 9. Anal Chim Acta. 2022. PMID: 36156233
-
Identification of Nonvolatile Migrates from Food Contact Materials Using Ion Mobility-High-Resolution Mass Spectrometry and in Silico Prediction Tools.J Agric Food Chem. 2022 Aug 3;70(30):9499-9508. doi: 10.1021/acs.jafc.2c03615. Epub 2022 Jul 20. J Agric Food Chem. 2022. PMID: 35856243 Free PMC article.
-
Prediction of collision cross section and retention time for broad scope screening in gradient reversed-phase liquid chromatography-ion mobility-high resolution accurate mass spectrometry.J Chromatogr A. 2018 Mar 23;1542:82-88. doi: 10.1016/j.chroma.2018.02.025. Epub 2018 Feb 15. J Chromatogr A. 2018. PMID: 29472071
-
Advancing the large-scale CCS database for metabolomics and lipidomics at the machine-learning era.Curr Opin Chem Biol. 2018 Feb;42:34-41. doi: 10.1016/j.cbpa.2017.10.033. Epub 2017 Nov 12. Curr Opin Chem Biol. 2018. PMID: 29136580 Review.
-
Improving the discovery of secondary metabolite natural products using ion mobility-mass spectrometry.Curr Opin Chem Biol. 2018 Feb;42:160-166. doi: 10.1016/j.cbpa.2017.12.004. Epub 2017 Dec 26. Curr Opin Chem Biol. 2018. PMID: 29287234 Free PMC article. Review.
Cited by
-
Collision cross section measurement and prediction methods in omics.J Mass Spectrom. 2023 Sep;58(9):e4973. doi: 10.1002/jms.4973. Epub 2023 Aug 24. J Mass Spectrom. 2023. PMID: 37620034 Free PMC article. Review.
-
Online and Offline Prioritization of Chemicals of Interest in Suspect Screening and Non-targeted Screening with High-Resolution Mass Spectrometry.Anal Chem. 2024 Mar 5;96(9):3707-3716. doi: 10.1021/acs.analchem.3c05705. Epub 2024 Feb 21. Anal Chem. 2024. PMID: 38380899 Free PMC article. Review.
-
Prediction of a Large-Scale Database of Collision Cross-Section and Retention Time Using Machine Learning to Reduce False Positive Annotations in Untargeted Metabolomics.Metabolites. 2023 Feb 15;13(2):282. doi: 10.3390/metabo13020282. Metabolites. 2023. PMID: 36837901 Free PMC article.
-
Do experimental projection methods outcompete retention time prediction models in non-target screening? A case study on LC/HRMS interlaboratory comparison data.Analyst. 2025 Aug 4;150(16):3567-3577. doi: 10.1039/d5an00323g. Analyst. 2025. PMID: 40671565 Free PMC article.
-
Collision Cross Section Prediction with Molecular Fingerprint Using Machine Learning.Molecules. 2022 Sep 29;27(19):6424. doi: 10.3390/molecules27196424. Molecules. 2022. PMID: 36234961 Free PMC article.
References
-
- Hernández F.; Bakker J.; Bijlsma L.; de Boer J.; Botero-Coy A. M.; Bruinen de Bruin Y.; Fischer S.; Hollender J.; Kasprzyk-Hordern B.; Lamoree M.; López F. J.; ter Laak T. L.; van Leerdam J. A.; Sancho J. V.; Schymanski E. L.; de Voogt P.; Hogendoorn E. A. The Role of Analytical Chemistry in Exposure Science: Focus on the Aquatic Environment. Chemosphere 2019, 222, 564–583. 10.1016/j.chemosphere.2019.01.118. - DOI - PubMed
-
- Hollender J.; van Bavel B.; Dulio V.; Farmen E.; Furtmann K.; Koschorreck J.; Kunkel U.; Krauss M.; Munthe J.; Schlabach M.; Slobodnik J.; Stroomberg G.; Ternes T.; Thomaidis N. S.; Togola A.; Tornero V. High Resolution Mass Spectrometry-Based Non-Target Screening Can Support Regulatory Environmental Monitoring and Chemicals Management. Environ. Sci. Eur. 2019, 31, 42.10.1186/s12302-019-0225-x. - DOI
-
- Schymanski E. L.; Singer H. P.; Slobodnik J.; Ipolyi I. M.; Oswald P.; Krauss M.; Schulze T.; Haglund P.; Letzel T.; Grosse S.; Thomaidis N. S.; Bletsou A.; Zwiener C.; Ibáñez M.; Portolés T.; De Boer R.; Reid M. J.; Onghena M.; Kunkel U.; Schulz W.; Guillon A.; Noyon N.; Leroy G.; Bados P.; Bogialli S.; Stipaničev D.; Rostkowski P.; Hollender J. Non-Target Screening with High-Resolution Mass Spectrometry: Critical Review Using a Collaborative Trial on Water Analysis. Anal. Bioanal. Chem. 2015, 407, 6237–6255. 10.1007/s00216-015-8681-7. - DOI - PubMed
-
- Alygizakis N. A.; Oswald P.; Thomaidis N. S.; Schymanski E. L.; Aalizadeh R.; Schulze T.; Oswaldova M.; Slobodnik J. NORMAN Digital Sample Freezing Platform: A European Virtual Platform to Exchange Liquid Chromatography High Resolution-Mass Spectrometry Data and Screen Suspects in “Digitally Frozen” Environmental Samples. TrAC, Trends Anal. Chem. 2019, 115, 129–137. 10.1016/j.trac.2019.04.008. - DOI
Publication types
MeSH terms
Substances
LinkOut - more resources
Full Text Sources
Miscellaneous
