

Excess mortality and protected areas during the COVID-19 pandemic: Evidence from Italian municipalities
- PMID: 36280518
- PMCID: PMC9558647
- DOI: 10.1016/j.healthpol.2022.10.005
Excess mortality and protected areas during the COVID-19 pandemic: Evidence from Italian municipalities
Abstract
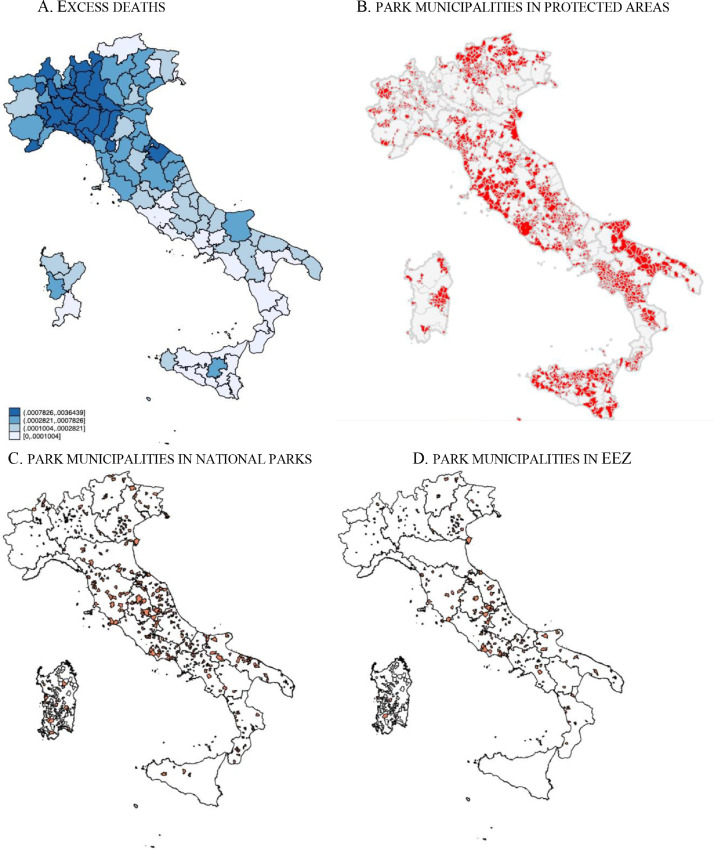
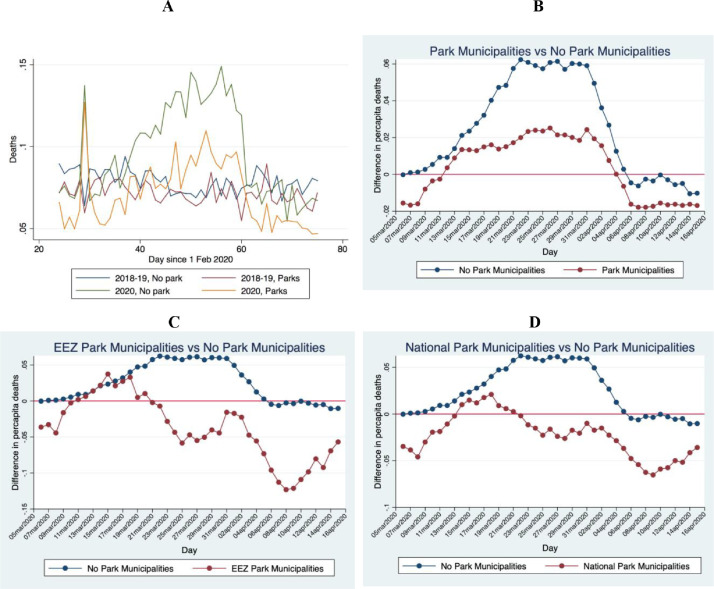
There is widespread debate on the drivers of heterogeneity of adverse COVID-19 pandemic outcomes and, more specifically, on the role played by context-specific factors. We contribute to this literature by testing the role of environmental factors as measured by environmentally protected areas. We test our research hypothesis by showing that the difference between the number of daily deaths per 1,000 inhabitants in 2020 and the 2018-19 average during the pandemic period is significantly lower in Italian municipalities located in environmentally protected areas such as national parks, regional parks, or Environmentally Protected Zones. After controlling for fixed effects and various concurring factors, municipalities with higher share of environmentally protected areas show significantly lower mortality during the pandemic than municipalities that do not benefit from such environmental amenities.
Keywords: COVID-19; Mortality; Pollution; Protected areas.
Copyright © 2022. Published by Elsevier B.V.
Conflict of interest statement
Declaration of Competing Interest None.
Figures
References
-
- Gordon–Larsen P., Nelson M., Page P., et al. Inequality in the built environment underlies key health disparities in physical activity and obesity. Pediatrics. 2006;117(2):417–424. - PubMed
-
- Humpel N., Owen N., Leslie E. Environmental factors associated with adults’ participation in physical activity: a review. Am J Prev Med. 2002;22(3):188–199. - PubMed
-
- Mowen A. Active Living Research; 2010. Parks, playgrounds and active living. Retrieved February 16, 2012.
MeSH terms
LinkOut - more resources
Full Text Sources
Medical
