. 2022 Oct 24;13(1):6330.
doi: 10.1038/s41467-022-33819-3.

Function of bidirectional sensitivity in the otolith organs established by transcription factor Emx2

Affiliations

Function of bidirectional sensitivity in the otolith organs established by transcription factor Emx2

Young Rae Ji et al. Nat Commun. .

Abstract

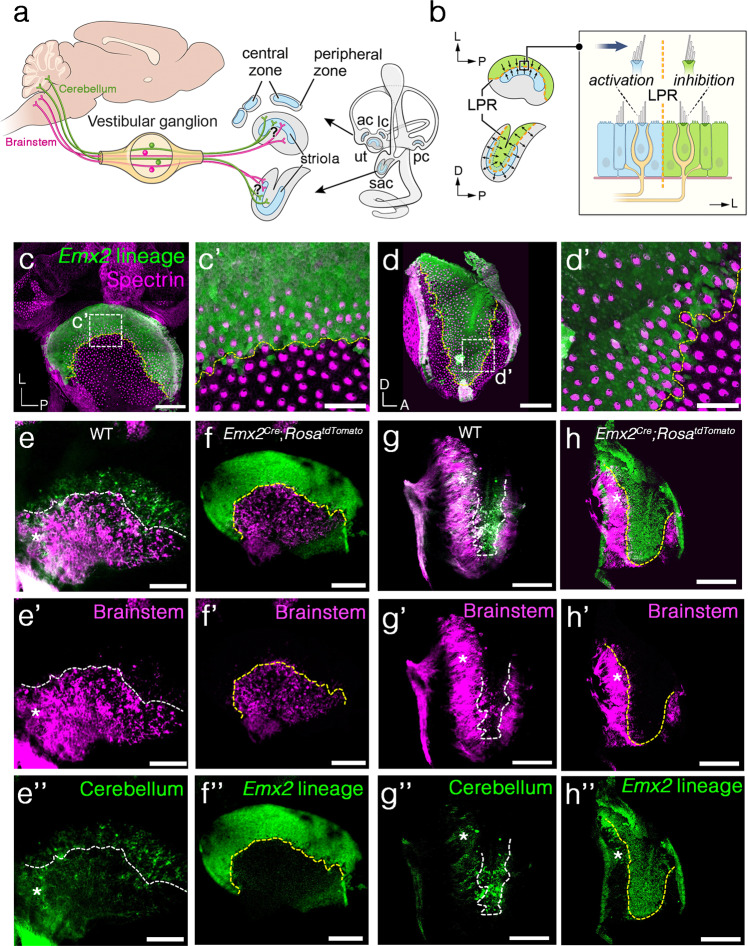
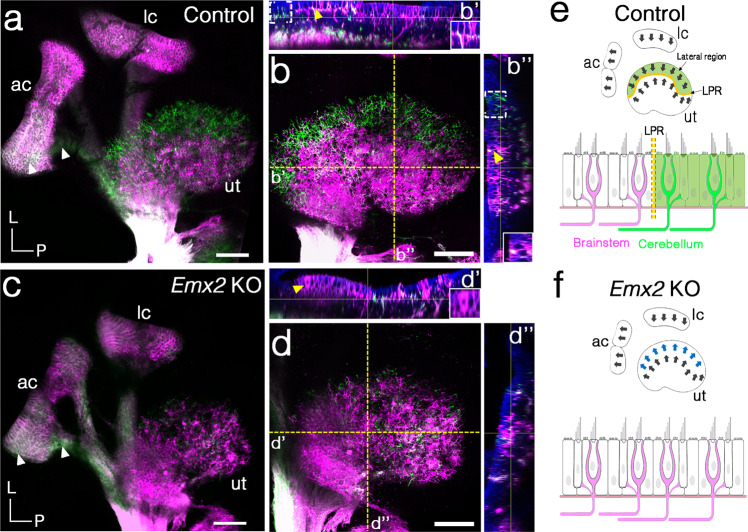
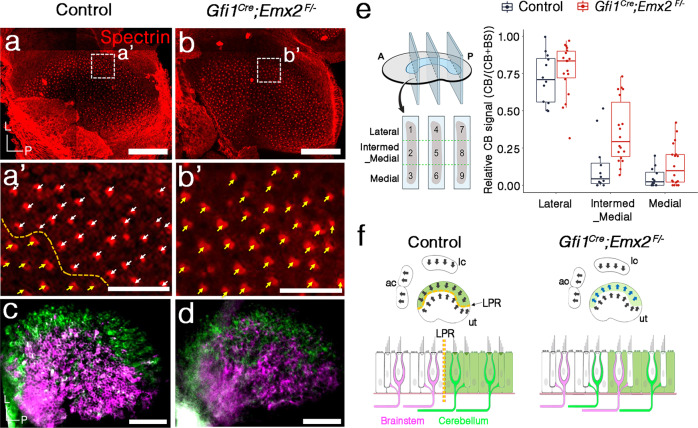
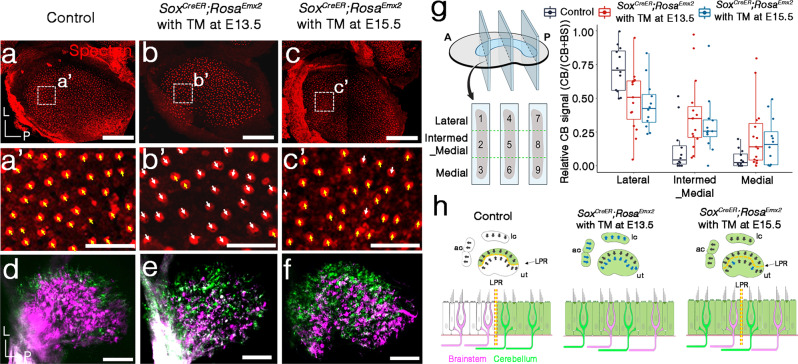
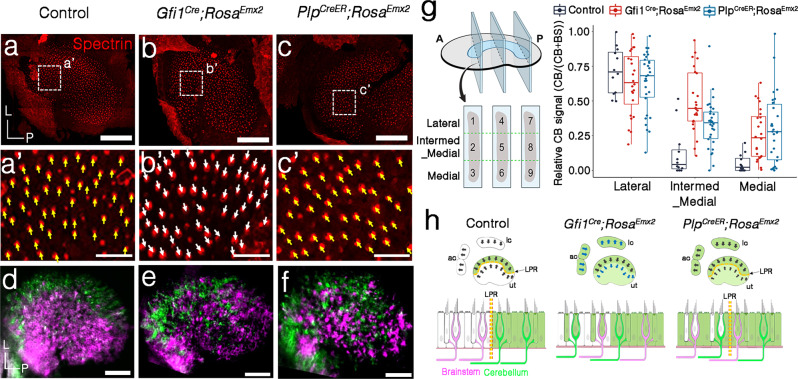
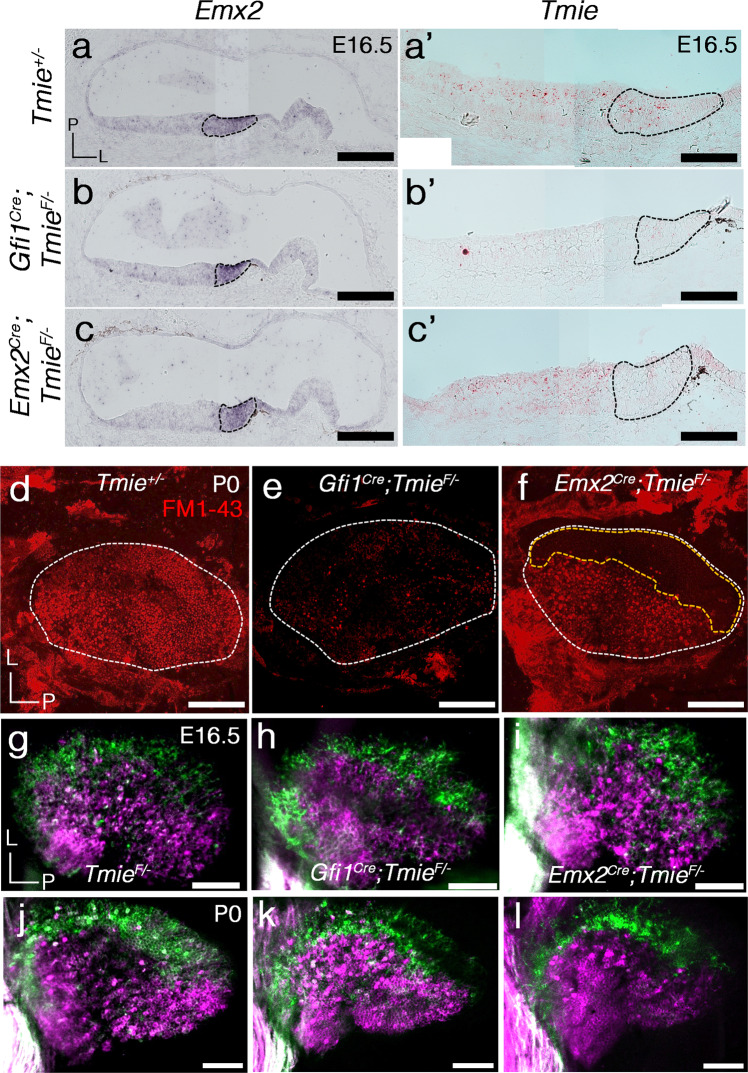
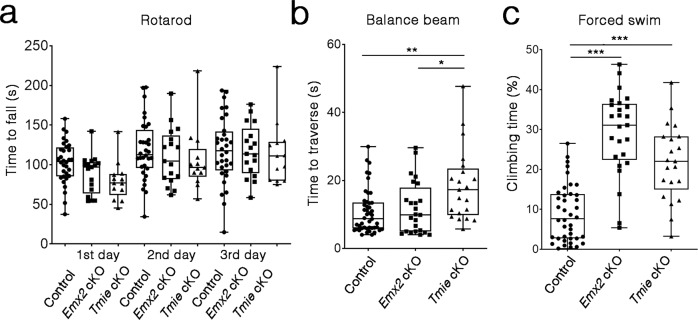
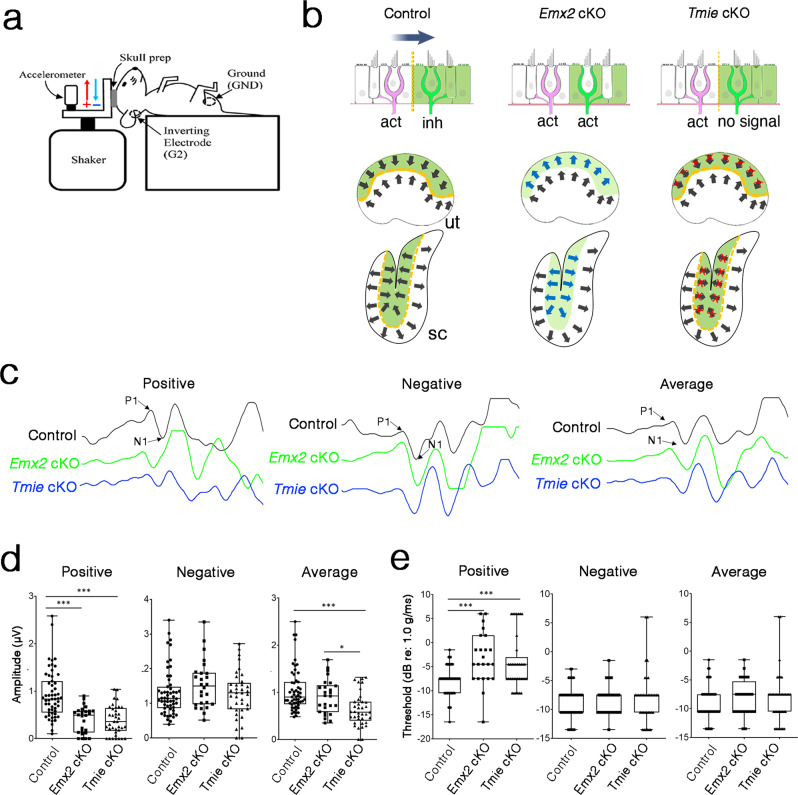
Otolith organs of the inner ear are innervated by two parallel afferent projections to the brainstem and cerebellum. These innervations were proposed to segregate across the line of polarity reversal (LPR) within each otolith organ, which divides the organ into two regions of hair cells (HC) with opposite stereociliary orientation. The relationship and functional significance of these anatomical features are not known. Here, we show regional expression of Emx2 in otolith organs, which establishes LPR, mediates the neuronal segregation across LPR and constitutes the bidirectional sensitivity function. Conditional knockout (cKO) of Emx2 in HCs lacks LPR. Tmie cKO, in which mechanotransduction was abolished selectively in HCs within the Emx2 expression domain also lacks bidirectional sensitivity. Analyses of both mutants indicate that LPR is specifically required for mice to swim comfortably and to traverse a balance beam efficiently, but LPR is not required for mice to stay on a rotating rod.


Conflict of interest statement

The authors declare no competing interests.

Figures

Fig. 1
Fig. 1. The afferent neuronal innervation pattern is segregated across the LPR in the mouse maculae.
a Schematic of the segregated neuronal innervation pattern in maculae but the location of the segregation border is unclear. b Schematic illustrating the border of Emx2 expression domain (green) demarcates the LPR in maculae. A directional stimulus (arrow in inset) across the LPR simultaneously activates and inhibits two different groups of HCs. c, d Emx2 lineage domain (green) in the utricle (c, c’, n = 2) and saccule (d, d’, n = 2) of Emx2cre/+; RosatdTomato inner ears, which encompasses HCs with opposite hair bundle orientation from the rest of the macula based on anti-β spectrin staining (magenta). The location of the tallest rod of the bundle, the kinocilium, is devoid of anti-β spectrin staining. The border of the lineage domain demarcates the LPR (yellow dotted line). eh” Neuronal tracing using NeuroVue® Red (magenta)- and NeuroVue® Maroon (green)-soaked filter papers inserted into the brainstem and cerebellum of hemi-sectioned heads of wildtype (ee”, gg”, WT) and Emx2cre/+; RosatdTomato (ff”, hh”) embryos at E16.5, respectively. Neurons projected to the brainstem (e’, g’, magenta) and cerebellum (e”, g”, green) are segregated in the utricle (e, n = 5) and saccule (g, n = 3). White dotted line roughly separates most of the green and magenta dye labels. Limited dye labeling from the brainstem (f’, h’, magenta) is evident in the Emx2 lineage domain (f”, h”, green) of the lateral utricle and inner saccule (f, n = 2; h, n = 2). White asterisk in ee” and gg” represents regions that show mixed labeling of both dyes that has been described previously. White asterisk in hh” represents a dorsal–posterior region of the saccule and where Emx2 lineage domain expands beyond the LPR, where the two dye labels overlap (gg”, white asterisk). ac anterior crista, lc lateral crista, pc posterior crista, sac saccule, ut utricle. Orientation: D dorsal, L lateral, P posterior. Scale bar = 100 μm in ch; 25 μm in c’, d’.
Fig. 2
Fig. 2. Failure of cerebellar afferent neurons to reach Emx2 KO maculae.
ab”, cd” Neuronal tracing with NeuroVue® Red (magenta)- and NeuroVue® Maroon (green)-soaked filter papers inserted into the respective brainstem and cerebellum of hemi-sectioned heads of control (ab”) and Emx2 KO (cd”) at E16.5. b, d are higher magnifications of the maximum-intensity projection images of a, c. b’, b”, d’, d” are z-stack images of areas indicated with yellow dotted lines in b, d, respectively. In control, dye traced from the cerebellum (green) is segregated to the lateral region of utricle (b’, b”, white dotted bracket), whereas tracing from the brainstem is largely restricted to the medial utricle (a, n = 5). Dyes from both cerebellum and brainstem reached the sensory epithelium with some appeared vacuolated, which are likely due to surrounding bodies of HCs (b’, b”, yellow arrowheads, see insets). In Emx2 KO utricles (c, n = 7), dye traced from the cerebellum (green) is much reduced and failed to reach the lateral utricle, whereas this region is filled with dye traced from the brainstem (magenta), some of which show a vacuolated appearance (d’, yellow arrowhead, inset), similar to controls (b’, b”). White arrowheads in a, c point to dye from the cerebellum reaching the anterior crista in both control and Emx2 KO ears. e, f Schematic summary of hair bundle orientation and afferent neuronal innervation pattern in control and Emx2 KO utricles. Anterior crista (ac), lateral crista (lc), and utricle (ut). Scale bar = 100 μm in ad.
Fig. 3
Fig. 3. Minor disruption of neuronal innervation pattern in HC-specific Emx2 KO.
ab’ Hair bundle orientation across the LPR (yellow dotted line) of control (a, a’) is missing in the Emx2 cKO. Hair bundle orientation in the lateral region of Emx2 cKO utricles is similar to its medial region (b, b’, yellow arrows, n = 4) and is reversed from the lateral region of controls (a, a’, white arrows, n = 4). c, d Neuronal dye tracing from the cerebellum (green) and brainstem (magenta) are not well segregated in the Emx2 cKO utricles (d, n = 9) as in controls (c, n = 5). e Boxplot showing the quantification of the cb signal from the cerebellum over total signals from cerebellum and brainstem using z-stacks of confocal images in nine selected regions according to the “Methods” section. In control utricles, the relative cb signal is significantly higher in the lateral utricle (areas #1, 4, and 7) than the intermediate_medial (areas #2, 5, and 8) and the medial region (areas #3, 6, and 9) (Dunn’s pairwise tests, z = 3.83, p = 2.6E−04; z = 4.45, p = 2.5E−05). Similar decrease in relative cb signal was observed from lateral to intermediate-medial and the medial regions of Emx2 cKO utricles (Dunn’s pairwise tests, z = 3.57, p = 7.1E−04; z = 5.90, p = 1.1E−08). However, the relative cb signal in the intermed_medial region is higher in Emx2 cKO utricles, compared to control (Kruskal–Wallis H(1) = 9.82, p = 1.7E−03). Controls, n = 4; Gfi1Cre; Emx2F/−, n = 6. The two-sided Kruskal–Wallis rank-sum test and two-sided post hoc Dunn’s pairwise comparison tests were applied. In boxplots, boxes represent the interquartile range (IQR), and the thick lines inside show the median. Whiskers denote the lowest and highest values within 1.5 times the IQR. f Schematic summary of hair bundle orientation and afferent neuronal innervation pattern in control and Gfi1CreEmx2F/− (Emx2 cKO) utricles. Gfi1Cre; Emx2F/− utricles show uni-directional HCs and mild disruption of the neuronal innervation pattern, compared to controls. Scale bar = 100 μm in ad; 25 μm in a’b’. Source data are provided as a Source data file.
Fig. 4
Fig. 4. Ectopic Emx2 expression disrupts afferent neuronal segregation pattern independent of hair bundle orientation in the utricle.
a, a’ Anti-β spectrin antibody (red) staining of a control utricle showing hair bundles in the medial region pointing towards the lateral (a’, yellow arrows, n = 4). Compared to the control, Sox2CreER; RosaEmx2 utricle administered with tamoxifen (TM) at E13.5 (b) shows mostly reversed hair bundle orientation in the medial region (b’, white arrows, n = 4) but TM administration at E15.5 (c) resulted in largely normal hair bundle orientation (c’, yellow arrows, n = 4) with a few HCs showing opposite orientation (white arrows). df Segregated afferent innervation of control (d, n = 5) is disrupted in Sox2CreER; RosaEmx2 utricles administered with TM at E13.5 (e, n = 10) and E15.5 (f, n = 7). g The relative cb signal was significantly lower in the lateral region (Dunn’s pairwise tests, control vs. E13.5, n = 5, z = 2.59, p = 0.015; control vs. E15.5, n = 4, z = 3.04, p = 0.007) but higher in the intermed–medial region of Sox2CreER; RosaEmx2 utricles treated with tamoxifen at E13.5 or E15.5 when compared to controls (n = 4) (Dunn’s pairwise tests, control vs. E13.5, z = −3.0, p = 0.008; control vs. E15.5, z = −2.23, p = 0.039). Thus, the decrease in cb signals between the lateral and intermed_medial regions were not significant in Sox2CreER; RosaEmx2 utricles administered with tamoxifen at either E13.5 or E15.5 (Dunn’s pairwise tests, E13.5, z = 1.21, p = 0.23; E15.5, z = 1.90, p = 0.12). The two-sided Dunn’s pairwise comparison tests were applied. In boxplots, boxes represent the interquartile range (IQR), and the thick lines inside show the median. Whiskers denote the lowest and highest values within 1.5 times the IQR. h Schematic summary of hair bundle orientation and innervation pattern in control and Sox2CreER; RosaEmx2 utricles and cristae administered with tamoxifen at E13.5 or E15.5. Scale bar = 100 μm in ac, df; 25 μm in a’c’. Source data are provided as a Source data file.
Fig. 5
Fig. 5. Afferent neuronal segregation pattern in the utricle is affected by ectopic Emx2 expression in either HCs or supporting cells.
ac’ Anti-β spectrin staining showing hair bundle orientation in the medial utricle is towards the lateral, which is reversed in Gfi1Cre; RosaEmx2 utricles (b’, white arrows, n = 3) but normal in PlpCreER; RosaEmx2 utricles (c’, yellow arrows, n = 5). df Neuronal dye tracing from the cerebellum (green) and brainstem (magenta) in control (d, n = 5), Gfi1Cre; RosaEmx2 (e, n = 10) and PlpCreER; RosaEmx2 utricles treated with tamoxifen at E13.5 (f, n = 13). Neuronal dye tracing is not well segregated in Gfi1Cre; RosaEmx2 (e) and PlpCreER; RosaEmx2 utricles (f) as in controls (d). g The reduction in relative cb signal from lateral to intermed_medial region was not significant for Gfi1Cre; RosaEmx2 utricles (n = 8) but significant for PlpCreER; RosaEmx2 utricles (n = 10) (Dunn’s pairwise tests, Gfi1Cre; RosaEmx2, z = 1.70, p = 0.09; PlpCreER; RosaEmx2, z = 4.29, p = 3.5E−05). Compared to controls (n = 4), there was no significant difference in the relative cb signal in the lateral region but a significant increase in the intermed_medial and medial regions of Gfi1Cre; RosaEmx2 and PlpCreER; RosaEmx2 utricles (control vs. Gfi1Cre; RosaEmx2, intermed_medial, z = -4.45, p = 2.6E−05; medial, z = -3.37, p = 0.0011; control vs. PlpCreER; RosaEmx2, intermed_medial, z = -2.65, p = 0.012; medial, z = -3.53, p = 0.0013). The two-sided Dunn’s pairwise comparison tests were applied. In boxplots, boxes represent the interquartile range (IQR), and the thick lines inside show the median. Whiskers denote the lowest and highest values within 1.5 times the IQR. h Schematic of hair bundle orientation and afferent neuronal innervation pattern in control, Gfi1Cre; RosaEmx2 and PlpCreER; RosaEmx2 utricles. Scale bar = 100 μm in ac, df; 25 μm in a’c’. Source data are provided as a Source data file.
Fig. 6
Fig. 6. Loss of mechanotransduction in HCs of Tmie cKO utricles does not affect its neuronal segregation pattern.
ac’ Emx2 (ac) and Tmie (a’c’) transcripts in sections of Tmie+/− (a, a’, n = 3), Gfi1cre; TmieF/− (b, b’, n = 2), and Emx2cre; TmieF/− (Tmie cKO, c, c’, n = 3) utricles. Tmie transcripts are absent in the entire sensory epithelium of Gfi1cre; TmieF/− utricle (b’) but are absent only in the Emx2-positive lateral region (ac, black dotted region) of Emx2cre; TmieF/− utricles (c’). df FM1-43 staining in live utricles of Tmie+/− (d, n = 5), Gfi1cre; TmieF/− (e, n = 3), and Emx2cre; TmieF/− (f, n = 4) inner ears at P0. FM1-43 is present in the entire sensory epithelium of Tmie+/− (d), absent in Gfi1cre; TmieF/− (e) and absent only in the lateral region of Emx2cre; TmieF/− utricle (f). Outline of the utricular macula is demarcated with a white dotted line and the lateral region is marked with a yellow dotted line (df). gl Utricles with dye tracing from the cerebellum (green) and brainstem (magenta) of TmieF/− (g, n = 2; j, n = 3), Gfi1cre; TmieF/− (h, n = 2; k, n = 3), and Emx2cre; TmieF/− (i, n = 3; l, n = 3) at E16.5 day (gi) and P0 (jl). Neuronal tracing from the cerebellum and the brainstem labeling the respective lateral and medial utricle are normal among all three genotypes at E16.5 and P0. Scale bar = 200 μm in a, applies to b, c; 100 μm in a’, applies to b’, c’, and 100 μm in dl.
Fig. 7
Fig. 7. Panic swimming for both Emx2 cKO and Tmie cKO but Tmie cKO not Emx2 cKO showed deficits on balance beam.
a Quantification of time for mice to fall off a rotating rod, which accelerated from 5 to 40 r.p.m. over a 5-min period. The performance of Emx2 cKO and Tmie cKO are similar to controls on all three days of the trial (control, n = 32; Emx2 cKO n = 17; Tmie cKO n = 13). b Quantification of time required for control, Emx2 cKO, and Tmie cKO to traverse an 80-cm distance on a 6-mm-wide beam. Tmie cKO mutants took longer to cross the beam but Emx2 cKO were normal, compared to controls (control n = 46; Emx2 cKO n = 24; Tmie cKO n = 21, Emx2 cKO vs Tmie cKO *p = 0.02, control vs Tmie cKO **p = 0.0013). c Percentages of time mice spent climbing during the 1-min period in water. Emx2 cKO and Tmie cKO spent more time climbing in water, when compared to controls (control n = 40; Emx2 cKO n = 25; Tmie cKO n = 21; control vs Emx2 cKO ***p = 2.64E−13 and Tmie cKO ***p = 1.72E−07). In boxplots, boxes represent the interquartile range (IQR), and the thick lines inside show the median. Whiskers denote the lowest and highest values within 1.5 times the IQR. The one-way ANOVA with multiple comparisons was applied. Source data are provided as a Source data file.
Fig. 8
Fig. 8. Reduced amplitudes and increased thresholds of VsEP in Emx2 cKO and Tmie cKO mice.
a Schematic diagram of the apparatus for VsEP measurement (Reprinted from Jones, T. A. & Jones, S. A. Short latency compound action potentials from mammalian gravity receptor organs. Hear. Res. 136, 75–85 (1999). Copyright (1999), with permission from Elsevier). Red arrow indicates the direction of positive stimulation towards the nose, and the blue arrow indicates the direction of negative stimulation towards the occipit. b Hair bundle orientation of the maculae and neural responses to a directional stimulus (large gray arrow) in the utricle of controls, Emx2 cKO and Tmie cKO. c VsEP waveforms at maximal jerk stimulus (+6 dB) from positive and negative directions of stimulation as well as the average of the two stimulus directions for controls (black), Emx2 cKO (green) and Tmie cKO (blue). d Summary of VsEP amplitudes measured at maximal jerk stimulus (+6 dB) of positive and negative directions of stimulation, and average of the two stimulus directions. Both mutants show lower amplitudes in positive direction of stimulation (Control vs Emx2 cKO ***p = 4.04E-06 and Tmie cKO ***p = 8.15E-08), but no difference in negative direction of stimulation, compared to controls. Only Tmie cKO and not Emx2 cKO show a lower average amplitude compared to controls (Emx2 cKO vs Tmie cKO *p = 0.03, Control vs Tmie cKO ***p = 1.36E-05). e Summary of thresholds for VsEP determined by various jerk magnitudes. Both Emx2 cKO and Tmie cKO mice show higher thresholds in the positive direction of stimulus (Control vs Emx2 cKO ***p = 1.02E−05 and Tmie cKO ***p = 1.64E−04) but no significant difference in negative direction of stimulus or average of the two directions stimuli, compared to controls. Control n = 55; Emx2 cKO n = 26; Tmie cKO n = 35. In boxplots, boxes represent the interquartile range (IQR), and the thick lines inside show the median. Whiskers denote the lowest and highest values within 1.5 times the IQR. The one-way ANOVA with multiple comparisons was applied. Source data are provided as a Source data file.

Similar articles

Cited by

References

    1. Desai SS, Zeh C, Lysakowski A. Comparative morphology of rodent vestibular periphery. I. Saccular and utricular maculae. J. Neurophysiol. 2005;93:251–266. - PubMed
    1. Desai SS, Ali H, Lysakowski A. Comparative morphology of rodent vestibular periphery. II. Cristae ampullares. J. Neurophysiol. 2005;93:267–280. - PubMed
    1. Kawashima Y, et al. Mechanotransduction in mouse inner ear hair cells requires transmembrane channel-like genes. J. Clin. Investig. 2011;121:4796–4809. - PMC - PubMed
    1. Simon F, et al. Implication of vestibular hair cell loss of planar polarity for the canal and otolith-dependent vestibulo-ocular reflexes in Celsr1(-/-) mice. Front. Neurosci. 2021;15:750596. - PMC - PubMed
    1. Ono K, et al. Retinoic acid degradation shapes zonal development of vestibular organs and sensitivity to transient linear accelerations. Nat. Commun. 2020;11:63. - PMC - PubMed

Publication types

MeSH terms

Substances

LinkOut - more resources