

Estimation of best corrected visual acuity based on deep neural network
- PMID: 36280678
- PMCID: PMC9589880
- DOI: 10.1038/s41598-022-22586-2
Estimation of best corrected visual acuity based on deep neural network
Abstract
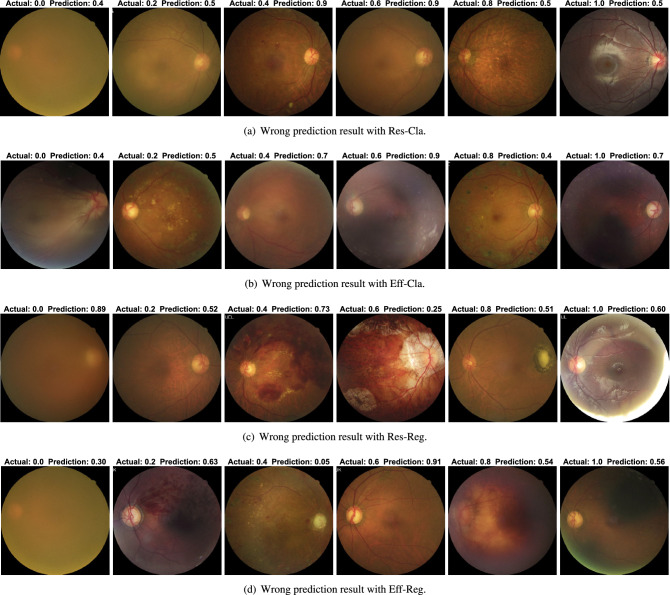
In this study, we investigated a convolutional neural network (CNN)-based framework for the estimation of the best-corrected visual acuity (BCVA) from fundus images. First, we collected 53,318 fundus photographs from the Gyeongsang National University Changwon Hospital, where each fundus photograph is categorized into 11 levels by retrospective medical chart review. Then, we designed 4 BCVA estimation schemes using transfer learning with pre-trained ResNet-18 and EfficientNet-B0 models where both regression and classification-based prediction are taken into account. According to the results of the study, the predicted BCVA by CNN-based schemes is close to the actual value such that 94.37% of prediction accuracy can be achieved when 3 levels of difference can be tolerated during prediction. The mean squared error and [Formula: see text] score were measured as 0.028 and 0.654, respectively. These results indicate that the BCVA can be predicted accurately for extreme cases, i.e., the level of BCVA is close to either 0.0 or 1.0. Moreover, using the Guided Grad-CAM, we confirmed that the macula and the blood vessel surrounding the macula are mainly utilized in the prediction of BCVA, which validates the rationality of the CNN-based BCVA estimation schemes since the same area is also exploited during the retrospective medical chart review. Finally, we applied the t-distributed stochastic neighbor embedding to examine the characteristics of CNN-based BCVA estimation schemes. The developed BCVA estimation schemes can be employed to obtain the objective measurement of BVCA as well as the medical screening of people with poor access to medical care through smartphone-based fundus imaging.
© 2022. The Author(s).
Conflict of interest statement
The authors declare no competing interests.
Figures


Similar articles
-
Prediction of Visual Acuity After Cataract Surgery by Deep Learning Methods Using Clinical Information and Color Fundus Photography.Curr Eye Res. 2025 Mar;50(3):276-281. doi: 10.1080/02713683.2024.2430212. Epub 2024 Dec 9. Curr Eye Res. 2025. PMID: 39651583
-
Investigation of the Role of Convolutional Neural Network Architectures in the Diagnosis of Glaucoma using Color Fundus Photography.Turk J Ophthalmol. 2022 Jun 29;52(3):193-200. doi: 10.4274/tjo.galenos.2021.29726. Turk J Ophthalmol. 2022. PMID: 35770344 Free PMC article.
-
Effects of Hypertension, Diabetes, and Smoking on Age and Sex Prediction from Retinal Fundus Images.Sci Rep. 2020 Mar 12;10(1):4623. doi: 10.1038/s41598-020-61519-9. Sci Rep. 2020. PMID: 32165702 Free PMC article.
-
Machine Learning to Analyze the Prognostic Value of Current Imaging Biomarkers in Neovascular Age-Related Macular Degeneration.Ophthalmol Retina. 2018 Jan;2(1):24-30. doi: 10.1016/j.oret.2017.03.015. Epub 2017 May 31. Ophthalmol Retina. 2018. PMID: 31047298 Clinical Trial.
-
Impact of the Time to Surgery on Visual Outcomes for Rhegmatogenous Retinal Detachment Repair: A Meta-Analysis.Am J Ophthalmol. 2022 Dec;244:19-29. doi: 10.1016/j.ajo.2022.07.022. Epub 2022 Aug 4. Am J Ophthalmol. 2022. PMID: 35932819 Review.
Cited by
-
An AI model to estimate visual acuity based solely on cross-sectional OCT imaging of various diseases.Graefes Arch Clin Exp Ophthalmol. 2023 Oct;261(10):2775-2785. doi: 10.1007/s00417-023-06054-9. Epub 2023 May 11. Graefes Arch Clin Exp Ophthalmol. 2023. PMID: 37166519 Free PMC article.
References
Publication types
MeSH terms
LinkOut - more resources
Full Text Sources
