. 2022 Oct 24;13(1):6323.
doi: 10.1038/s41467-022-33144-9.

Computational pharmacogenomic screen identifies drugs that potentiate the anti-breast cancer activity of statins

Affiliations

Computational pharmacogenomic screen identifies drugs that potentiate the anti-breast cancer activity of statins

Jenna E van Leeuwen et al. Nat Commun. .

Abstract

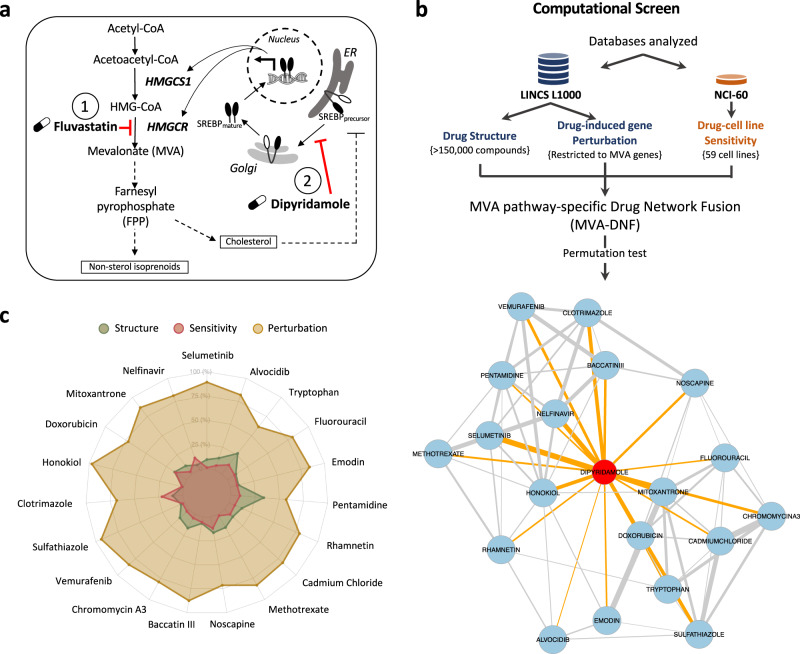
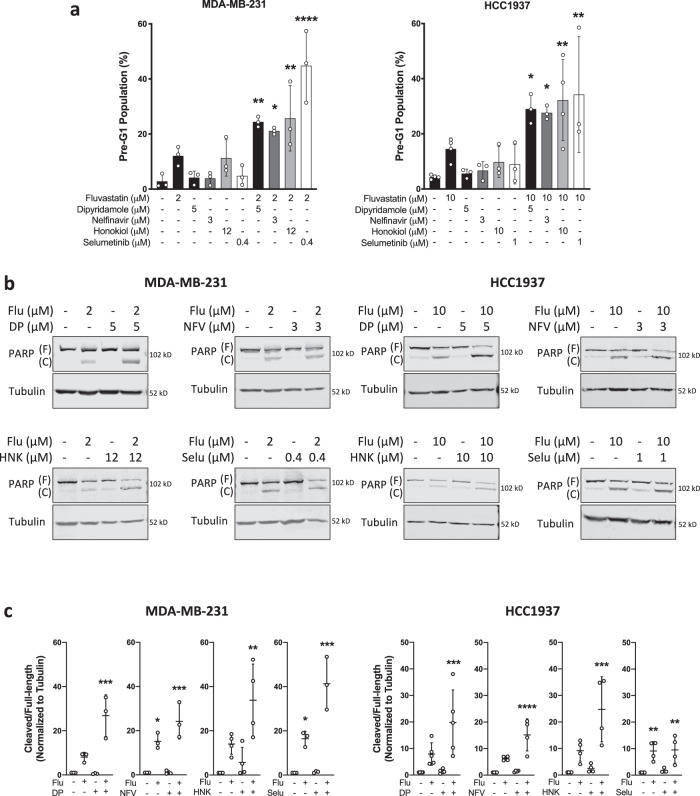
Statins, a family of FDA-approved cholesterol-lowering drugs that inhibit the rate-limiting enzyme of the mevalonate metabolic pathway, have demonstrated anticancer activity. Evidence shows that dipyridamole potentiates statin-induced cancer cell death by blocking a restorative feedback loop triggered by statin treatment. Leveraging this knowledge, we develop an integrative pharmacogenomics pipeline to identify compounds similar to dipyridamole at the level of drug structure, cell sensitivity and molecular perturbation. To overcome the complex polypharmacology of dipyridamole, we focus our pharmacogenomics pipeline on mevalonate pathway genes, which we name mevalonate drug-network fusion (MVA-DNF). We validate top-ranked compounds, nelfinavir and honokiol, and identify that low expression of the canonical epithelial cell marker, E-cadherin, is associated with statin-compound synergy. Analysis of remaining prioritized hits led to the validation of additional compounds, clotrimazole and vemurafenib. Thus, our computational pharmacogenomic approach identifies actionable compounds with pathway-specific activities.


Conflict of interest statement

DWC serves as a consultant for AstraZeneca, Exact Sciences, Eisai, Gilead, GlaxoSmithKline, Inivata, Merck, Novartis, Pfizer, and Roche.; receives research support (to institution) from AstraZeneca, Gilead, GlaxoSmithKline, Inivata, Merck, Pfizer, and Roche, and holds intellectual property as co-inventor on a patent (US62/675,228) titled “Methods of treating cancers characterized by a high expression level of spindle and kinetochore associated complex subunit 3 (ska3) gene”. DWA serves as a consultant for Roivent, Saguaro, and Precision Cancer Technologies; receives research support (to the institution) from Novartis and holds intellectual property as co-inventor on patents related to in vitro evolution and regulation of protein translation (WO9837186 titled “In vitro peptide or protein expression library” and US5/807,707/US5/824,497 titled “High-efficiency translation of mRNA molecules”). All other authors declare no competing interests.

Figures

Fig. 1
Fig. 1. A schematic of the mevalonate (MVA) pathway and overview of the computational pharmacogenomics workflow.
a In response to fluvastatin treatment (labeled with 1), MVA pathway end-product levels decrease, triggering an SREBP-mediated feedback response that activates MVA pathway-associated gene expression to restore cholesterol and other non-sterol end-products. Dipyridamole (DP) (labeled with 2) blocks the SREBP-mediated feedback response, thereby potentiating fluvastatin-induced cancer cell death. b An overview of the computational pharmacogenomics workflow, MVA-DNF, was used to identify the top 19 compounds and visualized as a compound network. MVA-DNF combines drug structure, drug-induced gene perturbation datasets restricted to six MVA pathway-specific genes, and drug sensitivity. Permutation specificity testing was performed to select compounds that have a degree of specificity to the MVA pathway and dipyridamole. Statistical significance of compounds similar to dipyridamole was assessed by comparing to 999 networks generated from random selection of six genes within the drug perturbation layer. A network representation of dipyridamole and the top 19 statistically-significant (p-value <0.05) compounds are shown. Each node represents a compound, and edges connect compounds based on a statistical significance cutoff of p-value <0.05. Blue nodes and orange edges represent the compounds connected to dipyridamole, and edge thickness represents the associated p-value between the compounds. c Radar plot of the top 19 compounds (p-value <0.05), where the contribution of each individual layer of the MVA-DNF (drug structure, perturbation, and sensitivity) is depicted. The radar plot was generated by comparing the score of DP and the top hit compound, across the affinity matrices of the perturbation, structure, and sensitivity layers. The percent contribution of each layer is shown from the center (0%) to the outer edges (100%).
Fig. 2
Fig. 2. Dipyridamole-like compounds potentiate fluvastatin-induced cell death.
a MDA-MB-231 and HCC1937 cells were treated with solvent controls or fluvastatin + /− dipyridamole (DP), nelfinavir (NFV), honokiol (HNK) or selumetinib (Selu) for 72 h, fixed in ethanol and assayed for DNA fragmentation (% pre-G1 population) as a marker of cell death by propidium iodide staining. Error bars represent the mean ± SD, n = 3–4 biologically independent samples, *p < 0.05, **p < 0.01, ****p < 0.0001 (one-way ANOVA with Bonferroni’s multiple comparisons test, where each treatment was compared to the solvent control). b Cells were treated as in (a), protein isolated and immunoblotting was performed to assay for PARP cleavage. Tubulin was assayed as a protein loading control. F represents full-length PARP and (C) represents cleaved PARP. c PARP cleavage (cleaved/full-length) shown in (b) was quantified by densitometry and normalized to Tubulin expression. Error bars represent the mean ± SD, n = 3–5 biologically independent samples, *p < 0.05, **p < 0.01, ***p < 0.001, ****p < 0.0001 (one-way ANOVA with Bonferroni’s multiple comparisons test, where each group was compared to the solvent control within each experiment). Source data are provided as source data file.
Fig. 3
Fig. 3. Nelfinavir and Honokiol block fluvastatin-induced SREBP2 activation.
a MDA-MB-231 (left) and HCC1937 (right) cells were exposed to solvent controls, fluvastatin (Flu) +/− dipyridamole (DP), nelfinavir (NFV), honokiol (HNK) or selumetinib (Selu) for 16 h, and RNA was isolated to assay INSIG1 expression by qRT-PCR. mRNA expression data are normalized to RPL13A expression. Error bars represent the mean ± SD, n = 3–4 biologically independent samples, *p < 0.05, **p < 0.01, ***p < 0.001, ****p < 0.0001 (one-way ANOVA with Bonferroni’s multiple comparisons test, where each group was compared to the solvent control group within each experiment). b MDA-MB-231 and HCC1937 cells were treated with fluvastatin + /− dipyridamole, nelfinavir, honokiol or selumetinib for 12 h, and protein was harvested to assay for SREBP2 expression and cleavage (activation) by immunoblotting. (P) represents precursor, full-length SREBP2, and (M) represents mature, cleaved SREBP2. Total ERK was assayed as a protein loading control. N = 3–8 biologically independent experiements, the representative image is shown. c SREBP2 cleavage (cleaved/full-length) was quantified by densitometry and normalized to total ERK expression. Error bars represent the mean + /− SD, n = 3–8 biologically independent samples, *p < 0.05, **p < 0.01, ***p < 0.001, ****p < 0.0001 (one-way ANOVA with Bonferroni’s multiple comparisons test, where each group was compared to the solvent controls group within its experiment). Source data are provided as source data file.
Fig. 4
Fig. 4. Compound combination synergy analysis identified basal E-cadherin to predict synergistic response to fluvastatin-compound combinations.
a Heatmap of synergy scores (Bliss Index model) for fluvastatin (Fluva) + dipyridamole (DP), nelfinavir (NFV) or honokiol (HNK) in a panel of 47 BC cells lines. Clustered by synergy score from least (>0) to greatest (<0) synergy. BC subtype of each cell line shown is based on the SCMOD2 subtyping scheme. Spearman correlation coefficients are labeled on the left. b Basal mRNA expression associations with synergy scores for each drug combination (e.g. Fluva-NFV vs. Fluva-DP, Fluva-HNK vs. Fluva-DP, and Fluva-NFV vs. Fluva-HNK). Associations were calculated using Pearson correlation coefficient. Top five basally-expressed genes associated with synergy in either direction are annotated in red. c Gene set enrichment analysis (GSEA) using the Hallmark gene set collection, where genes were ranked according to their correlation to the fluvastatin IC50 (Fluva) value or to the synergy score (Fluva-DP, Fluva-NFV and Fluva-HNK). Dot plot was restricted to pathways enriched in at least two out of the four groups. Dot size indicates the difference in enrichment scores (ES) of the pathways. Background shading indicates FDR and X indicates pathway and drug combinations that were not significantly enriched (FDR > 0.05). d Basal E-cadherin mRNA expression between cell lines is predicted to be synergistic or not to the drug combination. Synergy was defined by Bliss Index and significance was measured by two-sided wilcoxon rank sum test. e Basal E-cadherin mRNA expression between cell lines predicted to be respondent or not to fluvastatin. Sensitivity was defined by IC50 and significance was measured by two-sided wilcoxon rank sum test. f BC cell line E-cadherin protein expression is inversely correlated with Bliss synergy. Densitometry values of E-cadherin expression normalized to tubulin plotted as a heatmap (orange is high E-cad protein expression). Average Bliss synergy score for the corresponding cell lines (red is high Bliss synergy score) (left). Average Bliss synergy score plotted by E-cadherin expression binarized based on z-score (right). df The center lines, bounds of box, whiskers, points of boxplot indicate median, lower/upper quartile (25th/75th percentile), minima/maxima, and raw data, respectively.
Fig. 5
Fig. 5. Fluvastatin-nelfinavir combination is synergistic in primary breast cancer patient-derived tumor organoids.
a Cell death matrix for BXTO.58 organoids as determined by CellTiter-Glo. Each well was normalized to the DMSO control well (0% cell death). Visualizing the 20th to 80th percentile. b Synergy plot for BXTO.58 organoids treated with the indicated doses of fluvastatin and nelfinavir, where red represents synergy and green represents antagonism. c Representative images of BXTO.58 organoids are shown after 7 days of treatment. Selected images represent the most synergistic area identified through SynergyFinder. N = 2–5 biologically independent experiments. Scale bars = 200 μm. d The Bliss synergy scores for the four organoid models tested are plotted. The data are represented as the mean + /− SD, n = 2–5 biologically independent experiments.
Fig. 6
Fig. 6. Cell death and SREBP2 translocation assays validate additional pharmacogenomic MVA-DNF compounds.
a HCC1937 cells were treated with a concentration range of MVA-DNF compounds with and without 4 μM fluvastatin for 72 h. Cells were then stained with DRAQ5, TMRE and Caspase-3/7 and subsequently imaged by confocal microscopy. Quantification of percent cell death was determined from linear classification analysis. Error bars represent the mean + /− SD, n = 4 biologically independent experiments, *p < 0.05, **p < 0.01, ***p < 0.001, ****p < 0.0001 (one-way ANOVA with Bonferroni’s multiple comparisons test, where each group was compared to the indicated group). b Classification result of subcellular localization of mNeon-SREBP2 in NMuMG cells in the presence of fluvastatin (10 µM) and geranylgeranyl pyrophosphate (GGPP) (2 µM) treated with a set of compounds (high, medium, low dose) as indicated in the legend, identified to potentiate fluvastatin-induced cell death from (a) for 16 h. Treatment was carried out in 5% lipoprotein-deficient serum (LPDS)-supplemented culture media. Numbers shown within the heat map indicate the percentage of cells assigned either to the cytoplasm or nucleus. While RanGTP functions as a nuclear landmark, the Cytoplasm comprises multiple organelle markers: endoplasmic reticulum, Golgi apparatus, nuclear envelope, and secretory pathway. The shown result is representative of three replicates. Sample micrographs of mNeon-SREBP2 expressed in NMuMG cells treated with either fluvastatin/GGPP in the presence of the respective highest dose of dipyridamole, nelfinavir, honokiol, PF429242, vemurafenib, clotrimazole or baccatin III for 16 h. The white arrow indicates nuclei of interest. Scale bar = 50 μm. c Schematic diagram detailing the potential for fluvastatin (labeled with 1) and SREBP2 inhibitors (labeled with SREBP2i) to block the SREBP2-mediated feedback response and synergise to potentiate fluvastatin-induced cell death.

References

    1. Canadian Cancer Society. Canadian Cancer Statistics publication. https://cdn.cancer.ca/-/media/files/research/cancer-statistics/2019-stat... (2019).
    1. Lebert JM, Lester R, Powell E, Seal M, McCarthy J. Advances in the systemic treatment of triple-negative breast cancer. Curr. Oncol. 2018;25:S142–S150. - PMC - PubMed
    1. DeBerardinis RJ, Chandel NS. Fundamentals of cancer metabolism. Sci. Adv. 2016;2:e1600200. - PMC - PubMed
    1. Warburg O. On the origin of cancer cells. Science. 1956;123:309–314. - PubMed
    1. Ehmsen S, et al. Increased cholesterol biosynthesis is a key characteristic of breast cancer stem cells influencing patient outcome. Cell Rep. 2019;27:3927–3938.e6. - PubMed

Publication types

Grants and funding

LinkOut - more resources