. 2022 Oct 24;12(1):17811.
doi: 10.1038/s41598-022-21610-9.

ROCK1/MLC2 inhibition induces decay of viral mRNA in BPXV infected cells

Affiliations

ROCK1/MLC2 inhibition induces decay of viral mRNA in BPXV infected cells

Ram Kumar et al. Sci Rep. .

Abstract

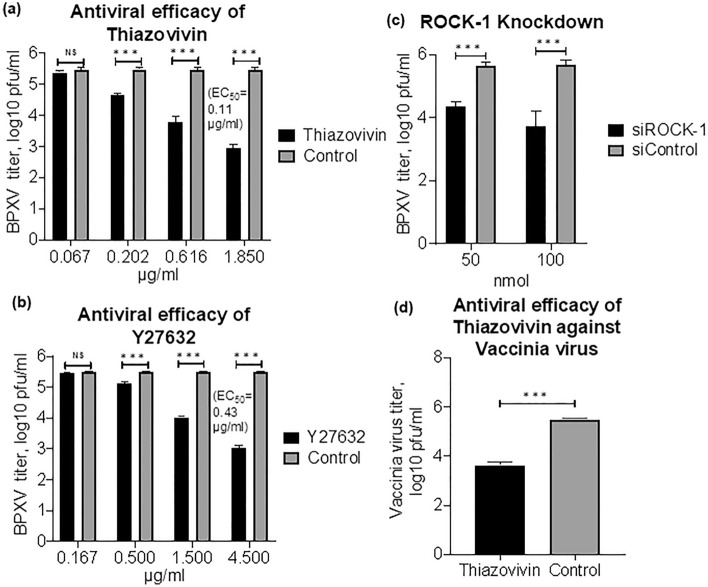
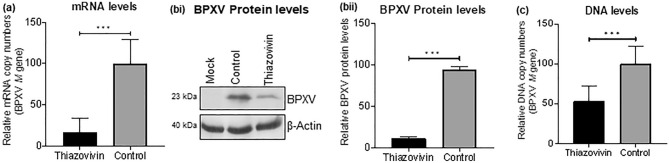
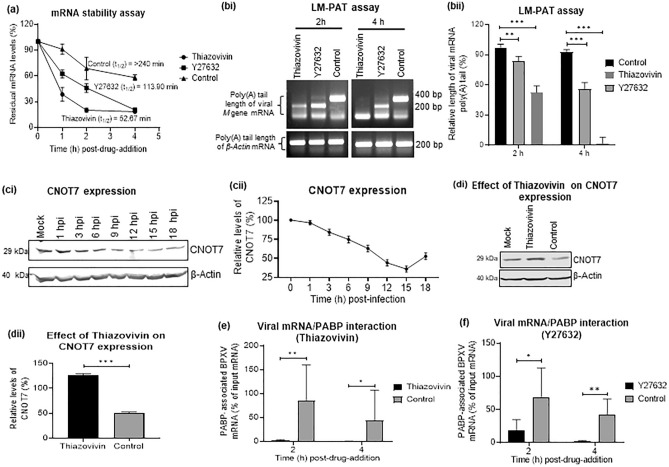
Rho-associated coiled-coil containing protein kinase 1 (ROCK1) intracellular cell signaling pathway regulates cell morphology, polarity, and cytoskeletal remodeling. We observed the activation of ROCK1/myosin light chain (MLC2) signaling pathway in buffalopox virus (BPXV) infected Vero cells. ROCK1 depletion by siRNA and specific small molecule chemical inhibitors (Thiazovivin and Y27632) resulted in a reduced BPXV replication, as evidenced by reductions in viral mRNA/protein synthesis, genome copy numbers and progeny virus particles. Further, we demonstrated that ROCK1 inhibition promotes deadenylation of viral mRNA (mRNA decay), mediated via inhibiting interaction with PABP [(poly(A)-binding protein] and enhancing the expression of CCR4-NOT (a multi-protein complex that plays an important role in deadenylation of mRNA). In addition, ROCK1/MLC2 mediated cell contraction, and perinuclear accumulation of p-MLC2 was shown to positively correlate with viral mRNA/protein synthesis. Finally, it was demonstrated that the long-term sequential passage (P = 50) of BPXV in the presence of Thiazovivin does not select for any drug-resistant virus variants. In conclusion, ROCK1/MLC2 cell signaling pathway facilitates BPXV replication by preventing viral mRNA decay and that the inhibitors targeting this pathway may have novel therapeutic effects against buffalopox.


Conflict of interest statement

The authors declare no competing interests.

Figures

Figure 1
Figure 1
In vitro antiviral efficacy of ROCK1 inhibitor. (a) In vitro antiviral efficacy of Thiazovivin. Vero cells, in triplicates, were infected with BPXV at MOI of 0.1 in the presence of indicated concentrations of Thiazovivin or DMSO. The virus particles released in the cell culture supernatants at 48 hpi were quantified by plaque assay. n = 3 independent experiments. (b) In vitro antiviral efficacy of Y27632. Vero cells, in triplicates, were infected with BPXV at MOI of 0.1 in the presence of indicated concentrations of Y27632 or DMSO. The virus particles released in the cell culture supernatants at 48 hpi were quantified by plaque assay. n = 3 independent experiments. (c) siRNA knockdown. Vero cells, in triplicates, were transfected with ROCK1 (50 nmol and 100 nmol) and negative control (100 nmol) siRNAs, followed by BPXV infection at MOI of 1. The virus yields in the infected cell culture supernatants at 48 hpi were quantified by plaque assay. n = 3 independent experiments. (d) In vitro antiviral efficacy of Thiazovivin against vaccinia virus. Vero cells, in triplicates, were infected with vaccinia virus at MOI of 0.1 in the presence of Thiazovivin or DMSO. The virus particles released in the cell culture supernatants at 48 hpi were quantified by plaque assay. n = 3 independent experiments. CC50 and EC50 were determined by the Reed-Muench method. Error bars indicate SD. Pair-wise statistical comparisons were performed using Student’s t test (NS non-significant difference, ***P < 0.001).
Figure 2
Figure 2
Effect of Thiazovivin on levels of BPXV mRNA/protein/DNA. (a) Viral mRNA. Confluent monolayers of Vero cells, in triplicates, were infected with BPXV (MOI of 5), followed by washing with PBS and addition of fresh medium. Inhibitor or vehicle-controls were applied at 4 hpi. Cells were scraped at 12 hpi to isolate RNA. cDNA was synthesized using oligo (dT) primers and quantified for BPXV M gene by qRT-PCR. Ct values were normalized with the β-actin housekeeping control gene and relative fold change was calculated by the ∆∆ Ct method. n = 3 independent experiments. (b) Viral proteins. Cells were infected with BPXV and treated with Thiazovivin as described above. The cell lysates were prepared at 24 hpi. The levels of viral (upper panel) and β-Actin house-keeping control protein (lower panel) were determined by Western blot analysis (bi). The histogram (bii) shows the band intensity of the protein. The blots were quantified by densitometry (ImageJ) and the data are presented as mean with SD. n = 3 independent experiments. See Supplementary Fig. 6a for full blots. (c) Viral DNA. Vero cells, in triplicates, were infected with BPXV and treated with Thiazovivin as described above. BPXV M gene in Thiazovivin-treated and vehicle-control-treated Vero cells were quantified by qRT-PCR. Ct values were normalized with the β-actin housekeeping control gene and relative fold change was calculated by the ∆∆ Ct method. n = 3 independent experiments. Error bars indicate SD. Pair-wise statistical comparisons were performed using Student's t-test (***P < 0.001; **P < 0.01).
Figure 3
Figure 3
Thiazovivin induces viral mRNA decay. (a) Measurement of mRNA stability: Vero cells, in triplicates, were infected with BPXV at MOI of 5. At 9 hpi, cells were treated with Thiazovivin (1 µg/ml), Y27632 (1.5 µg/ml) or equivalent volumes of DMSO in the presence of Actinomycin D (5 µg/ml). Cells were subjected to RNA isolation at indicated time points (post-drug treatment) and subjected to cDNA synthesis and quantified for BPXV M gene by qRT–PCR. The relative levels of viral mRNA at 0 h, 1 h, 2 h and 4 h in Thiazovivin or Y27632- and control-treated cells are shown. n = 3 independent experiments. (b) LM-PAT assay. Vero cells were infected with BPXV. At 9 hpi, the cells were treated with the inhibitors (Thiazovivin or Y27632) or DMSO in the presence of Actinomycin D. At indicated times post-drug-addition, cells were scrapped to isolate the RNA. The RNA was allowed to react with an adaptor oligo(dT) primer in the presence of T4 DNA ligase and subjected to cDNA synthesis. The length of poly(A) tail of viral (M) and cellular (β-actin) mRNA were determined by PCR by using an anchor primer and a gene-specific primer (bi). The length of the PCR product (BPXV M gene) in inhibitor-treated and control-treated cells was measured (ImageJ) and the relative length of the viral mRNA poly(A) tail (% of control) at different times treatment was calculated (bii). Data are presented as mean with SD. n = 3 independent experiments. See Supplementary Fig. 6b for full gel. (c) Kinetics of CNOT7 expression. Vero cells were either mock-infected or infected with BPXV at MOI of 5. Cell lysate were prepared at indicated time points and subjected for detection of CNOT7 levels in Western blot analysis. The levels of CNOT7 (upper panel) and β-actin (house-keeping control protein, lower panel) are shown (ci). The line graph (cii) shows the band intensity of the protein at different times post-infection. The blots were quantified by densitometry (ImageJ) and the data are presented as mean with SD. n = 3 independent experiments. See Supplementary Fig. 6b for full blots. (d) Effect of Thiazovivin on CNOT7 expression. Vero cells were either mock-infected or infected with BPXV at MOI of 5. Thiazovivin or vehicle controls were added at 6 hpi. Cell lysates were prepared at 9 hpi and subjected for detection of CNOT7 levels in Western blot analysis (di). The histogram (dii) shows the band intensity of the protein. The blots were quantified by densitometry (ImageJ) and the data are presented as mean with SD. n = 3 independent experiments. See Supplementary Fig. 6c for full blots. (e and f) ROCK1 inhibition blocks interaction of BPXV mRNA with PABP (CHIP assay).Vero cells, in triplicates, were infected with BPXV at MOI of 5. At 9 hpi, the cells were treated with ROCK1 inhibitors (Thiazovivin and Y27632) or vehicle control. At 2 h and 4 h post-drug addition, the cell lysates were prepared as per the procedure described for CHIP assay (materials and method section). The clarified cell lysates were incubated with α-PABP or equivalent volume of the IP buffer (Beads control), followed by incubation with Protein A Sepharose® slurry. The beads were then washed five times in the IP buffer. To reverse the cross-linking, the complexes were then incubated with Proteinase K. Finally, the reaction mixtures were centrifuged and the supernatant was subjected to cDNA preparation and quantitation of BPXV RNA (M gene) by qRT-PCR. The percentage of the input BPXV mRNA bound to PABP in Thiazovivin-treated (e) and Y27632-treated cells (f) is shown. n = 3 independent experiments. Error bars indicate SD. Pair-wise statistical comparisons were performed using Student's t-test (***P < 0.001; **P < 0.01; *P < 0.05).
Figure 4
Figure 4
ROCK1/p-MLC2 signaling mediated cell contraction following BPXV infection is prerequisite for the stability of viral mRNA. (a) BPXV infection induces cell contraction (membrane blebbing). Vero cells were grown in chamber slides and infected with BPXV at an MOI of 5 for 1 h. Cells were subjected to live imaging. Cell morphology of BPXV infected cells at different time points are shown (ai). The histogram shows the relative reduction in cell size at different times post-BPXV infection (aii). To quantify BPXV-induced cell shrinkage, fifty cells were selected and the change in their size was measured by ImageJ at different times post-infection. The relative change in cell size (shrinkage) was expressed as a % of cell size immediately after viral infection (~ 1hpi) and the data are presented as mean with SD. (b) Kinetics of MLC2 activation. Vero cells were either mock-infected or infected with BPXV at MOI of 5. Cell lysates were prepared at indicated time points and subjected for detection of p-MLC2 levels in Western blot analysis. The levels of pMLC2 (upper panel) and β-actin (house-keeping control protein, lower panel) are shown (bi). The line diagram (bii) shows the band intensity of the protein. The blots were quantified by densitometry (ImageJ) and the data are presented as mean with SD. n = 3 independent experiments. See Supplementary Fig. 6d for full blots (c) Kinetics of viral mRNA synthesis in Thiozovivin-treated and vehicle control treated cells. Vero cells, in triplicates, were infected with BPXV at MOI of 5. Thiazovivin was applied at 3 hpi and cell lysate were prepared at the indicated time points for quantitation of viral mRNA (M gene). n = 3 independent experiments. Error bars indicate SD. Pair-wise statistical comparisons were performed using Student's t-test (***P < 0.001, NS non-significant).
Figure 5
Figure 5
ROCK1 inhibition impairs BPXV-induced cell contraction and viral protein synthesis. (a) Effect of Thiazovivin on MLC2 phosphorylation (activation). Vero cells were either mock-infected or infected with BPXV at MOI of 5. Thiazovivin or vehicle controls were added at 4 hpi. Cell lysates were prepared at 9 hpi and subjected for detection of the p-MLC2 levels in Western blot analysis (ai). The histogram (aii) shows the band intensity of the protein. The blots were quantified by densitometry (ImageJ) and the data are presented as mean with SD. n = 3 independent experiments. See Supplementary Fig. 6e for full blots. (b) Effect of Thiazovivin on BPXV induced cell contraction and levels of viral proteins. HeLa cells were grown in chamber slides and infected with BPXV at an MOI of 5 for 1 h. Thiazovivin was applied at 4 hpi. At 15 hpi, BPXV (FITC) proteins were probed by immunofluorescence assay. Cell morphology and level of viral proteins of Thiazovivin-treated or untreated cells is shown (bi). The histogram shows the relative reduction in cell size (bii) and relative levels of BPXV proteins (biii) in Thiazovivin treated or untreated cells. The area (n = 50 cells) and the intensity of viral proteins (n = 50 cells) were quantified by ImageJ. The data are presented as mean with SD. Pair-wise statistical comparisons were performed using Student's t-test (***P < 0.001; **P < 0.001).
Figure 6
Figure 6
Perinuclear accumulation of p-MLC2 is prerequisite for the synthesis of viral proteins. HeLa cells were grown in chamber slides and infected with BPXV at an MOI of 5 for 1 h. Thiazovivin was applied at 4 hpi. At 15 hpi, BPXV (FITC) proteins and p-MLC2 (Rhodamine) were probed by immunofluorescence assay (i). The line graph shows the levels of BPXV protein (ii) and levels of perinuclear accumulation of p-MLC2 (iii) in BPXV infected cells. The intensities of viral proteins from fifty BPXV infected cells were quantified by densitometry (ImageJ) and the data are presented as mean with SD. Pair-wise statistical comparisons were performed using Student's t-test (***P < 0.001).
Figure 7
Figure 7
Evaluation of antiviral drug resistance against Thiazovivin. BPXV was sequentially passaged (P) fifty times in the medium containing 0.5 μg/ml of Thiazovivin or equivalent volumes of DMSO. The original virus stock (P0), P50-Thiazovivin and P50-Control viruses were used to infect Vero cells, in triplicates, at an MOI of 0.1 and treated with either 1 μg/ml of Thiazovivin or equivalent volumes of DMSO. The virus released in the supernatant at 48 hpi was quantified by plaque assay. Error bars indicate SD. Pair-wise statistical comparisons were performed using Student’s t test (***P < 0.001).
Figure 8
Figure 8
In ovo antiviral efficacy of Thiazovivin against BPXV. (a) LD50. Embryonated SPF chicken eggs, in triplicates, were inoculated with indicated concentration of Thiazovivin via CAM route. At 5 days post-Thiazovivin inoculation, eggs were visualized for viability of the embryos. LD50 was determined by the Reed-Muench method. (b) Anti-BPXV efficacy (EC50). Embryonated SPF chicken eggs, in triplicate, were inoculated with indicated concentration of Thiazovivin, followed by infection with BPXV at 100 EID50. At 5 days post-Thiazovivin inoculation, eggs were visualized for viability of the embryos (c) Pock lesions on CAM at various drug regimens are shown. n = 3 independent experiments. Pair-wise statistical comparisons were performed using Student’s t test (***P < 0.001; *P < 0.05, NS nonsignificant).

Similar articles

Cited by

References

    1. Roy P, Chandramohan A. Buffalopox disease in livestock and milkers, India. Emerg. Infect. Dis. 2021;27:1989–1991. doi: 10.3201/eid2707.202111. - DOI - PMC - PubMed
    1. Singh RK, et al. Buffalopox: An emerging and re-emerging zoonosis. Anim. Health Res. Rev. 2007;8:105–114. doi: 10.1017/S1466252307001259. - DOI - PubMed
    1. Marinaik CB, et al. Isolation and molecular characterization of zoonotic Buffalopox virus from skin lesions of humans in India. Int. J. Dermatol. 2018;57:590–592. doi: 10.1111/ijd.13890. - DOI - PubMed
    1. Yadav PD, et al. Isolation and phylogenomic analysis of buffalopox virus from human and buffaloes in India. Virus Res. 2020;277:197836. doi: 10.1016/j.virusres.2019.197836. - DOI - PubMed
    1. Moss, B. Poxviridae: the viruses and their replication, vol. 2. Knipe, DMl (2001).

Publication types