. 2022 Dec;32(12):1086-1104.
doi: 10.1038/s41422-022-00731-w. Epub 2022 Oct 24.

Intercellular transfer of activated STING triggered by RAB22A-mediated non-canonical autophagy promotes antitumor immunity

Affiliations

Intercellular transfer of activated STING triggered by RAB22A-mediated non-canonical autophagy promotes antitumor immunity

Ying Gao et al. Cell Res. 2022 Dec.

Abstract

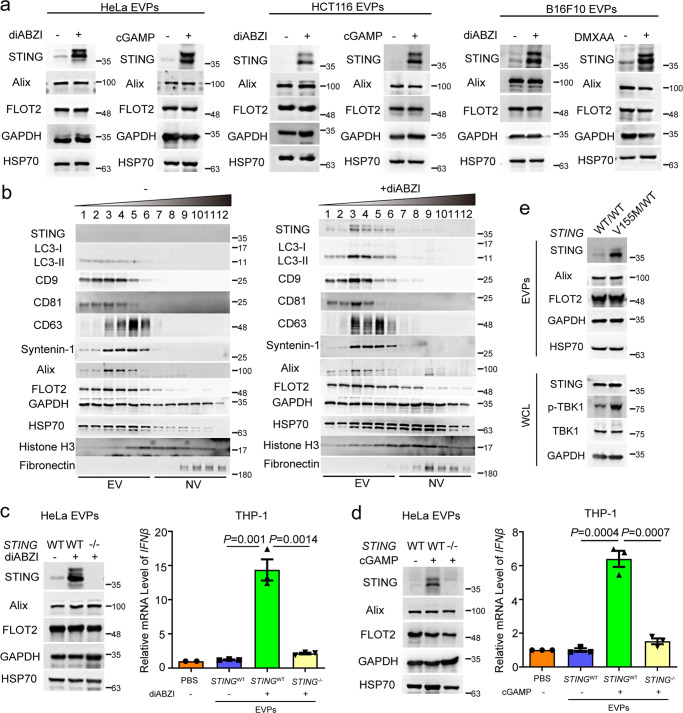
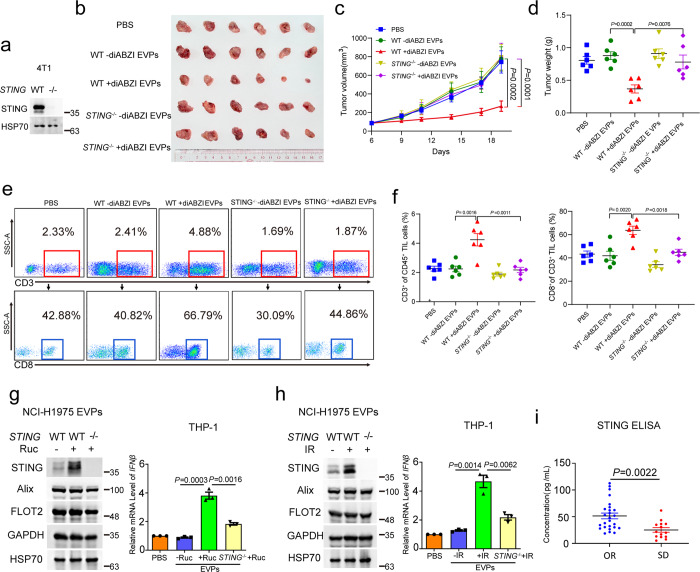
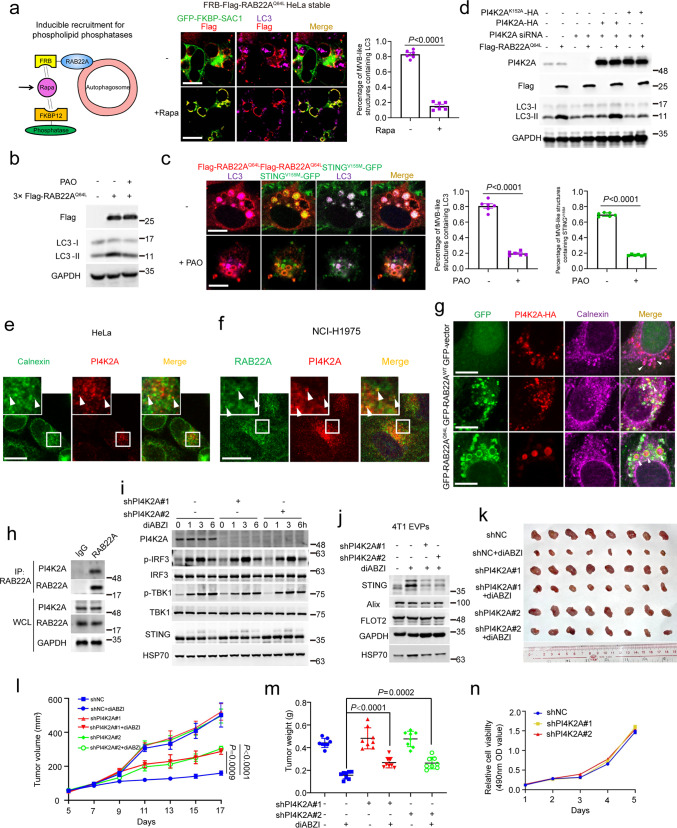
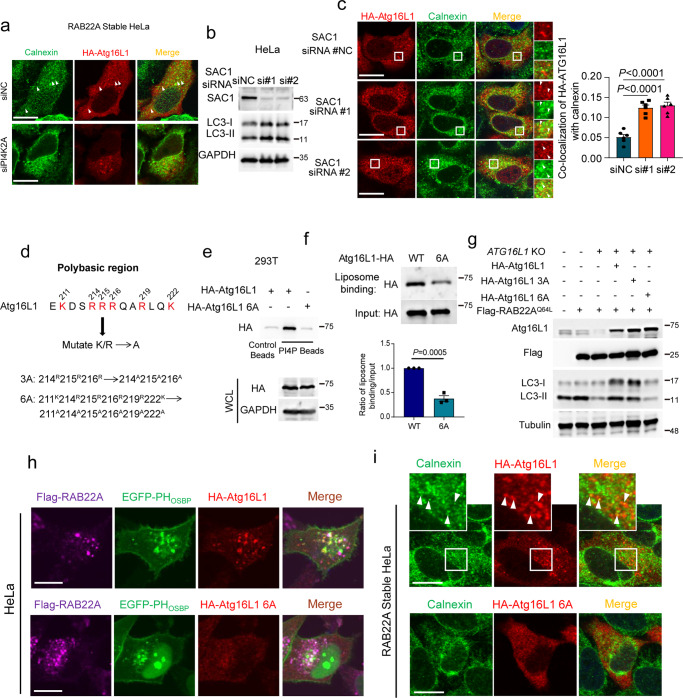
STING, an endoplasmic reticulum (ER) transmembrane protein, mediates innate immune activation upon cGAMP stimulation and is degraded through autophagy. Here, we report that activated STING could be transferred between cells to promote antitumor immunity, a process triggered by RAB22A-mediated non-canonical autophagy. Mechanistically, RAB22A engages PI4K2A to generate PI4P that recruits the Atg12-Atg5-Atg16L1 complex, inducing the formation of ER-derived RAB22A-mediated non-canonical autophagosome, in which STING activated by agonists or chemoradiotherapy is packaged. This RAB22A-induced autophagosome fuses with RAB22A-positive early endosome, generating a new organelle that we name Rafeesome (RAB22A-mediated non-canonical autophagosome fused with early endosome). Meanwhile, RAB22A inactivates RAB7 to suppress the fusion of Rafeesome with lysosome, thereby enabling the secretion of the inner vesicle of the autophagosome bearing activated STING as a new type of extracellular vesicle that we define as R-EV (RAB22A-induced extracellular vesicle). Activated STING-containing R-EVs induce IFNβ release from recipient cells to the tumor microenvironment, promoting antitumor immunity. Consistently, RAB22A enhances the antitumor effect of the STING agonist diABZI in mice, and a high RAB22A level predicts good survival in nasopharyngeal cancer patients treated with chemoradiotherapy. Our findings reveal that Rafeesome regulates the intercellular transfer of activated STING to trigger and spread antitumor immunity, and that the inner vesicle of non-canonical autophagosome originated from ER is secreted as R-EV, providing a new perspective for understanding the intercellular communication of organelle membrane proteins.


Conflict of interest statement

The authors declare no competing interests.

Figures

Fig. 1
Fig. 1. EVs containing activated STING induce IFNβ expression in recipient cells.
a Western blot analysis of EVPs isolated from HeLa, HCT116, and B16F10 cells treated with or without 10 µM diABZI, 1 µM cGAMP, or 50 µg/mL DMXAA for 48 h. b Density gradient fractionation of EVPs derived from HeLa cells treated with or without diABZI. After flotation of the sample in high-resolution iodixanol gradients, equal volumes of each fraction were loaded on SDS-PAGE gels, and membranes were blotted with the indicated antibodies. NV, non-vesicular. c, d THP-1 cells were collected after 24-h exposure to EVPs that were derived from wild-type and STING−/− HeLa cells treated with or without diABZI (c) and cGAMP (d), respectively. The mRNA level of IFNβ was then quantified. P values were calculated by Student’s t-test. e Western blot analysis of the WCL and the corresponding isolated EVPs derived from wild-type HeLa cells or HeLa cells expressing STINGV155M/WT.
Fig. 2
Fig. 2. EVs containing activated STING execute antitumor activity.
a Knockout efficiency of STING in 4T1 cells shown by western blot analysis. bd BALB/c mice were implanted subcutaneously with mouse 4T1 tumor cells for a week followed by tail vein injection of PBS or 5 μg EVPs derived from 4T1 cells three times a week. The xenografts were excised (b); tumor volume was monitored three times a week, P values were calculated by two-way ANOVA (c). Tumor weight on day 19 after transplantation was shown, and P value was calculated by Student’s t-test (d). n = 6. The data were presented as means ± SEM. e, f FACS analysis showing the infiltration of both CD3+ and CD8+ T cells in BALB/c mice bearing subcutaneous 4T1 tumors. P values were calculated by Student’s t-test. g, h THP-1 cells were collected after 24-h exposure to EVPs harvested from conditioned media of wild-type and STING−/− NCI-H1975 cells stimulated with 25 μM Ruc (g) or 8 Gy IR (h). The mRNA level of IFNβ was then quantified. P values were calculated by Student’s t-test. i Serum STING concentrations in NPC patients with different responses to chemoradiotherapy. P value was calculated by Student’s t-test. n = 26 for OR, and n = 14 for SD. OR, objective response; SD, stable disease.
Fig. 3
Fig. 3. RAB22A enhances the antitumor effect of diABZI and predicts prognosis in NPC patients treated with chemoradiotherapy.
a, b Immunofluorescence analysis of STINGV155M-HA (green) and Flag (red) in the indicated stable HeLa (a) or NCI-H1975 (b) cells transiently expressing STINGV155M-HA. Percentage of MVB-like structures containing STINGV155M was quantified on the right. P values were calculated by Student’s t-test. White arrowheads denote co-localization. n = 10 fields (each field has at least 8 cells that meet statistical requirements). Scale bar, 10 μm. c Electron microscopy images showed the structure of L-Flag-STINGV155M-GFP EVs. Scale bar, 200 nm. d Immunofluorescence analysis of STING (green) and Flag-RAB22AQ64L (red) in stable Flag-RAB22AQ64L NCI-H1975 cells treated with or without 1 µM diABZI for 1 h. Scale bar, 10 μm. e Immunofluorescence analysis of STING (red) and RAB22A (green) in NCI-H1975 cells treated with or without 1 µM diABZI for 1 h. Arrowheads indicate the co-localization of STING with RAB22A. Scale bar, 10 μm. f Western blot analysis of EVPs and WCL derived from the indicated stable 3× Flag-RAB22AWT or 3× Flag-RAB22AQ64L HeLa cells simultaneously and stably expressing STINGV155M-HA. g Western blot analysis of EVPs derived from RAB22A-KO HeLa cells treated with 10 µM diABZI for 48 h. h Western blot analysis of the WCL of the indicated stable 4T1 cells at the indicated time points after treatment with 10 µM diABZI. i Western blot analysis of the EVPs from the indicated stable 4T1 cells treated with or without 10 µM diABZI. jl Dissected tumors (j), tumor growth curve (k), and tumor weight (l) for xenograft experiments. The stable 4T1 cells were inoculated orthotopically into BALB/c mice for 6 days as indicated, and the mice were then treated with or without 1.5 mg/kg diABZI three times per week by intravenous tail injection as indicated for another 14 days. Visible tumors were measured every 2 or 3 days. P value of tumor growth curve was calculated by two-way ANOVA, and P value of tumor weight was calculated by Student’s t-test. n = 8. The data are presented as the means ± SEM. m Immunofluorescence analysis of STING (green), Flag (red), and DAPI (blue) in the indicated NCI-H1975 stable cells treated with or without 25 µM Ruc for 48 h. Scale bar, 10 μm. n Kaplan–Meier survival analyses of NPC cases separated into two groups by the median expression levels of RAB22A as indicated by RAB22A staining. P value was calculated by log-rank test.
Fig. 4
Fig. 4. Activated STING is packaged into MVB-like structures whose formation is driven by RAB22A.
a Knockout efficiency of ATG5 shown by western blot analysis. b Immunofluorescence analysis of LC3 (red), Flag-RAB22AQ64L (magenta), and transiently transfected STINGV155M-GFP (green) in wild-type or ATG5-KO HeLa cells. Percentages of MVB-like structures containing LC3 and STINGV155M were quantified respectively on the right. P values were calculated by Student’s t-test. n = 6 fields. Scale bar, 10 μm. c Immunofluorescence analysis of LC3 (magenta), HA (red), and GFP-RAB22AQ64L (green) in the indicated HeLa cells stably expressing STING-HA, STINGV155M-HA or STINGV155M/LIR467-HA. Scale bar, 10 μm. d Immunofluorescence analysis of LC3 (green) and Flag (red) in the indicated stable HeLa cells. Percentages of MVB-like structures containing LC3 (n = 10 fields) and diameters of RAB22A-positive MVBs (n = 150) were quantified on the right. P values were calculated by Student’s t-test. Scale bar, 10 μm. e Intracellular structures were observed by electron microscopy in the indicated stable HeLa cells. Scale bar, 500 nm. f Western blot analysis of WCL and EVPs derived from the 3× Flag-RAB22AWT and 3× Flag-RAB22AQ64L stable HeLa cells. Relative protein expression was quantified on the right. P values were calculated by Student’s t-test. g Western blot analysis of WCL and EVPs derived from the RAB22A-KO HeLa cells reintroduced with 3× Flag-RAB22AWT, 3× Flag-RAB22AQ64L, or 3× Flag-RAB22AS19N as indicated. * represents the bands of RAB22A; ※ represents the bands of 3× Flag-RAB22A. h Immunofluorescence analysis of LC3 (red), Flag (magenta), and STINGV155M-GFP (green) in the indicated stable HeLa cells transiently expressing STINGV155M-GFP. Scale bar, 10 μm. i Western blot analysis of WCL and immunoprecipitated RAB22A-positive sub-organelles derived from the indicated stable HeLa cells. j Immunofluorescence analysis of GFP-RAB22AQ64L (green) and LC3 (red) in GFP-RAB22AQ64L stable HeLa cells using SIM. Scale bar, 5 μm. k Immunoelectron microscopy showing LC3 localization in the indicated stable HeLa cells. Scale bar, 200 nm. l The diameters of LC3-positive ILVs were calculated. n = 156.
Fig. 5
Fig. 5. RAB22A-mediated non-canonical autophagosomes originate from ER and fuse with RAB22A-positive early endosomes to generate Rafeesomes.
a Immunofluorescence analysis of the ER marker calnexin (red), Flag (magenta or pseudo-green as indicated) and GFP-LC3 (green) in the indicated stable HeLa cells transiently expressing GFP-LC3. Co-localization of GFP-LC3 with calnexin and the percentage of MVB-like structures containing calnexin were quantified. P values were calculated by Student’s t-test. n = 8 fields. Scale bar, 10 μm. b Immunofluorescence analysis of the early endosome marker EEA1 (red), Flag (magenta or pseudo-green as indicated), and GFP-LC3 (green) in the indicated stable HeLa cells transiently expressing GFP-LC3. Percentage of MVB-like structures containing GFP-LC3 and co-localization of EEA1 with RAB22A were quantified. n = 8 fields. Scale bar, 10 μm. c Immunofluorescence analysis of GFP-RAB22AQ64L (green), EEA1 (magenta), and calnexin-mCherry (red) in GFP-RAB22AQ64L stable HeLa cells transiently expressing calnexin-mCherry. Scale bar, 10 μm. d Immunofluorescence analysis of GFP-RAB22AQ64L (green) and calnexin (red) in GFP-RAB22AQ64L stable HeLa cells using SIM. Scale bar, 5 μm. e Time-lapse images showing GFP-RAB22AQ64L (green) and calnexin-mCherry (red) in living tet-on GFP-RAB22AQ64L stable HeLa cells transiently expressing calnexin-mCherry treated with 50 ng/mL doxycycline (dox) (Supplementary information, Video S1). Scale bar, 10 μm. f Time-lapse images showing GFP-RAB22AQ64L (green) and STINGV155M-Halo (red) in living tet-on GFP-RAB22AQ64L stable HeLa cells transiently expressing STINGV155M-Halo and treated with 50 ng/mL dox (Supplementary information, Video S2). Scale bar, 10 μm.
Fig. 6
Fig. 6. RAB22A-mediated non-canonical autophagy depends on PI4P generated by PI4K2A.
a Left, schematic diagram showing inducible recruitment system for phosphatases: Rapa (1 μM, 6 h) induces the heterodimerization of FRB and FKBP12, thereby recruiting the phosphatase to RAB22A to hydrolyze its target phospholipid. Right, inducible translocation of the 4’ phosphatase (GFP-FKBP-SAC1) to FRB-Flag-RAB22AQ64L-induced Refeesomes. Immunofluorescence analysis of Flag (red), LC3 (magenta), and GFP-FKBP-SAC1 (green) in FRB-Flag-RAB22AQ64L stable HeLa cells treated with or without 1 μM Rapa for 6 h. Percentage of MVB-like structures containing LC3 was quantified on the right. P value was calculated by Student’s t-test. n = 6 fields. Scale bar, 10 μm. b Western blot analysis of WCL from stable Flag-RAB22AQ64L HeLa cells treated with the PI4K inhibitor PAO (5 μM) for 4 h. c Immunofluorescence analysis of Flag (red) and LC3 (magenta) with STINGV155M-GFP (green) in stable Flag-RAB22AQ64L HeLa cells transiently expressing STINGV155M-GFP and treated with 5 μM PAO for 4 h. Percentages of MVB-like structures containing LC3 and STINGV155M were quantified respectively on the right. P values were calculated by Student’s t-test. n = 6 fields. Scale bar, 10 μm. d Western blot analysis of WCL from stable Flag-RAB22AQ64L HeLa cells transfected with two different siRNAs targeting PI4K2A and reintroduced with WT PI4K2A or kinase-dead PI4K2AK152A. e Immunofluorescence analysis of endogenous calnexin (green) and PI4K2A (red) in HeLa cells. White arrowheads denote co-localization. Scale bar, 10 μm. f Immunofluorescence analysis of endogenous RAB22A (green) and PI4K2A (red) in NCI-H1975 cells. White arrowheads denote co-localization. Scale bar, 10 μm. g Immunofluorescence analysis of GFP (green), calnexin (magenta), and PI4K2A-HA (red) in the indicated stable HeLa cells transiently expressing PI4K2A-HA. White arrowheads denote co-localization. Scale bar, 10 μm. h Western blot analysis of WCL and immunoprecipitates from HeLa cells using an anti-RAB22A antibody. i Western blot analysis of the WCL of PI4K2A-knockdown stable 4T1 cells treated with 10 µM diABZI at the indicated time points. j Western blot analysis of the EVPs from PI4K2A-knockdown stable 4T1 cells treated with or without 10 µM diABZI. km Dissected tumors (k), tumor growth curve (l), and tumor weight (m) for xenograft experiments. The indicated stable 4T1 cells were inoculated orthotopically into BALB/c mice for 5 days, and the mice were then treated with or without 3 mg/kg diABZI three times per week by intravenous tail injection as indicated for another 12 days. Visible tumors were measured every 2 days. P value of tumor growth curve was calculated by two-way ANOVA, and P value of tumor weight was calculated by Student’s t-test. n = 8. The data are presented as the means ± SEM. n Cell viability was measured by the MTT assay in the indicated stable 4T1 cells.
Fig. 7
Fig. 7. PI4P directly recruits Atg16L1 to the ER-derived membrane, thereby promoting non-canonical autophagy.
a Immunofluorescence analysis of calnexin (green) and HA-Atg16L1 (red) in the RAB22A stable HeLa cells transiently expressing HA-Atg16L1. White arrowheads denote co-localization. Scale bar, 10 μm. b Western blot analysis of the WCL of the HeLa cells transiently expressing siRNAs targeting SAC1 for 48 h. c Immunofluorescence analysis of HA-Atg16L1 (red) and calnexin (green) in HeLa cells transiently expressing siRNAs targeting SAC1 for 48 h. Co-localization of HA-Atg16L1 with calnexin was quantified on the right. White arrowheads denote co-localization. P value was calculated by Student’s t-test. n = 6 fields. Scale bar, 10 μm. d Atg16L1 has a polybasic region. e Pull-down assay with PI4P-coated beads from 293T cells expressing WT HA-Atg16L1 and HA-Atg16L1 6A as indicated. f Liposome-binding assay showing that PI4P liposome has a higher binding affinity to HA-Atg16L1 WT proteins compared to HA-Atg16L1 6A mutant purified from HEK-293T cells. Ratio of liposome-binding proteins/input was quantified. P value was calculated by Student’s t-test. g Western blot analysis of WCL from stable Flag-RAB22AQ64L HeLa cells with ATG16L1 knockout and transient expression of HA-Atg16L1 WT or mutants of polybasic region-mutated HA-Atg16L1. h Immunofluorescence analysis of Flag (magenta), EGFP-PHOSBP (green), and HA-Atg16L1/HA-Atg16L1 6A (red) in stable Flag-RAB22A HeLa cells transiently transfected with EGFP-PHOSBP and HA-Atg16L1 or HA-Atg16L1 6A. Scale bar, 10 μm. i Immunofluorescence analysis of calnexin (green) and HA-Atg16L1 or HA-Atg16L1 6A (red) in stable Flag-RAB22A HeLa cells transiently transfected with HA-Atg16L1 or HA-Atg16L1 6A. White arrowheads denote co-localization. Scale bar, 10 μm.
Fig. 8
Fig. 8. The proposed model for the intercellular transfer of activated STING conferring antitumor immunity.
In tumor cells, RAB22A engages PI4K2A to generate PI4P, which recruits the Atg12–Atg5–Atg16L1 complex to facilitate LC3 lipidation on the ER-derived membrane. This promotes the formation of non-canonical autophagosomes, in which activated STING stimulated by agonists or chemoradiotherapy is localized. These RAB22A-induced autophagosomes fuse with RAB22A-positive early endosomes to become Rafeesomes. In addition, RAB22A inactivates RAB7, suppressing the fusion of Rafeesomes with lysosomes. This enables the inner vesicles of non-canonical autophagosomes bearing activated STING within Rafeesomes to be secreted as R-EVs, which activate the IFNβ pathway in recipient cells in the tumor microenvironment, enhancing antitumor immunity.

Comment in

  • A new route for EV biogenesis.
    Yu L. Yu L. Cell Res. 2023 Feb;33(2):87-88. doi: 10.1038/s41422-022-00747-2. Cell Res. 2023. PMID: 36588117 Free PMC article. No abstract available.

References

    1. Zhang X, Bai XC, Chen ZJ. Structures and mechanisms in the cGAS-STING innate immunity pathway. Immunity. 2020;53:43–53. doi: 10.1016/j.immuni.2020.05.013. - DOI - PubMed
    1. Hopfner KP, Hornung V. Molecular mechanisms and cellular functions of cGAS-STING signalling. Nat. Rev. Mol. Cell Biol. 2020;21:501–521. doi: 10.1038/s41580-020-0244-x. - DOI - PubMed
    1. Li A, et al. Activating cGAS-STING pathway for the optimal effect of cancer immunotherapy. J. Hematol. Oncol. 2019;12:35. doi: 10.1186/s13045-019-0721-x. - DOI - PMC - PubMed
    1. Vanpouille-Box C, Hoffmann JA, Galluzzi L. Pharmacological modulation of nucleic acid sensors – therapeutic potential and persisting obstacles. Nat. Rev. Drug Discov. 2019;18:845–867. doi: 10.1038/s41573-019-0043-2. - DOI - PubMed
    1. Marcus A, et al. Tumor-derived cGAMP triggers a STING-mediated interferon response in non-tumor cells to activate the NK cell response. Immunity. 2018;49:754–763.e4. doi: 10.1016/j.immuni.2018.09.016. - DOI - PMC - PubMed

Publication types

Substances

LinkOut - more resources