. 2022 Nov;19(11):1490-1499.
doi: 10.1038/s41592-022-01650-9. Epub 2022 Oct 24.

CODA: quantitative 3D reconstruction of large tissues at cellular resolution

Affiliations

CODA: quantitative 3D reconstruction of large tissues at cellular resolution

Ashley L Kiemen et al. Nat Methods. 2022 Nov.

Abstract

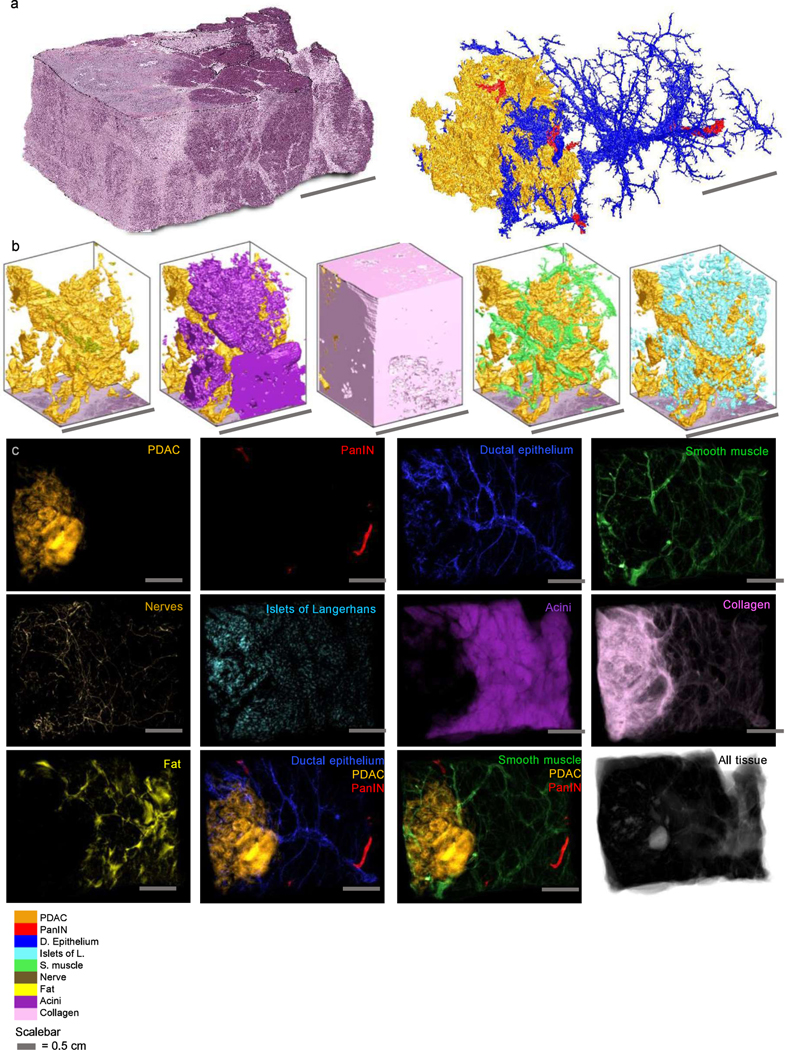
A central challenge in biology is obtaining high-content, high-resolution information while analyzing tissue samples at volumes relevant to disease progression. We address this here with CODA, a method to reconstruct exceptionally large (up to multicentimeter cubed) tissues at subcellular resolution using serially sectioned hematoxylin and eosin-stained tissue sections. Here we demonstrate CODA's ability to reconstruct three-dimensional (3D) distinct microanatomical structures in pancreas, skin, lung and liver tissues. CODA allows creation of readily quantifiable tissue volumes amenable to biological research. As a testbed, we assess the microanatomy of the human pancreas during tumorigenesis within the branching pancreatic ductal system, labeling ten distinct structures to examine heterogeneity and structural transformation during neoplastic progression. We show that pancreatic precancerous lesions develop into distinct 3D morphological phenotypes and that pancreatic cancer tends to spread far from the bulk tumor along collagen fibers that are highly aligned to the 3D curves of ductal, lobular, vascular and neural structures. Thus, CODA establishes a means to transform broadly the structural study of human diseases through exploration of exhaustively labeled 3D microarchitecture.


Conflict of interest statement

Competing interests: Authors declare that they have no competing interests.

Figures

Extended Data Fig 1
Extended Data Fig 1. Histological image registration sample workflow.
(a)Tissue cases registered with reference at center z-height of sample. Example fixed and moving images shown. Global registration performed with rotational reference at center of fixed image. Fixed and moving images smoothed by conversion to greyscale, removal of non-tissue objects in image, intensity complementing, and Gaussian filtering to reduce pixel-level noise in images. Radon transforms calculated filtered fixed and moving for discrete degrees 0–360. Maximum of 2D cross correlation of radon transforms yields registration angle. Maximum of 2D cross correlation of filtered images yields registration translation. Local registration performed at discrete intervals across fixed image. For each reference point, tiles are cropped from fixed and moving images and coarse registration is performed on tiles. Results from all tiles are interpolated on 2D grids to create nonlinear whole-image displacement fields. Sample overlays of pre and post registration. (b) Sample validation image from ref . with overlayed fiducial points. Normalized performance metrics (explained in further detail in supplementary materials).
Extended Data Fig 2
Extended Data Fig 2. Validation of cell count and 2D to 3D cell count extrapolation.
(a) Sample histological section and corresponding color deconvolved hematoxylin channel of image. All cells in five validation images were manually annotated by two persons. Annotations were compared to CODA outputs and outputs from two existing cell counting methods,. (b) Cell diameters of each tissue subtype were measured using Aperio ImageScope. 2D cell counts were extrapolated to 3D using the formula listed. It was assumed that cells could be detected by the algorithm if any part of the nucleus touched the tissue section. Therefore, effective tissue section thickness equals true tissue section thickness plus the diameter of the cell. 3D cell counts were estimated by multiplying 2D cell counts by the true thickness of the tissue section, multiplied by three because two sections were skipped during scanning, divided by the effective thickness of the section.
Extended Data Fig 3
Extended Data Fig 3. Overview of semantic segmentation workflow and training data design.
(a) For each case, a minimum of seven images were extracted from for manual annotation. For each extracted image, minimum 50 examples of each tissue type were annotated, and the annotations cropped from the larger image. (b) To construct training and validation sets, cropped annotations were overlayed on a large image until the image was >65% full and such that the number of annotations of each type was roughly equal. (c) These large tiles were cut into smaller tiles for training and validation. Additional tiles were created for the testing set where the annotation was not cropped from the image. Testing accuracy was assessed as the percentage of the annotated area of the tile classified correctly. Following model training, the serial images were cropped into tiles and semantically segmented.
Extended Data Fig 4
Extended Data Fig 4. Sample deep learning accuracy and multi-patient model.
(a) Sample predicted vs. true outcomes for deep learning models for sample PI (left) and P8 (right). (b) Workflow for creation of multi-patient semantic segmentation of nerves. Nerve annotations collected from thirteen pancreas samples. Original tissue annotations reformatted to: l . smooth muscle, 2. collagen, 3. other tissue (islets, normal ducts, acini, precursor, lymph, PDAC), 4. white (whitespace, fat). Nerve annotations combined with original annotations to create a dataset for nerve recognition in H&E images. (c) Predicted vs. true outcomes for multi-patient nerve detection model.
Extended Data Fig 5
Extended Data Fig 5. Additional methodological supplemental.
(a) Quantification of loss in quality due to reducing the z-resolution of serial samples. Calculation of pixel correlation across the z-axis (Left) shows that >95% correlation is maintained post-registration when skipping up to four serial sections, or 20μm, between each H&E collected. Calculation of % change in cell count (center) and tissue composition (right) reveals <5% error in 3D cell count and tissue composition extrapolation when skipping up to two serial sections, or 12μm, between each H&E collected). (b) Tissues labelled by CODA in H&E-stained tissue sections of human pancreas. (c) Comparison of nuclear aspect ratio measurements performed by person I and person 2 show nonsignificant differences between measurements.
Extended Data Fig 6
Extended Data Fig 6. 3D reconstruction of sample P1.
(a) Global reconstruction of and ducts. (b) 3D rendering of subregions, showing ducts, fat, acini, collagen, blood vessels, and islets of Langerhans. (c) Z-projections of labelled tissues (intensities enhanced for visibility).
Extended Data Fig 7
Extended Data Fig 7. 3D reconstruction of sample P2.
(a) Global reconstruction of H&E, ducts, and PanIN. (b) 3D rendering of subregions, showing PanIN, ducts, fat, acini, collagen, blood vessels, and islets of Langerhans. (c) Z-projections of labelled tissues (intensities enhanced for visibility).
Extended Data Fig 8
Extended Data Fig 8. 3D reconstruction of S05-PDAC.
(a) Global reconstruction of H&E, ducts, PanIN, and PDAC. (b) 3D rendering of subregions, showing PDAC, PanIN, ducts, fat, acini, collagen, blood vessels, and islets of Langerhans. (c) Z-projections of labelled tissues (intensities enhanced for visibility).
Fig. 1.
Fig. 1.. CODA.
(a) Human pancreatic tissue was serially-sectioned, stained, and scanned. (b) Images were registered using a nonlinear approach to create a digital volume. (c) Cells were identified using the hematoxylin channel of the H&E images. (d) Deep learning semantic segmentation models were trained using randomly overlaid annotations of tissue types. Images are labelled to a resolution of 2μm. (e) 3D reconstruction of >1000 serially sectioned pancreas sections. 3D renderings are created at the cm, mm, and μm scale at tissue and single cell resolution.
Fig. 2.
Fig. 2.. Validation of CODA registration and ability to skip z-sections.
(a) Sample validation image (from an online dataset first published in ref ) with overlayed fiducial points. Normalized performance metrics: target registration error (TRE); accumulated target registration error (ATRE); root mean squared error (RMSE); Jaccard Index (J); and pre/post registration change in area (dA). (b) Quantification of loss in quality due to reducing the z-resolution of serial samples. Calculation of pixel correlation across the z-axis (left) shows that >95% correlation is maintained post-registration when skipping up to four serial sections, or 20μm, between each H&E collected. (c) Calculation of % change in cell count and (d) tissue composition (right) reveals <5% error in 3D cell count and tissue composition extrapolation when skipping up to two serial sections, or 12μm, between each H&E collected). (e) Validation of 3D rendering quality due to reducing the z-resolution of serial samples. Tissues in this study are modeled using a spacing of 12 μm between sections (top-right rendering).
Fig. 3.
Fig. 3.. CODA processing of additional organs.
(a) 3D reconstruction of human scalp tissue. Sample H&E and semantically segmented image (far left), visualization of the H&E volume (topleft), epidermis, sweat glands, and oil glands (top right), external (bottom left) and internal (bottom right) views of epidermis, hair follicles and oil glands, and visualization of single cell resolution (far right). (b) 3D reconstruction of mouse lung tissue. Z-projections of all components together and individually (left) and 3D renderings of bronchioles (right-top) and vasculature and metastases (right-bottom). (c) 3D reconstruction of mouse liver tissue. Sample H&E and semantically segmented image (far left), z-projection of vasculature and bile duct (middle-top) and hepatocytes (middle-bottom) and 3D rendering of vasculature (far right).
Fig. 4.
Fig. 4.. Inter-patient pancreas analysis from cm-scale to single cell resolution.
(a) Thirteen samples of up to multi cm-scale containing normal, precancerous, and cancerous human pancreas were reconstructed. Tissue volumes, cell counts, and cell densities were calculated. (b) Bulk cell density decreases > 3-fold in N=7 cancerous human pancreas relative to N=8 grossly normal human pancreas. **** indicates a p-value<0.0001 using the Wilcoxon rank sum test.
Fig. 5.
Fig. 5.. Microarchitectural patterns in pancreatic precancers.
(a) 43 Spatially independent precancers in sample P2 were color coded and labelled on H&E serial sections and a 3D reconstruction. (b) Number of precancers per 2D section normalized by true 3D precancer number was calculated for samples containing precancers. (c) 3D renderings and sample histology illustrate three 3D phenotypes of PanIN observed. Tubular PanIN preserve normal pancreatic ductal morphology, lobular PanIN resemble acinar lobules, and dilated PanIN reside in dilated ducts or lobules.
Fig. 6.
Fig. 6.. 3D Patterns in pancreatic cancer invasion.
(a) Occurrence of venous invasion, (peri)neural invasion, and invasion along collagen fibers identified in eight samples containing PDAC. Selected 3D reconstructions of pancreatic cancer invasion patterns: invasion along periductal collagen, venous invasion, and perineural invasion. (b) 3D reconstruction of normal ductal epithelium with identified coordinates of longitudinal and axial sectioning. H&E images extracted from coordinates and eosin channel isolated. (c) Nuclear aspect ratio and fiber anisotropy index, representing local fiber alignment, of 90 longitudinally and 90 axially sectioned ducts, blood vessels, and nerves from 10 patient samples. Nuclear elongation and fiber alignment were significantly higher in longitudinal compared to axial sections. **** indicates a p-value < 0.0001 using the Wilcoxon rank sum test.

References

    1. Liebig C, Ayala G, Wilks JA, Berger DH & Albo D. Perineural invasion in cancer. Cancer 115, 3379–3391 (2009). - PubMed
    1. Hong SM et al. Three-dimensional visualization of cleared human pancreas cancer reveals that sustained epithelial-to-mesenchymal transition is not required for venous invasion. Mod. Pathol. 2019 334 33, 639–647 (2019). - PMC - PubMed
    1. Siegel RL, Miller KD, Fuchs HE & Jemal A. Cancer Statistics, 2021. CA. Cancer J. Clin. 71, 7–33 (2021). - PubMed
    1. Michaud DS et al. Physical Activity, Obesity, Height, and the Risk of Pancreatic Cancer. JAMA 286, 921–929 (2001). - PubMed
    1. Hruban RH et al. Why is pancreatic cancer so deadly? The pathologist’s view. J. Pathol. 248, 131–141 (2019). - PubMed

Online Methods References:

    1. Goode A, Gilbert B, Harkes J, Jukic D, Satyanarayanan M, OpenSlide: A vendor-neutral software foundation for digital pathology. Journal of pathology informatics 4, 27 (2013). - PMC - PubMed
    1. Kartasalo K. et al. Comparative analysis of tissue reconstruction algorithms for 3D histology. Bioinformatics 34, 3013 (2018). - PMC - PubMed
    1. Wu PH et al. High-throughput ballistic injection nanorheology to measure cell mechanics. Nat. Protoc. 2012 71 7, 155–170 (2012). - PMC - PubMed
    1. Graham S. et al. Hover-Net: Simultaneous segmentation and classification of nuclei in multi-tissue histology images. Med. Image Anal. 58, 101563 (2019). - PubMed
    1. Bankhead P. et al. QuPath: Open source software for digital pathology image analysis. Sci. Reports 2017 71 7, 1–7 (2017). - PMC - PubMed

Publication types

MeSH terms