. 2022 Nov;19(11):1449-1460.
doi: 10.1038/s41592-022-01643-8. Epub 2022 Oct 24.

Geometric engineering of organoid culture for enhanced organogenesis in a dish

Affiliations

Geometric engineering of organoid culture for enhanced organogenesis in a dish

Sunghee Estelle Park et al. Nat Methods. 2022 Nov.

Abstract

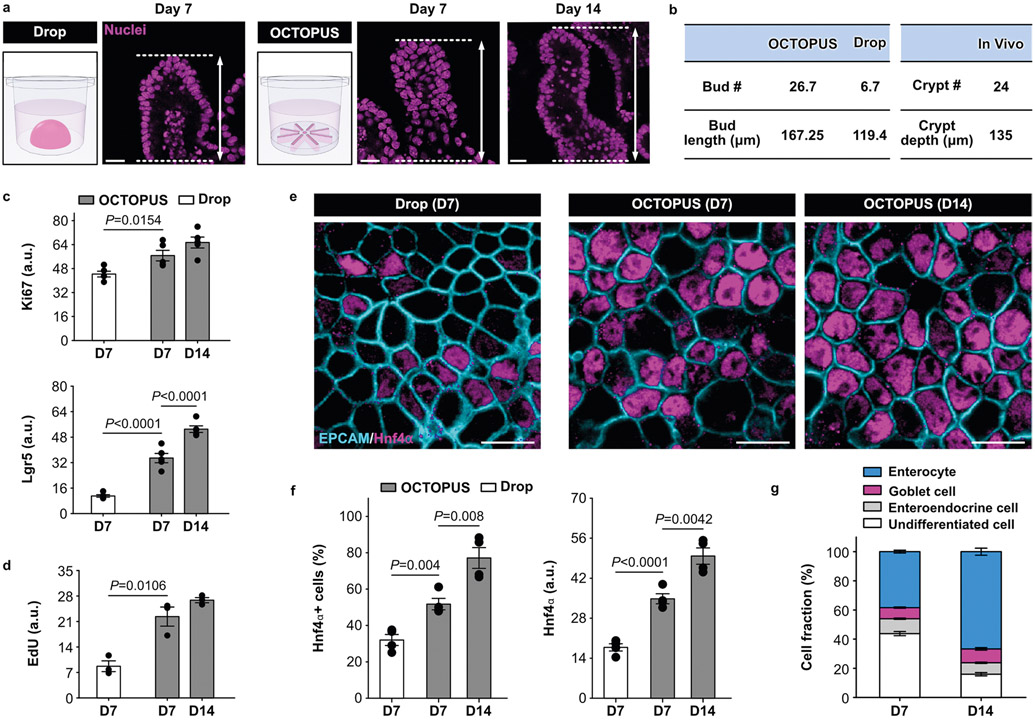
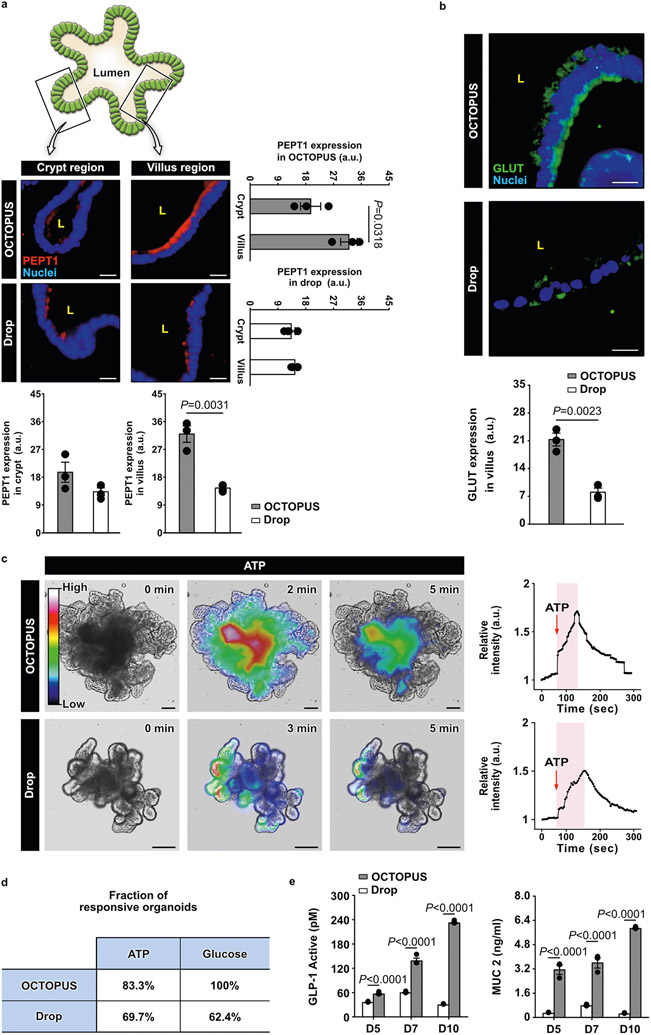
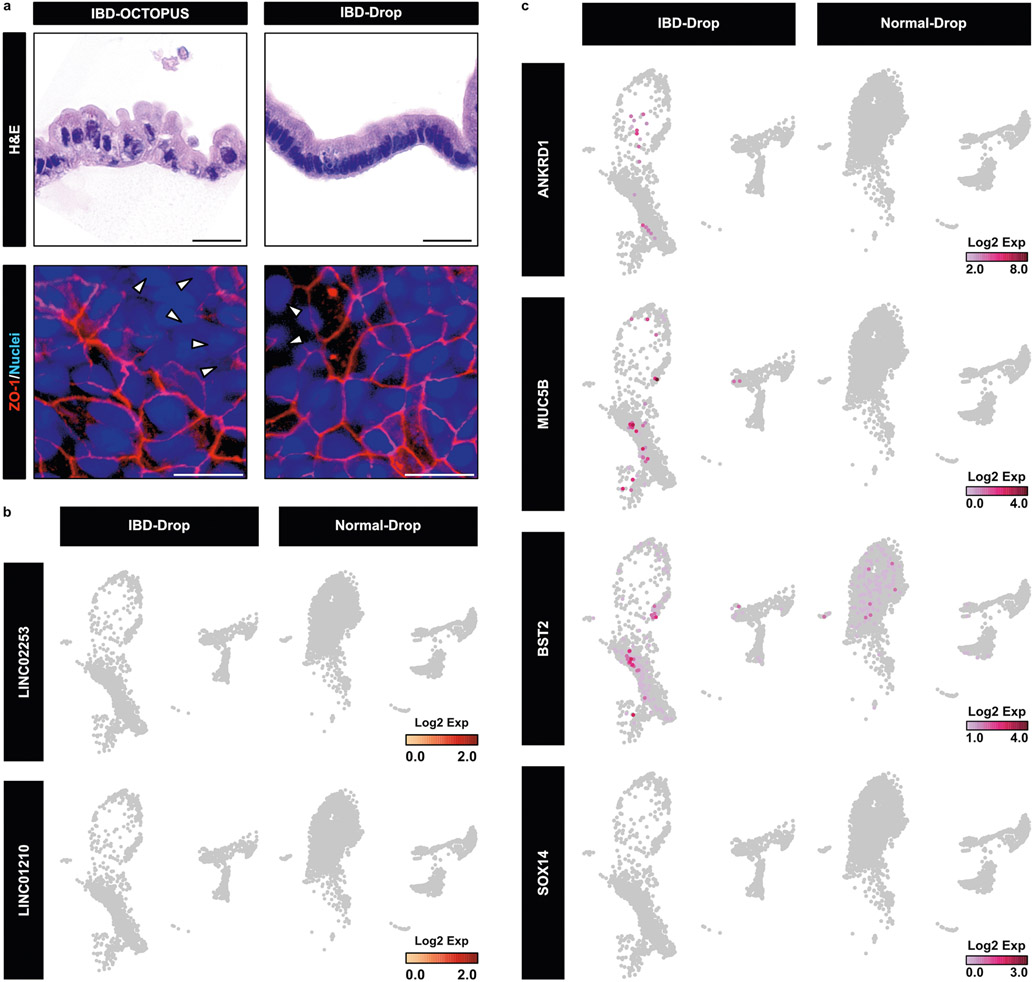
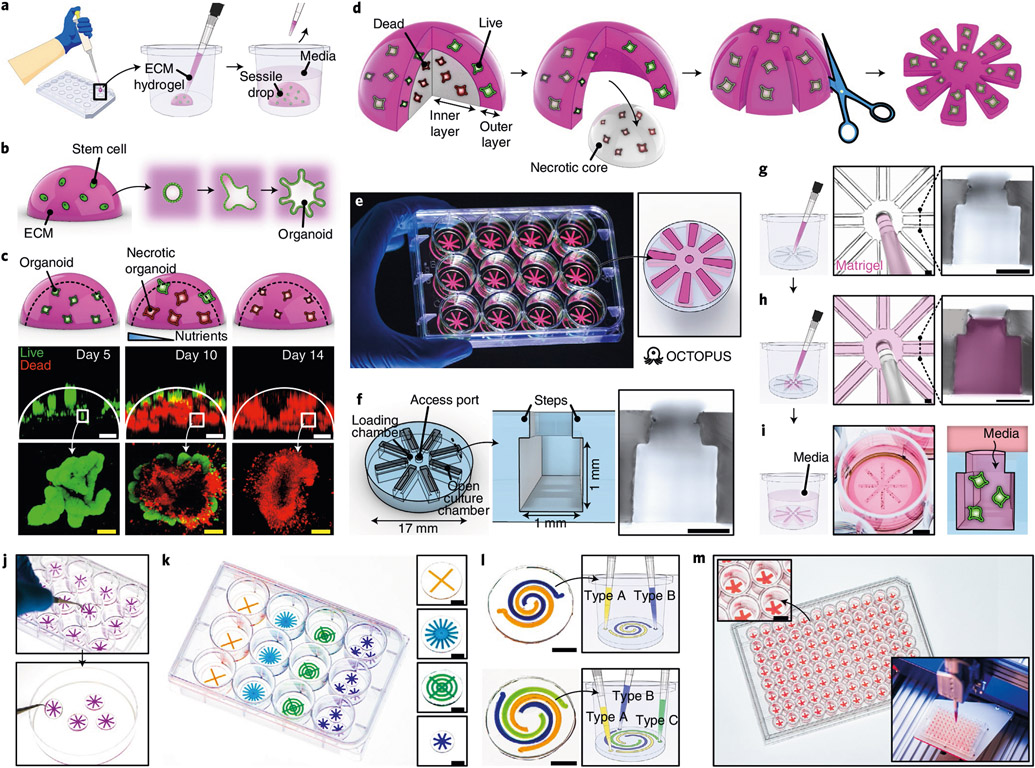
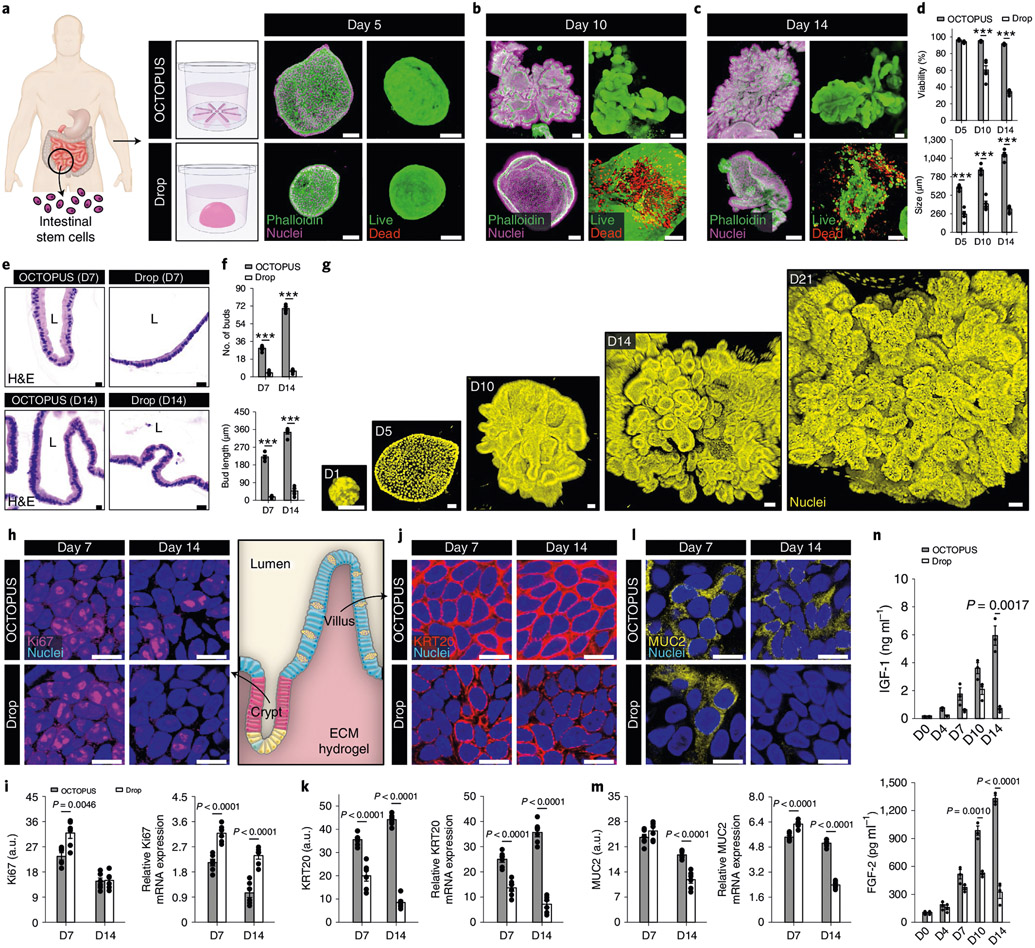
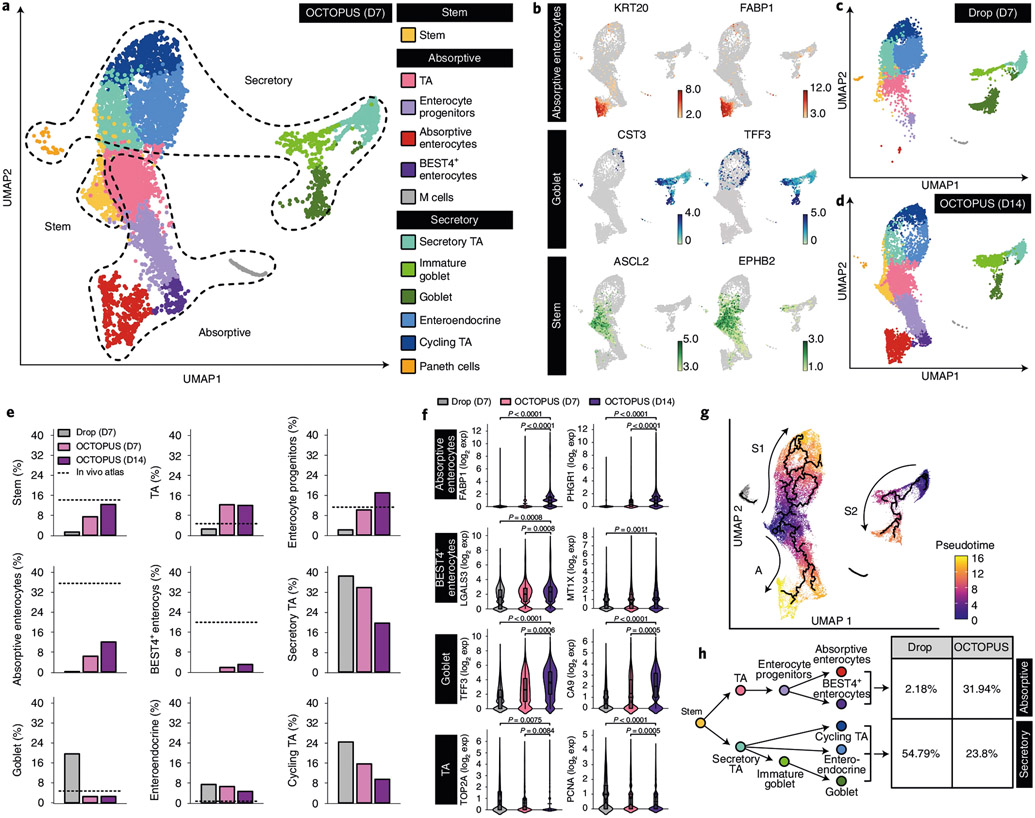
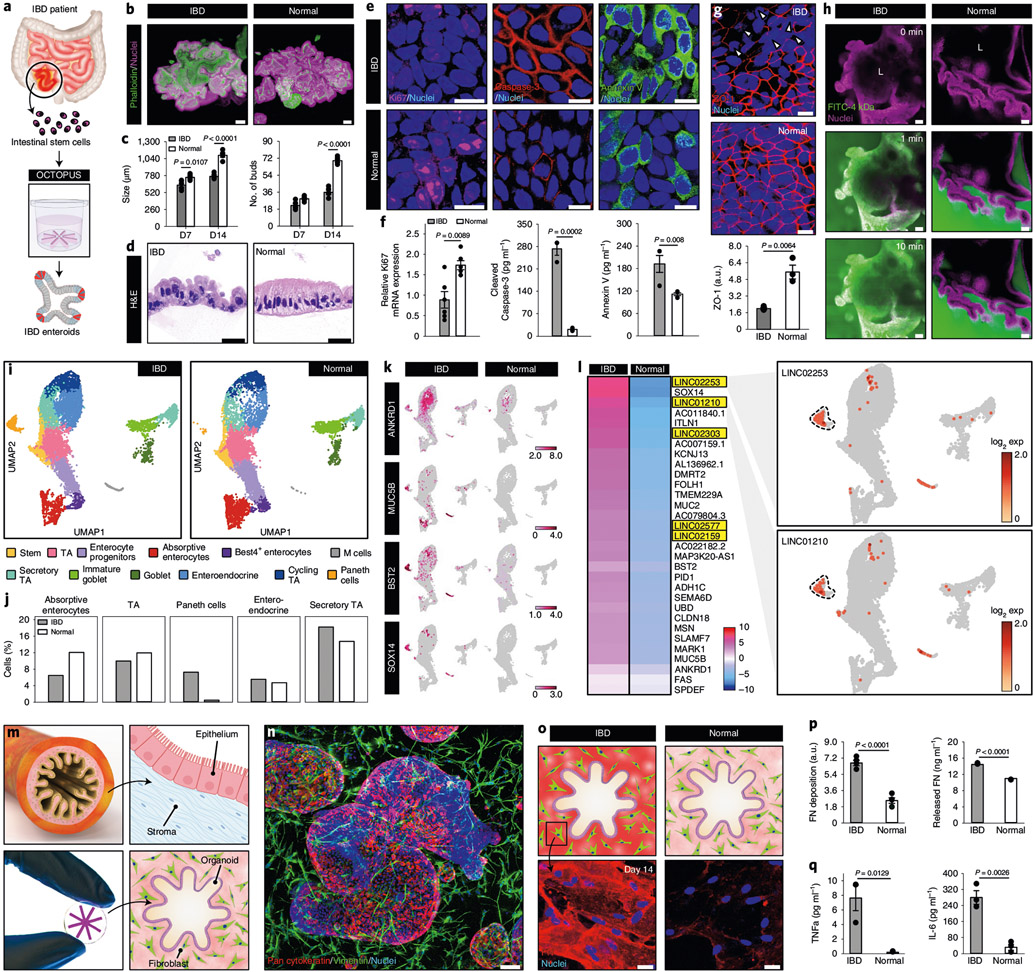
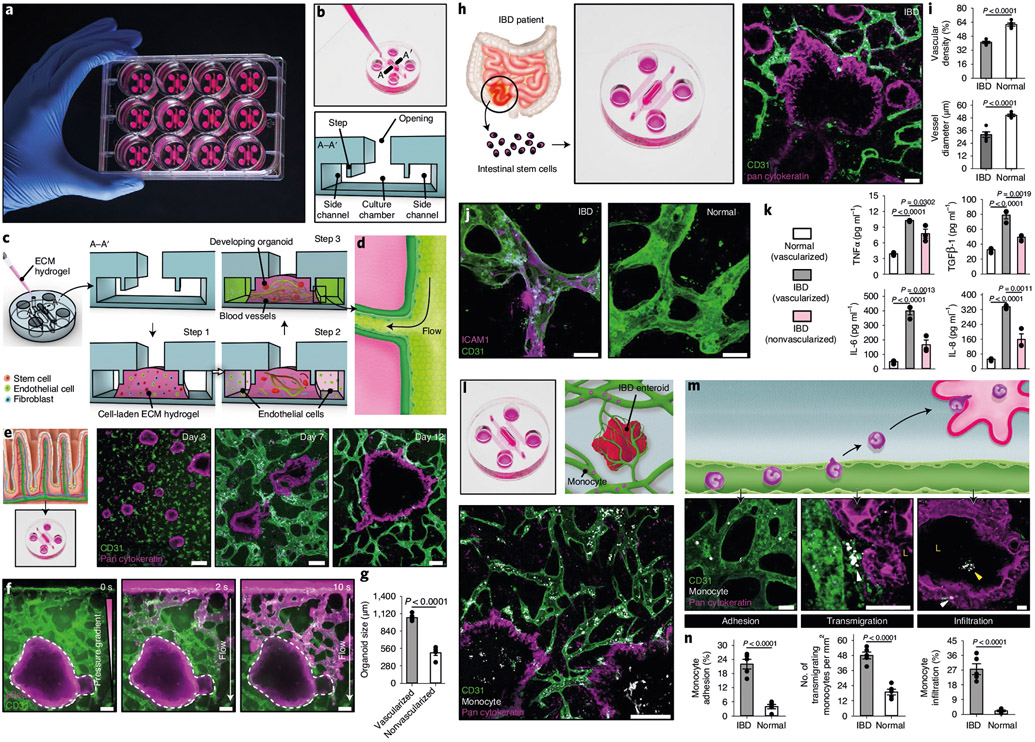
Here, we introduce a facile, scalable engineering approach to enable long-term development and maturation of organoids. We have redesigned the configuration of conventional organoid culture to develop a platform that converts single injections of stem cell suspensions to radial arrays of organoids that can be maintained for extended periods without the need for passaging. Using this system, we demonstrate accelerated production of intestinal organoids with significantly enhanced structural and functional maturity, and their continuous development for over 4 weeks. Furthermore, we present a patient-derived organoid model of inflammatory bowel disease (IBD) and its interrogation using single-cell RNA sequencing to demonstrate its ability to reproduce key pathological features of IBD. Finally, we describe the extension of our approach to engineer vascularized, perfusable human enteroids, which can be used to model innate immune responses in IBD. This work provides an immediately deployable platform technology toward engineering more realistic organ-like structures in a dish.


Figures

Extended Data Fig. 1 ∣
Extended Data Fig. 1 ∣. Co-culture of organoids in OCTOPUS.
Co-culture of mouse liver and intestinal organoids in OCTOPUS. The OCTOPUS insert shown in this example contains two juxtaposed spiral chambers with independent access ports. Scale bars, 300 μm (left image) and 100 μm (right images).
Extended Data Fig. 2 ∣
Extended Data Fig. 2 ∣. Diffusion of soluble factors in OCTOPUS.
a, b. Visualization of 70 kDa FITC-dextran diffusion into the inner and outer regions of the hydrogel scaffolds in Matrigel drop (a) and OCTOPUS (b). The organoids in the inner and outer regions were located 600 μm (OCTOPUS)/2400 μm (Matrigel drop) and 400 μm (both groups) from the hydrogel surface, respectively. Scale bars, 100 μm. c. Temporal profiles of mean fluorescence intensity (MFI) due to dextran diffusion. d, e. Visualization of temporal changes in oxygen concentration in the inner and outer regions of Matrigel scaffolds in conventional drop culture (d) and OCTOPUS (e). Quenching of blue fluorescence shown in the micrographs was caused by an increase in the level of oxygen. f. Temporal profiles of normalized fluorescence intensity due to oxygen diffusion into Matrigel (n=3 independent experiments).
Extended Data Fig. 3 ∣
Extended Data Fig. 3 ∣. Culture of mouse liver organoids in OCTOPUS.
a, b. Formation and extended culture of mouse liver organoids in OCTOPUS and conventional drop culture. Scale bars, 100 μm (n=5 biologically independent experiments). c. Confocal micro-graphs showing the expression of albumin (ALB) in mouse liver organoids. Scale bars, 10 μm. ELISA analysis of (d) albumin and (e) urea in conditioned media (n=3 biologically independent experiments). All data are presented as mean ± SEM and P values are from unpaired, two-sided t test.
Extended Data Fig. 4 ∣
Extended Data Fig. 4 ∣. Maturation of intestinal organoids in OCTOPUS.
a. Comparison of bud length. Confocal micrographs show the cross-section of buds extending from the main body of the organoids. In each image, the white dashed lines indicate the approximated positions of the base and tip of a bud. Organoids in OCTOPUS generate more elongated buds. Scale bars, 20 μm. b. Comparison of the number and size of organoid buds in vitro to those of mouse intestinal crypts in vivo. c, d. Quantification of Ki67, Lgr5, and EdU expression in mouse intestinal organoids (n = 5 and 3 biologically independent experiments for (c) and (d), respectively). e. Organoids developing in OCTOPUS exhibit increased expression of Hnf4α, a marker of mature intestinal epithelial cells, compared to the control group in Matrigel drop. Scale bars, 10 μm. f. Quantification of the fraction of Hnf4α+ cells and the level of Hnf4α expression. Immunofluorescence of Hnf4α was normalized with respect to the number of cells (n = 4). g. The graph shows the cellular composition of the intestinal epithelium in OCTOPUS. Quantification was performed by measuring the immunofluorescence of cell type-specific markers described in Fig. 2m. Undifferentiated cells were identified by positive DAPI staining without the expression of differentiation markers. The data indicate the abundance of enterocytes (79% of the differentiated cell population at day 14) (n = 3). All data are presented as meant SEM and P values are from unpaired, two-sided t test.
Extended Data Fig. 5 ∣
Extended Data Fig. 5 ∣. Effect of co-culture on organoid development in OCTOPUS.
a. Co-culture of intestinal organoids and fibroblasts to mimic the epithelial-stromal unit of the intestine. Scale bar, 300 μm. b, c. In comparison to monoculture, the co-culture organoids are larger and express higher levels of Hnf4α expression. Scale bars, 100 μm (b), and 10 μm (c). All data are presented as mean ± SEM and P values are from unpaired, two-sided t test (n = 5 biologically independent experiments).
Extended Data Fig. 6 ∣
Extended Data Fig. 6 ∣. Functional characterization of intestinal organoids in OCTOPUS.
a. Immunofluorescence analysis of PEPT1, a nutrient transporter responsible for intestinal uptake of peptides. In this analysis, organoids in Matrigel drops at the maximum duration of culture (7 days) were compared to those maintained in OCTOPUS for 14 days to examine the contribution of extended culture. Organoids in OCTOPUS exhibit robust immunostaining of PEPT1 predominantly in the villus domain of the organoids. PEPT1 expression in this region is restricted to the apical surface of the epithelium facing the organoid lumen (L), matching the localized distribution of PEPT1 on the brush border membrane of the native intestinal epithelium. This polarized expression of PEPT1 is also observed in the villus surface of the organoids in Matrigel drop culture but the level of expression is significantly lower than that in OCTOPUS. Scale bars, 20 μm. b. Comparison of GLUT immunofluorescence in the villus domain of organoids. GLUT is ex-pressed on both the apical and basal surfaces of the villus epithelium in OCTOPUS. This trans-porter is also present in drop culture but its immunofluorescence is much weaker. Scale bars, 20 μm (n = 3 biologically independent experiments). c. Imaging and quantification of intracellular calcium signaling in intestinal organoids treated with 100 μM ATP. in the plots of relative intensity, the time between organoid stimulation and maximum fluorescence intensity is shaded in pink. Data were normalized to fluorescence intensity at the initial time point (t = 0 min). Scale bars, 100 μm (n = 3). d. Fraction of responsive organoids. The fraction of organoids that respond to ATP and glucose stimulation is larger in OCTOPUS. e. ELISA analysis of an active form of GLP-1 and MUC2 secreted by intestinal organoids. Both analytes are produced in significantly higher concentrations in OCTOPUS, which also continue to increase over time during extended culture (n = 3 biologically independent experiments). All data are presented as mean ± SEM and P values are from unpaired, two-sided t test.
Extended Data Fig. 7 ∣
Extended Data Fig. 7 ∣. Passaging and expansion of intestinal organoids in OCTOPUS.
a. Experimental procedure for passaging organoids in OCTOPUS. Subculture and expansion of (b) mouse and (c) human intestinal organoids grown in OCTOPUS and Matrigel drop. For comparison, culture conditions (for example, seeding density, hydrogel volume, media composition) were kept the same between the two systems. After 7 days of culture, organoids at a given passage number (Passage N) were physically dissociated and then transferred to new OCTOPUS devices or Matrigel drops (Passage N+1) at densities of 200 crypts/100 μl and 100 crypts/60 μl for mouse and human intestinal organoids, respectively. White solid lines in the micrographs show the outline of culture chambers in the OCTOPUS device or a sessile drop of Matrigel. Scale bars, 1 mm.
Extended Data Fig. 8 ∣
Extended Data Fig. 8 ∣. IBD enteroids cultured in Matrigel drops.
a. When cultured in Matrigel drops, IBD enteroids show properly polarized epithelial cells (top right) that resemble those in the epithelium of normal enteroids. In comparison to IBD enteroids in OCTOPUS, they also retain the structural integrity of the epithelium as visualized by ZO-1 expression (bottom right). Scale bars, 5 μm. b. UMAP plots showing the expression of two representative LINC genes by IBD and normal enteroids cultured in Matrigel drops. c. UMAP plots showing the expression of 4 representative IBD-associated genes by IBD and normal enteroids cultured in Matrigel drops.
Fig. 1 ∣
Fig. 1 ∣. Geometric engineering of conventional organoid culture using OCTOPUS.
a,b, Schematic showing conventional techniques that rely on 3D culture (a) and self-organization (b) of stem cells in sessile drops of ECM hydrogel to form organoids. c, Top row: schematic showing the formation of necrotic core in Matrigel drop culture. Middle and bottom rows: loss of viability and structural integrity in Matrigel drop culture of intestinal organoids over 10–14 d due to limited nutrient supply. Green and red show live and dead cells, respectively. Scale bars, 500 μm (top images) and 100 μm (bottom images). d, Conceptual diagram that shows the idea of reconfiguring the geometry of a conventional hydrogel drop scaffold to culture organoids without diffusion limitations. e, Photo of OCTOPUS inserts in a standard 12-well cell culture plate. f, Device design of OCTOPUS. The micrograph shows the cross-section of the culture chamber. Scale bar, 500 μm. g,h, Injection and distribution of stem-cell-containing Matrigel solution into the culture chambers of OCTOPUS. The micrographs show the top-down view of the access port with a 200-μl pipette tip (left) and the cross-section of the chamber (right) before (g) and after (h) gel injection. Pink shows Matrigel. Scale bars, 500 μm. i, OCTOPUS is kept submerged in media during culture. Developing organoids in the hydrogel are supplied with nutrients through the opening of the culture chambers. Scale bar, 5 mm. j, Facile handling and transferability of OCTOPUS. k, Examples of different chamber/device designs in OCTOPUS. Scale bars, 5 mm. l, Multi-chamber designs for co- and tri-culture in OCTOPUS. Scale bars, 5 mm. m, OCTOPUS can be deployed as a culture platform in a 96-well format coupled with a robotic fluid handling system to scale up the production of organoids. Scale bar, 3 mm.
Fig. 2 ∣
Fig. 2 ∣. Effects of long-term culture on the maturation of intestinal organoids in OCTOPUS.
a, Mouse intestinal adult stem cells in Matrigel self-assemble into intestinal organoids in both OCTOPUS and drop culture. Scale bars, 100 μm. b,c, When observed at 10 d (b) and 14 d (c), organoids in OCTOPUS continue their growth (top), whereas the ones in Matrigel drops rapidly lose viability and disintegrate (bottom). Scale bars, 100 μm. d,e, Quantification of organoid viability (n = 6; ***P < 0.0001) (d) and size (n = 5; *P = 0.0115, ***P < 0.0001) (e). f, Continuous enlargement of intestinal organoids in OCTOPUS over 21 d. Scale bars, 100 μm. g, OCTOPUS reduces variability in the size of organoids as evidenced by the substantially smaller coefficient of variation (CV). Scale bars, 100 μm. h, Bud formation is used as a metric for analyzing morphological development of intestinal organoids in 3D culture. i,j, Confocal micrographs of organoids in Matrigel drop (i) and OCTOPUS (j). Organoid budding is more pronounced in OCTOPUS. Scale bars, 100 μm. k, Quantification of bud number (n = 3) and length (n = 4). l, Confocal micrographs showing the spatial distribution of EdU+ cells (white) in OCTOPUS-generated organoids. The yellow lines in the close-up images outline organoid buds. Scale bars, 100 μm. m, Visualization and quantification of differentiation markers specific to enterocytes (villin, top), goblet cells (MUC2, middle) and enteroendocrine cells (somatostatin, bottom). Scale bars, 10 μm (n = 3). n, Imaging and quantification of intracellular calcium signaling in intestinal organoids treated with 50 mM glucose. Organoids in Matrigel drops at the maximum duration of culture (7 d) were compared with those maintained in OCTOPUS for 14 d to examine the contribution of extended culture. The time between stimulation and maximum fluorescence intensity is shaded in pink. Scale bars, 100 μm. All data are presented as mean ± s.e.m. and P values are from unpaired, two-sided t-test. a.u., arbitrary units; BF, bright field; D, day.
Fig. 3 ∣
Fig. 3 ∣. Prolonged culture of human intestinal organoids in OCTOPUS.
a, Human enteroids derived from human adult intestinal stem cells cultured in OCTOPUS and Matrigel drop for 5 d. Scale bars, 100 μm. b,c, Micrographs of enteroids at 10 d (b) and 14 d (c) show enteroids in OCTOPUS become larger and develop crypt/villus-like structures during 14-d culture (top), which is in contrast to arrested growth and decreased viability in Matrigel drop culture (bottom). Scale bars, 100 μm. d, Quantification of organoid size (n = 5; ***P < 0.0001) and viability (n = 5; ***P < 0.0001). e, Representative images of H&E-stained enteroid sections in OCTOPUS and Matrigel drop at days 7 (top) and 14 (bottom). Scale bars, 20 μm. f, Quantification of bud number (n = 5; ***P < 0.0001) and length (n = 5; ***P < 0.0001). g, Growth of human enteroids in OCTOPUS over 21 d. Scale bars, 50 μm. hi, Immunofluorescence (h) and mRNA analysis (i) of Ki67+ proliferative cells in the crypt domain at days 7 and 14. Scale bars, 10 μm (n = 6). j, k, Immunofluorescence (j) and mRNA analysis (k) of differentiated KRT20+ absorptive enterocytes on the villus surface at days 7 and 14. Scale bars, 10 μm (n = 6). l, m, Immunofluorescence (l) and mRNA analysis (m) of differentiated MUC2+ goblet cells at days 7 and 14. Scale bars, 10 μm (n = 6). n, ELISA analysis of IGF-1 and FGF-2 in conditioned media collected from human enteroid culture in OCTOPUS and Matrigel drops (n = 3). All data are presented as mean ± s.e.m. and P values are from unpaired, two-sided t-test.
Fig. 4 ∣
Fig. 4 ∣. scRNA-seq of human enteroids in OCTOPUS.
a, UMAP projection of 12 clusters representing distinct stem and intestinal epithelial cell populations in human enteroids produced by 7 d of culture in OCTOPUS. b, UMAP plots showing the expression of representative canonical genes specific to absorptive enterocytes, goblet cells and stem cells in log2 expression values. c,d, UMAP projection of cell clusters in human enteroids after 7-d culture in Matrigel drop (c) and 14 d of uninterrupted culture in OCTOPUS (d). e, Quantification of cellular compositions in human enteroids. Where available, the percentage of each cell type in the native human intestine was obtained from published in vivo atlases and shown with a dashed line. f, Violin plots comparing the expression of select cell-type-specific maturation markers between Matrigel drop culture and OCTOPUS. Violin plot elements showing unique molecular identifier (UMI) counts per cell represent the following values: center line, median; box limits, upper and lower quartiles; whiskers, 1.5-fold the interquartile range (n = 9,477 cells for Drop D7, 8,596 cells for OCTOPUS D7 and 1,1031 cells for OCTOPUS D14 examined over 3 independent experiments). g, Pseudotime trajectories (top) and branching plot (bottom) of intestinal stem cell differentiation into secretory and absorptive cell populations in human enteroids cultured in OCTOPUS for 14 d. h, Comparison of the fractions of differentiated epithelial cell types in OCTOPUS and Matrigel drop culture. All data are presented as mean ± s.e.m. and P values are from unpaired, two-sided t-test. exp, expression; M, microfold; TA, transit-amplifying.
Fig. 5 ∣
Fig. 5 ∣. Organoid-based model of human IBD in OCTOPUS.
a, Adult stem cells isolated from the intestine of patients with Crohn’s disease are used to form enteroids in OCTOPUS. b, Morphology of IBD and normal enteroids in OCTOPUS after 14-d culture visualized by immunofluorescence. Scale bars, 100 μm. c, Quantification of enteroid size and the number of buds at days 7 and 14 (n = 5). d, Histological sections of the intestinal epithelium after 14 d of culture. Scale bars, 5 μm. e,f, Immunofluorescence (e) and quantification (f) of cell proliferation (Ki67) (n = 6) and apoptosis (caspase-3 and annexin V) (n = 3) in IBD and normal enteroids. Scale bars, 10 μm. g, Confocal micrographs and quantification of ZO-1 expression in the villus domain of enteroids. Scale bars, 10 μm (n = 3). h, Visualization of 4-kDa dextran-FITC diffusion into the organoid lumen (L) to show epithelial permeability in the IBD enteroids. Scale bars, 50 μm. i,j, UMAP projection of distinct cell populations (i) and quantification of their proportions (j) in IBD and normal enteroids. k, Comparison of IBD-associated genes in log2 expression values. l, Heatmap showing the mean expression of transcription factors in IBD enteroids relative to that in normal enteroids. Upregulation of lncRNA genes in the IBD enteroids occurs mostly in Paneth cells shown with dashed lines in the UMAP plots. m, Coculture of human enteroids and primary human intestinal fibroblasts in OCTOPUS. n, Confocal micrograph of the coculture construct at day 14. Scale bar, 100 μm. o, Immunofluorescence micrographs of localized regions surrounding the enteroids after 14 d of culture. Scale bars, 25 μm. p, Quantification of FN production (n = 3). q, Quantification of cytokines (n = 3). All data are presented as mean ± s.e.m. and P values are from unpaired, two-sided t-test. ZO-1, Zonula occludens-1.
Fig. 6 ∣
Fig. 6 ∣. Microengineering of vascularized human enteroids in OCTOPUS-EVO.
a, Photo of OCTOPUS-EVO devices in a standard 12-well cell culture plate. b, Device architecture of OCTOPUS-EVO. The device consists of an open cell culture chamber with cross-sectional dimensions of 3 mm (width) × 1 mm (thickness) flanked by two flow-through microchannels (1 × 1 mm2) on either side of the chamber. c,d, Sequential steps of microfluidic 3D culture (c) necessary for generating self-assembled and perfusable blood vessels (d) while supporting self-organization of stem cells into organoids in the same hydrogel scaffold. e, Micrographs demonstrating the concurrent development of human enteroids and microvasculature over the course of 12-d culture. Scale bars, 200 μm. f, Perfusability of the microengineered vascular network visualized by the flow of 1-μm fluorescent beads. Scale bars, 100 μm. g, Comparison of organoid size between vascularized and nonvascularized constructs (n = 5). h, Construction of vascularized, perfusable human IBD enteroids in OCTOPUS-EVO. Scale bars, 100 μm. i, Quantification of vascular density and vessel diameter (n = 5). j,k, Pro-inflammatory phenotype of the vascularized IBD model demonstrated by endothelial expression of ICAM-1 (j) and increased production of inflammatory mediators (k). Scale bars, 50 μm (n = 3). l, Micrograph of IBD enteroids perfused with peripheral blood monocytes. Scale bar, 200 μm. m,n, Confocal microscopy (m) and quantification (n) of sequential steps of monocyte recruitment to IBD enteroids. Scale bars, 50 μm (n = 5). All data are presented as mean ± s.e.m. and P values are from unpaired, two-sided t-test.

Comment in

Similar articles

Cited by

References

    1. Clevers H Modeling development and disease with organoids. Cell 165, 1586–1597 (2016). - PubMed
    1. Lancaster MA & Knoblich JA Organogenesis in a dish: modeling development and disease using organoid technologies. Science 345, 1247125 (2014). - PubMed
    1. Dutta D, Heo I & Clevers H Disease modeling in stem cell-derived 3D organoid systems. Trends Mol. Med 23, 393–410 (2017). - PubMed
    1. Broutier L et al. Culture and establishment of self-renewing human and mouse adult liver and pancreas 3D organoids and their genetic manipulation. Nat. Protoc 11, 1724–1743 (2016). - PubMed
    1. Shin W et al. Spatiotemporal gradient and instability of Wnt induce heterogeneous growth and differentiation of human intestinal organoids. iScience 21, 101372 (2020). - PMC - PubMed

Publication types