. 2022 Nov;54(11):1609-1614.
doi: 10.1038/s41588-022-01200-1. Epub 2022 Oct 24.

A combined polygenic score of 21,293 rare and 22 common variants improves diabetes diagnosis based on hemoglobin A1C levels

Affiliations

A combined polygenic score of 21,293 rare and 22 common variants improves diabetes diagnosis based on hemoglobin A1C levels

Peter Dornbos et al. Nat Genet. 2022 Nov.

Abstract

Polygenic scores (PGSs) combine the effects of common genetic variants1,2 to predict risk or treatment strategies for complex diseases3-7. Adding rare variation to PGSs has largely unknown benefits and is methodically challenging. Here, we developed a method for constructing rare variant PGSs and applied it to calculate genetically modified hemoglobin A1C thresholds for type 2 diabetes (T2D) diagnosis7-10. The resultant rare variant PGS is highly polygenic (21,293 variants across 154 genes), depends on ultra-rare variants (72.7% observed in fewer than three people) and identifies significantly more undiagnosed T2D cases than expected by chance (odds ratio = 2.71; P = 1.51 × 10⁻⁶). A PGS combining common and rare variants is expected to identify 4.9 million misdiagnosed T2D cases in the United States-nearly 1.5-fold more than the common variant PGS alone. These results provide a method for constructing complex trait PGSs from rare variants and suggest that rare variants will augment common variants in precision medicine approaches for common disease.


Figures

Extended Data Figure 1 |
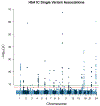
Extended Data Figure 1 |. Single variant HbA1C associations.
Manhattan plot of the single variant associations identified by our meta-analysis. Horizontal lines indicate the threshold used for exome-wide significance for coding variants (red: p≤1.8×10⁻⁸ as derived from a previous determined threshold p≤4.3×10⁻⁷ and Bonferroni correction for 24 phenotypes) and genome-wide significance for non-coding variants (green: p≤2.1×10⁻⁹ as derived from the traditional genome-wide significance threshold p≤5×10⁻⁸ and Bonferroni correction for 24 phenotypes). Single variant associations were determined via the efficient mixed-model association expedited (EMMAX) method
Extended Data Figure 2 |
Extended Data Figure 2 |. Effect sizes and proportion of variance explained for rare variant HbA1C gene-level associations.
Results are displayed for a, G6PD (N=1,382 for AA; N=1,930 for EA; N=41,689 for EU; N=1,861 for SA; N=892 for HS), b, GCK (N=551 for EA; N=40,241 for EU; N=487 for HS), and (c) PIEZO1 (N=905 for AA; N=1,340 for EA; N=42,061 for EU; N=789 for SA; N=484 for HS). We calculated effect sizes (mmol/mol) and liability variance explained separately for each ancestry and then combined these via a meta-analysis. We performed the calculations for the strongest associated gene-level mask and for the strongest associated common variant within 125kb of the gene as previously reported (N=7,564 for AA; N=20,838 for EA; N=123,665 for EU; N=8,874 for SA). Proportion of variance explained is displayed as the proportion of total liability variance. Abbreviations: AA, African-American; EA, East Asian; EU, European; HS, Hispanic; SA, South Asian; M-A, meta-analysis. Error bars indicate 95% confidence intervals.
Extended Data Figure 3 |
Extended Data Figure 3 |. Calculating and evaluating common variant polygenic scores.
We calculated common polygenic scores based on effect sizes and results from a previously published multi-ethnic HbA1C GWAS. We calculated polygenic scores separately for each of the four ancestries in our test sample with available GWAS data, evaluated ancestry-specific odds ratios via a Fisher’s exact tests, and then combined these odds ratios via a fixed-effects meta-analysis to produce a transethnic odds ratio.
Extended Data Figure 4 |
Extended Data Figure 4 |. Enrichment analyses of HbA1C and RBC rare variant gene-level associations.
We ranked genes by their HbA1C gene-level p-value and tested the degree to which the top n associations (with n ranging from 1 to 1,000) were enriched for red blood cell count (RBC) gene-level associations. Enrichments were calculated using a one-sided Wilcoxon rank-sum test, comparing the RBC gene-level p-values of the top n HbA1C associations to the RBC gene-level p-values of background genes matched on the number of variants and total allele count; the solid blue line in the plot shows the one-sided Wilcoxon p-values as a function of n. As a negative control, we also conducted the reciprocal analysis in which we tested the top i RBC associations for enrichment for HbA1C associations; the solid yellow shows the one-sided Wilcoxon p-values.
Extended Data Figure 5 |
Extended Data Figure 5 |. A framework for constructing polygenic scores that include rare variants.
The framework consists of two steps: a, choosing genes to include in the polygenic score, based on their association p-value and annotation, and b, defining weights for rare variants, based on the masks that include them and the aggregate effect sizes observed for the masks. a, We explored three methods for choosing genes, based on their strength of HbA1C association (blue boxes) and evidence of acting through erythrocytic pathways (red). “GLYCEMIC set” indicates genes located within a glycemic gene set enriched (at p≤0.05) for HbA1C rare variant associations, while “RBC set” indicates genes located within an erythrocytic gene set enriched (at p≤0.05) for HbA1C rare variant associations (the specific gene sets are shown in Figure 2). “HbA1C LOCUS” and “RBC LOCUS” indicates genes located within 125kb of a common variant HbA1C or RBC association, respectively. The two negative controls included only genes that failed the erythrocytic pathway filters (“Excluded”) and applied either the HbA1C association strength filters for the loose gene set (control 1) or the association strength filters for the relaxed gene set (control 2). b, We explored three methods for weighting variants (Methods): the aggregate effect size of the strictest mask that contained the variant (nested), the aggregate effect size of variants unique to the strictest mask that contained the variant (unique), or the aggregate effect size of a weighted burden test for the gene multiplied by the specific weight of the variant (weighted).
Extended Data Figure 6 |
Extended Data Figure 6 |. Testing the accuracy of the rare variant polygenic score.
As described in Figure 3 and Methods, for each of the nine rare variant polygenic scores (three variant weighting schemes for each of three gene set definitions; Extended Data Figure 5), we calculated Fisher’s odds ratios and 95% confidence intervals for the fraction of true T2D cases reclassified by the model as compared to the null expectation. The area of the diamond for each odds ratio is proportional to the total number of reclassified individuals in the AMP-T2D-GENES test sample (total N assessed=17,206; see Supplementary Table 9 for model-specific reclassification sample sizes). Error bars indicate 95% confidence intervals of the odds ratios.
Extended Data Figure 7 |
Extended Data Figure 7 |. Secondary analysis of rare variant polygenic scores for UKB samples only.
To ensure that the ability of the rare variant polygenic score to reclassify an excess of true cases was not due to over-fitting, we built nine risk scores as in Extended Data Figure 6 but with genes selected from an analysis of only UKB samples (Methods). For each of the nine resulting rare variant polygenic scores, we calculated Fisher’s odds ratios and 95% confidence intervals for the fraction of true T2D cases reclassified by the model as compared to the null expectation. The area of the diamond for each odds ratio is proportional to the total number of reclassified individuals in the AMP-T2D-GENES test sample (total N assessed=17,206; see Supplementary Table 9 for model-specific reclassification sample sizes). Error bars indicate 95% confidence intervals of the odds ratios.
Extended Data Figure 8 |
Extended Data Figure 8 |. Impact of adjusting rare variant effects for common variants included in the polygenic score.
Scatterplots indicate HbA1C gene-level effect sizes (mmol/mol) as estimated by burden tests with and without variants from the common variant PGS included as covariates in the test. a-g, Results are shown for each of the seven rare variant masks. We analyzed genes with nominal (p≤0.05) rare variant associations and within 125kb of a variant in the common variant PGS. Results indicate that, on average, rare variant effects remain roughly the same when adjusting for common variants. Spearman’s rank correlation coefficients (i.e. rho) and associated two-sided p-values are indicated on plots, as are the slopes (i.e. beta) and two-sided p-values from linear regression. Blue dotted lines show the linear regression slopes; red lines indicate a slope of 1.
Extended Data Figure 9 |
Extended Data Figure 9 |. Testing for heterogeneity across ancestry for variants included in common variant and rare variant polygenic scores.
We used a Cochran’s Q test to evaluate heterogeneity across ancestry-level single-variant and gene-level association results. QQ plots are shown for p-values from a, single-variant Q tests for common variants and b-h, gene-level Q tests for different rare variant masks; included in each analysis were the variants (or genes) included in the corresponding polygenic score. Departures above the diagonal red line suggest heterogeneity beyond the null expectation (blue lines indicate 90% confidence intervals for the null expectation), while lambda values indicate the ratio of the median observed chi square statistic to the median of the expected chi square statistic under the null; larger lambda values indicate larger deviations from the null.
Extended Data Figure 10 |
Extended Data Figure 10 |. Fraction of variants found in enriched erythrocytic glycemic gene sets with negative effects on HbA1C levels.
Reported is the fraction of variants with negative HbA1C effect sizes (based on the single variant meta-analysis) within genes (i) with HbA1C gene-level p≤0.05 and (ii) within a significantly enriched (p≤0.05) erythrocytic (N=4) or glycemic (N=5) gene set. a-g, Results are shown for variants within each mask. The bars represent the fractions observed for variants across all gene sets, while the dots represent the fractions observed for variants within each individual gene set. A two-sided t-test was used to assess potentially significant differences; p-values are shown above each plot. Error bars indicate standard error.
Figure 1 |
Figure 1 |. Rare variant associations for HbA1C are comparatively strong.
a, The number of exome-wide significant predicted high or moderate impact variant associations across 24 quantitative phenotypes. Single variant associations were determined using the efficient mixed-model association expedited (EMMAX) method, and gene-level associations were determined using burden testing. Yellow: P ≤ 1.8 × 10⁻⁸ (as derived from a previously determined threshold of P ≤ 4.3 × 10⁻⁷ and Bonferroni correction for 24 phenotypes) and exome-wide significant gene-level associations. Blue: P ≤ 1.0 × 10⁻⁷ (as derived from the traditional exome-wide significance threshold of P ≤ 2.5 × 10⁻⁶ and Bonferroni correction for 24 phenotypes). b, Manhattan plot of all gene-level HbA1C associations determined via burden testing. Those reaching exome-wide significance (P ≤ 1.0 × 10⁻⁷; red line) are labeled. c,d, Effect sizes (mmol/mol) for rare variant gene-level associations for G6PD (c) (n = 1,382 for AA; n = 1,930 for EA; n = 41,689 for EU; n = 1,861 for SA; n = 892 for HS) and PIEZO1 (d) (n = 905 for AA; n = 1,340 for EA; n = 42,061 for EU; n = 789 for SA; n = 484 for HS). Previously reported nearby common variant associations (n = 7,564 for AA; n = 20,838 for EA; n = 123,665 for EU; n = 8,874 for SA) are shown for comparison. Gene-level effects are displayed from the strongest associated variant mask. AA, African-American; EA, East Asian; EU, European; HS, Hispanic; SA, South Asian; M-A, meta-analysis. Error bars indicate 95% confidence intervals.
Figure 2 |
Figure 2 |. Rare variant gene-level HbA1C associations show enrichment for genes involved in glycemic control and erythrocytic pathways in mice.
a, Boxplots displaying the percentile of gene-level P-values (relative to matched genes; grey) for genes thought to impact erythrocyte pathways (blue) and glycemic control (green) in mice. The horizontal dotted line at the 50th percentile indicates the expected median percentile under the null distribution. We used a one-sided Wilcoxon rank sum test to assess significant deviation of percentiles from matched genes; Wilcoxon P-values are displayed for each gene set. The numbers of genes in each gene set are indicated in the Supplementary Note. b, The fraction of genes with a negative effect on HbA1C levels among those (i) with HbA1C gene-level P ≤ 0.05 and (ii) within a significantly enriched (P ≤ 0.05) erythrocytic (n = 4) or glycemic (n = 5) gene set. The bars represent the fractions of genes observed across all gene sets, while the dots represent the fractions of genes observed for each individual gene set. We used a binomial test to assess deviation from the expected fraction of 50%. In a, the box plot indicates minimum, lower quartile, median, upper quartile, and maximum. In b, the error bars indicate standard error.
Figure 3 |
Figure 3 |. Accuracy and properties of rare and common variant polygenic scores.
We identified “reclassified” individuals with adjusted (but not unadjusted) HbA1C above the T2D diagnostic threshold (47.53 mmol/mol) and compared (via a two-tailed Fisher’s exact test) the fraction of “true” cases among such individuals to the number expected by chance (Methods). a, From top, the forest plot shows Fisher’s exact test odds ratios and 95% confidence intervals for polygenic scores constructed from two exome-wide significant rare variant gene-level associations (PIEZO1/G6PD), the best performing (“loose, nested”) rare variant polygenic score (Erythrocytic Genes), a negative control polygenic score that excludes known erythrocytic genes (Glycemic Genes), a previously published common variant polygenic score (Common Erythrocytic Variants), and a polygenic score that combines rare and common variants (Combined Erythrocytic PGS). The area of each diamond is proportional to the number of individuals in our test sample reclassified by the score. b, Fisher’s exact test odds ratios stratified by ancestry. The area of each diamond is now proportional to the number of individuals in the US population that would be reclassified by the score after scaling the ancestral proportions in our test sample to those estimated for the US (Methods). Due to inadequate data regarding East Asian and South Asian percentages of the US population, “Asian” represents a meta-analysis of the South Asian and East Asian results; Supplementary Table 10 shows PGS performance within each ancestry. Europeans are not displayed due to insufficient data in our test sample. c-f, Histograms display the distribution (in mmol/mol HbA1C) of rare variant (gray) and common variant (colored) polygenic scores for each ancestry.

Similar articles

  • Impact of common genetic determinants of Hemoglobin A1c on type 2 diabetes risk and diagnosis in ancestrally diverse populations: A transethnic genome-wide meta-analysis.
    Wheeler E, Leong A, Liu CT, Hivert MF, Strawbridge RJ, Podmore C, Li M, Yao J, Sim X, Hong J, Chu AY, Zhang W, Wang X, Chen P, Maruthur NM, Porneala BC, Sharp SJ, Jia Y, Kabagambe EK, Chang LC, Chen WM, Elks CE, Evans DS, Fan Q, Giulianini F, Go MJ, Hottenga JJ, Hu Y, Jackson AU, Kanoni S, Kim YJ, Kleber ME, Ladenvall C, Lecoeur C, Lim SH, Lu Y, Mahajan A, Marzi C, Nalls MA, Navarro P, Nolte IM, Rose LM, Rybin DV, Sanna S, Shi Y, Stram DO, Takeuchi F, Tan SP, van der Most PJ, Van Vliet-Ostaptchouk JV, Wong A, Yengo L, Zhao W, Goel A, Martinez Larrad MT, Radke D, Salo P, Tanaka T, van Iperen EPA, Abecasis G, Afaq S, Alizadeh BZ, Bertoni AG, Bonnefond A, Böttcher Y, Bottinger EP, Campbell H, Carlson OD, Chen CH, Cho YS, Garvey WT, Gieger C, Goodarzi MO, Grallert H, Hamsten A, Hartman CA, Herder C, Hsiung CA, Huang J, Igase M, Isono M, Katsuya T, Khor CC, Kiess W, Kohara K, Kovacs P, Lee J, Lee WJ, Lehne B, Li H, Liu J, Lobbens S, Luan J, Lyssenko V, Meitinger T, Miki T, Miljkovic I, Moon S, Mulas A, Müller G, Müller-Nurasyid M, Nagaraja R, Nauck M, Pankow JS, Polasek O, Prokopenko I, Ramos PS, Rasmussen-Torvik L, Rathmann W, Rich SS, Robertson NR, Roden M, Roussel R, Rudan I, Scott … See abstract for full author list ➔ Wheeler E, et al. PLoS Med. 2017 Sep 12;14(9):e1002383. doi: 10.1371/journal.pmed.1002383. eCollection 2017 Sep. PLoS Med. 2017. PMID: 28898252 Free PMC article.
  • Polygenic subtype identified in ACCORD trial displays a favorable type 2 diabetes phenotype in the UKBiobank population.
    Hershberger C, Mariam A, Pantalone KM, Buse JB, Motsinger-Reif AA, Rotroff DM. Hershberger C, et al. Hum Genomics. 2024 Jun 22;18(1):70. doi: 10.1186/s40246-024-00639-z. Hum Genomics. 2024. PMID: 38909264 Free PMC article.
  • Addressing the challenges of polygenic scores in human genetic research.
    Novembre J, Stein C, Asgari S, Gonzaga-Jauregui C, Landstrom A, Lemke A, Li J, Mighton C, Taylor M, Tishkoff S. Novembre J, et al. Am J Hum Genet. 2022 Dec 1;109(12):2095-2100. doi: 10.1016/j.ajhg.2022.10.012. Am J Hum Genet. 2022. PMID: 36459976 Free PMC article. Review.
  • Complex trait associations in rare diseases and impacts on Mendelian variant interpretation.
    Smail C, Ge B, Keever-Keigher MR, Schwendinger-Schreck C, Cheung WA, Johnston JJ, Barrett C; Genomic Answers for Kids Consortium; Feldman K, Cohen ASA, Farrow EG, Thiffault I, Grundberg E, Pastinen T. Smail C, et al. Nat Commun. 2024 Sep 18;15(1):8196. doi: 10.1038/s41467-024-52407-1. Nat Commun. 2024. PMID: 39294130 Free PMC article.
  • Impact of Genetic Determinants of HbA1c on Type 2 Diabetes Risk and Diagnosis.
    Sarnowski C, Hivert MF. Sarnowski C, et al. Curr Diab Rep. 2018 Jun 21;18(8):52. doi: 10.1007/s11892-018-1022-4. Curr Diab Rep. 2018. PMID: 29931457 Review.

Cited by

References

    1. Vilhjálmsson BJ et al. Modeling linkage disequilibrium increases accuracy of polygenic risk scores. Am. J. Hum. Genet 97, 576–592 (2015). - PMC - PubMed
    1. Choi SW, Mak TS & O’Reilly PF Tutorial: a guide to performing polygenic risk score analyses. Nat. Protoc 15, 2759–2772 (2020). - PMC - PubMed
    1. Khera AV et al. Genome-wide polygenic scores for common diseases identify individuals with risk equivalent to monogenic mutations. Nat. Genet 50, 1219–1224 (2018). - PMC - PubMed
    1. Khera AV et al. Polygenic prediction of weight and obesity trajectories from birth to adulthood. Cell 177, 587–596.e9 (2019). - PMC - PubMed
    1. Mavaddat N et al. Polygenic risk scores for prediction of breast cancer and breast cancer subtypes. Am. J. Hum. Genet 104, 21–34 (2019). - PMC - PubMed

Methods-only references

    1. Kang HM et al. Variance component model to account for sample structure in genome-wide association studies. Nat. Genet 42, 348–354 (2010). - PMC - PubMed
    1. Lohmueller KE et al. Whole-exome sequencing of 2,000 Danish individuals and the role of rare coding variants in type 2 diabetes. Am. J. Hum. Genet 93, 1072–1086 (2013). - PMC - PubMed
    1. Williams AL et al. Sequence variants in SLC16A11 are a common risk factor for type 2 diabetes in Mexico. Nature 506, 97–101 (2014). - PMC - PubMed
    1. Eastwood SV et al. Algorithms for the capture and adjudication of prevalent and incident diabetes in UK Biobank. PLoS One 11, e0162388 (2016). - PMC - PubMed
    1. Hindy G et al. Rare coding variants in 35 genes associate with circulating lipid levels – a multi-ancestry analysis of 170,000 exomes. Am. J. Hum. Genet 109, 81–96 (2020). - PMC - PubMed

Publication types

MeSH terms

Substances