

Tomographic detection of photon pairs produced from high-energy X-rays for the monitoring of radiotherapy dosing
- PMID: 36280738
- PMCID: PMC10038801
- DOI: 10.1038/s41551-022-00953-8
Tomographic detection of photon pairs produced from high-energy X-rays for the monitoring of radiotherapy dosing
Abstract
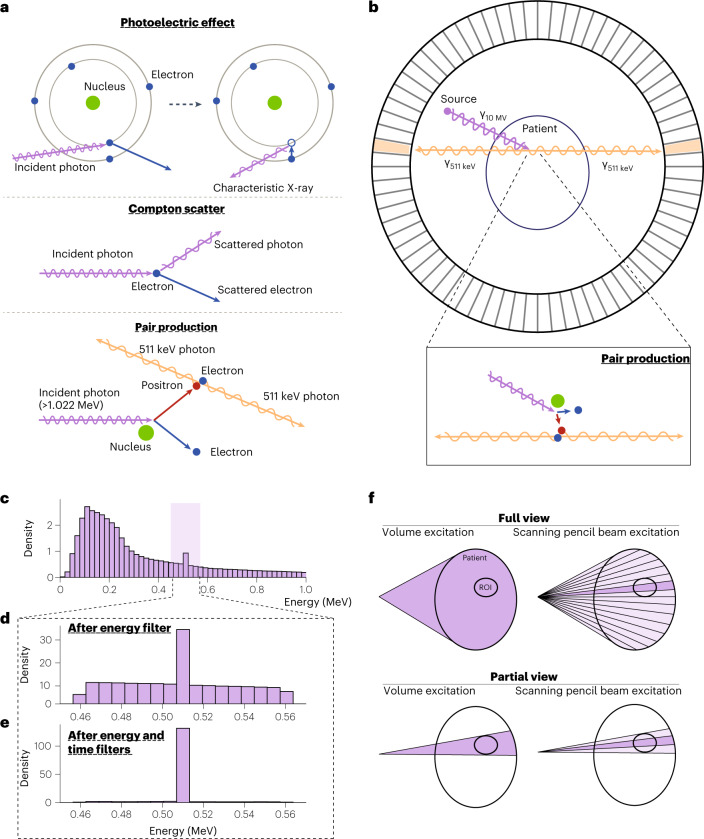
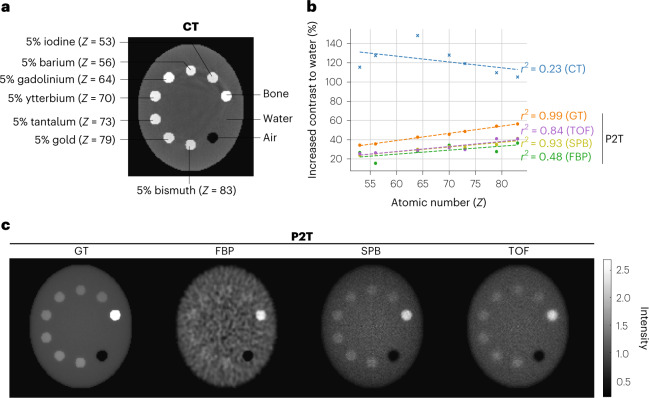
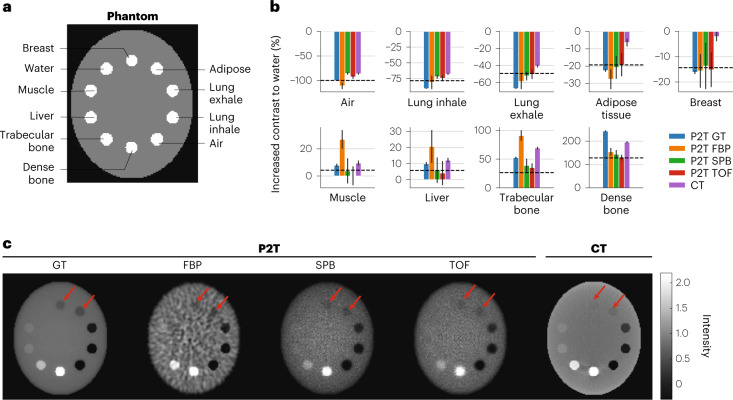
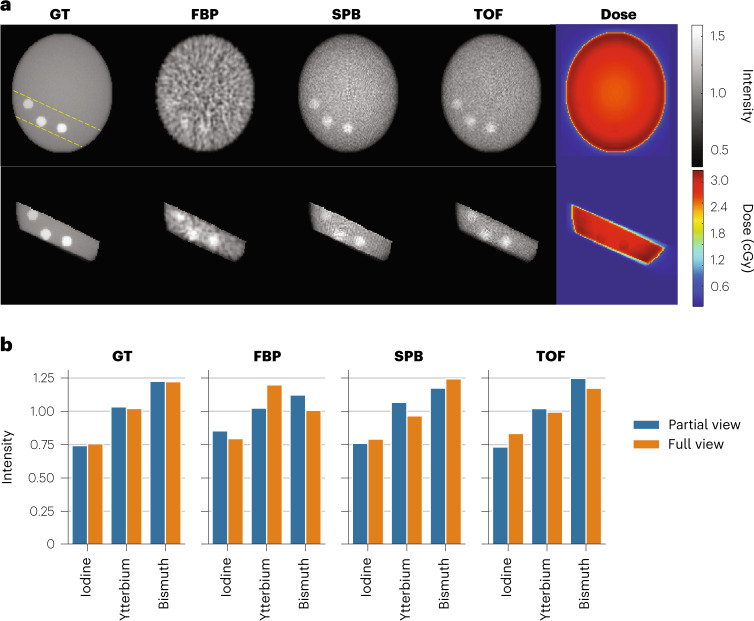
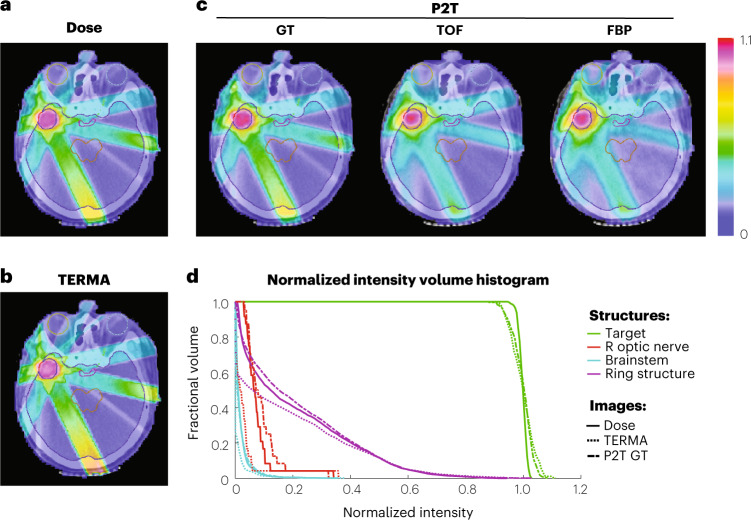
Measuring the radiation dose reaching a patient's body is difficult. Here we report a technique for the tomographic reconstruction of the location of photon pairs originating from the annihilation of positron-electron pairs produced by high-energy X-rays travelling through tissue. We used Monte Carlo simulations on pre-recorded data from tissue-mimicking phantoms and from a patient with a brain tumour to show the feasibility of this imaging modality, which we named 'pair-production tomography', for the monitoring of radiotherapy dosing. We simulated three image-reconstruction methods, one applicable to a pencil X-ray beam scanning through a region of interest, and two applicable to the excitation of tissue volumes via broad beams (with temporal resolution sufficient to identify coincident photon pairs via filtered back projection, or with higher temporal resolution sufficient for the estimation of a photon's time-of-flight). In addition to the monitoring of radiotherapy dosing, we show that image contrast resulting from pair-production tomography is highly proportional to the material's atomic number. The technique may thus also allow for element mapping and for soft-tissue differentiation.
© 2022. The Author(s).
Conflict of interest statement
The authors declare no competing interests.
Figures
Similar articles
-
Gold nanoparticle detection and quantification in therapeutic MV beams via pair production.Phys Med Biol. 2021 Mar 9;66(6):064004. doi: 10.1088/1361-6560/abd954. Phys Med Biol. 2021. PMID: 33412535
-
Design of a fast multileaf collimator for radiobiological optimized IMRT with scanned beams of photons, electrons, and light ions.Med Phys. 2007 Mar;34(3):877-88. doi: 10.1118/1.2431082. Med Phys. 2007. PMID: 17441233
-
Secondary radiation dose modeling in passive scattering and pencil beam scanning very high energy electron (VHEE) radiation therapy.Med Phys. 2023 Jul;50(7):4491-4504. doi: 10.1002/mp.16443. Epub 2023 May 25. Med Phys. 2023. PMID: 37227704
-
Characteristics of kilovoltage x-ray beams used for cone-beam computed tomography in radiation therapy.Phys Med Biol. 2007 Mar 21;52(6):1595-615. doi: 10.1088/0031-9155/52/6/004. Epub 2007 Feb 27. Phys Med Biol. 2007. PMID: 17327651
-
High-density dental implants and radiotherapy planning: evaluation of effects on dose distribution using pencil beam convolution algorithm and Monte Carlo method.J Appl Clin Med Phys. 2015 Sep 8;16(5):46–52. doi: 10.1120/jacmp.v16i5.5612. J Appl Clin Med Phys. 2015. PMID: 26699323 Free PMC article. Review.
Cited by
-
Real-time tracking of the Bragg peak during proton therapy via 3D protoacoustic Imaging in a clinical scenario.Npj Imaging. 2024;2(1):34. doi: 10.1038/s44303-024-00039-x. Epub 2024 Sep 17. Npj Imaging. 2024. PMID: 40078731 Free PMC article.
-
Lead-Free Halide Perovskites for Direct X-Ray Detectors.Adv Sci (Weinh). 2023 Aug;10(23):e2300256. doi: 10.1002/advs.202300256. Epub 2023 May 26. Adv Sci (Weinh). 2023. PMID: 37232232 Free PMC article. Review.
-
An interface tool to parametrize treatment plans for the TrueBeam radiotherapy system into TOPAS parameter control files for Monte Carlo simulation.Phys Med. 2024 Aug;124:104485. doi: 10.1016/j.ejmp.2024.104485. Epub 2024 Jul 25. Phys Med. 2024. PMID: 39059251 Free PMC article.
References
-
- Haff RP, Toyofuku N. X-ray detection of defects and contaminants in the food industry. Sens. Instrum. Food Qual. Saf. 2008;2:262–273. doi: 10.1007/s11694-008-9059-8. - DOI
-
- Hawkes, R., Holland, G., Moore, W. S. & Worthington, B. Nuclear magnetic resonance (NMR) tomography of the brain: a preliminary clinical assessment with demonstration of pathology. J. Comput. Assist. Tomogr. 10.1097/00004728-198010000-00001 (1980). - PubMed
