

Mouse tissue glycome atlas 2022 highlights inter-organ variation in major N-glycan profiles
- PMID: 36280747
- PMCID: PMC9592591
- DOI: 10.1038/s41598-022-21758-4
Mouse tissue glycome atlas 2022 highlights inter-organ variation in major N-glycan profiles
Abstract
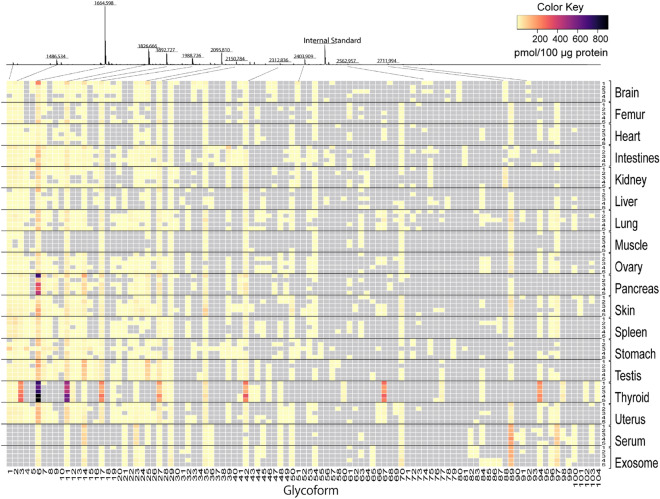
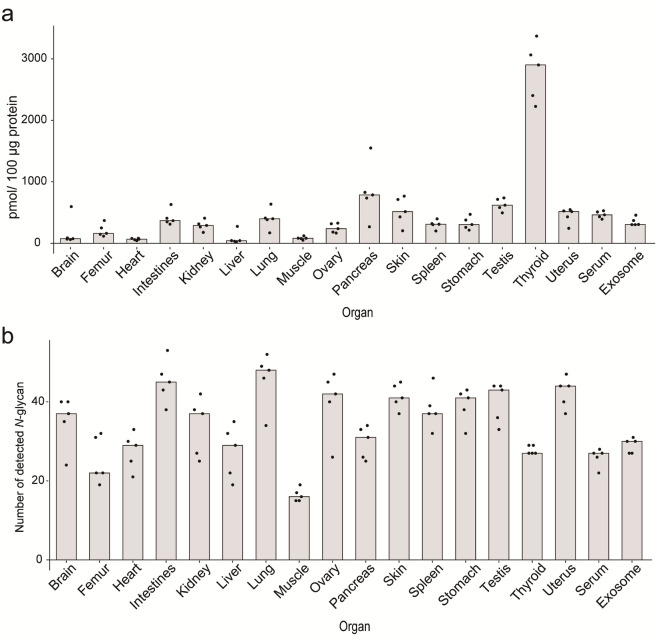
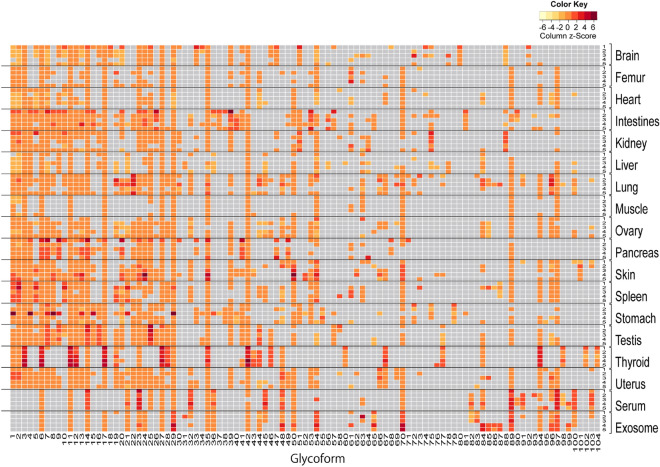
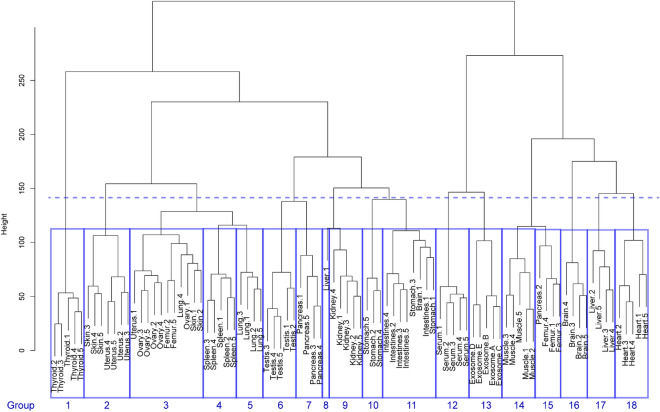
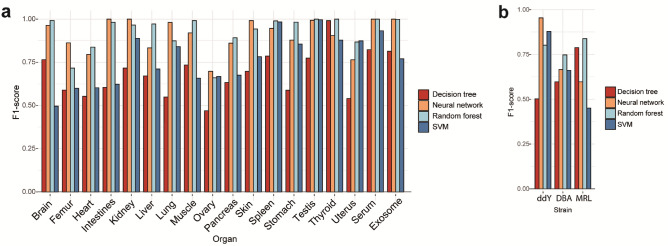
This study presents "mouse tissue glycome atlas" representing the profiles of major N-glycans of mouse glycoproteins that may define their essential functions in the surface glycocalyx of mouse organs/tissues and serum-derived extracellular vesicles (exosomes). Cell surface glycocalyx composed of a variety of N-glycans attached covalently to the membrane proteins, notably characteristic "N-glycosylation patterns" of the glycocalyx, plays a critical role for the regulation of cell differentiation, cell adhesion, homeostatic immune response, and biodistribution of secreted exosomes. Given that the integrity of cell surface glycocalyx correlates significantly with maintenance of the cellular morphology and homeostatic immune functions, dynamic alterations of N-glycosylation patterns in the normal glycocalyx caused by cellular abnormalities may serve as highly sensitive and promising biomarkers. Although it is believed that inter-organs variations in N-glycosylation patterns exist, information of the glycan diversity in mouse organs/tissues remains to be elusive. Here we communicate for the first-time N-glycosylation patterns of 16 mouse organs/tissues, serum, and serum-derived exosomes of Slc:ddY mice using an established solid-phase glycoblotting platform for the rapid, easy, and high throughput MALDI-TOFMS-based quantitative glycomics. The present results elicited occurrence of the organ/tissue-characteristic N-glycosylation patterns that can be discriminated to each other. Basic machine learning analysis using this N-glycome dataset enabled classification between 16 mouse organs/tissues with the highest F1 score (69.7-100%) when neural network algorithm was used. A preliminary examination demonstrated that machine learning analysis of mouse lung N-glycome dataset by random forest algorithm allows for the discrimination of lungs among the different mouse strains such as the outbred mouse Slc:ddY, inbred mouse DBA/2Crslc, and systemic lupus erythematosus model mouse MRL-lpr/lpr with the highest F1 score (74.5-83.8%). Our results strongly implicate importance of "human organ/tissue glycome atlas" for understanding the crucial and diversified roles of glycocalyx determined by the organ/tissue-characteristic N-glycosylation patterns and the discovery research for N-glycome-based disease-specific biomarkers and therapeutic targets.
© 2022. The Author(s).
Conflict of interest statement
The authors declare no competing interests.
Figures


Similar articles
-
Non-targeted N-glycome profiling reveals multiple layers of organ-specific diversity in mice.Nat Commun. 2024 Nov 9;15(1):9725. doi: 10.1038/s41467-024-54134-z. Nat Commun. 2024. PMID: 39521793 Free PMC article.
-
Region-Specific Cell Membrane N-Glycome of Functional Mouse Brain Areas Revealed by nanoLC-MS Analysis.Mol Cell Proteomics. 2021;20:100130. doi: 10.1016/j.mcpro.2021.100130. Epub 2021 Aug 4. Mol Cell Proteomics. 2021. PMID: 34358619 Free PMC article.
-
Glycoblotting method allows for rapid and efficient glycome profiling of human Alzheimer's disease brain, serum and cerebrospinal fluid towards potential biomarker discovery.Biochim Biophys Acta. 2016 Aug;1860(8):1716-27. doi: 10.1016/j.bbagen.2016.03.009. Epub 2016 Mar 8. Biochim Biophys Acta. 2016. PMID: 26968461
-
Reading and Writing the Human Glycocode.Annu Rev Biochem. 2024 Aug;93(1):529-564. doi: 10.1146/annurev-biochem-030122-044347. Epub 2024 Jul 2. Annu Rev Biochem. 2024. PMID: 38669516 Review.
-
Glycans in the immune system and The Altered Glycan Theory of Autoimmunity: a critical review.J Autoimmun. 2015 Feb;57:1-13. doi: 10.1016/j.jaut.2014.12.002. Epub 2015 Jan 9. J Autoimmun. 2015. PMID: 25578468 Free PMC article. Review.
Cited by
-
Non-targeted N-glycome profiling reveals multiple layers of organ-specific diversity in mice.Nat Commun. 2024 Nov 9;15(1):9725. doi: 10.1038/s41467-024-54134-z. Nat Commun. 2024. PMID: 39521793 Free PMC article.
-
Analysis of carbohydrates and glycoconjugates by matrix-assisted laser desorption/ionization mass spectrometry: An update for 2021-2022.Mass Spectrom Rev. 2025 May-Jun;44(3):213-453. doi: 10.1002/mas.21873. Epub 2024 Jun 24. Mass Spectrom Rev. 2025. PMID: 38925550 Free PMC article. Review.
-
Non-targeted isomer-sensitive N-glycome analysis reveals new layers of organ-specific diversity in mice.Res Sq [Preprint]. 2024 Apr 9:rs.3.rs-4130712. doi: 10.21203/rs.3.rs-4130712/v1. Res Sq. 2024. Update in: Nat Commun. 2024 Nov 9;15(1):9725. doi: 10.1038/s41467-024-54134-z. PMID: 38659835 Free PMC article. Updated. Preprint.
-
N-Glycosylation as a Modulator of Protein Conformation and Assembly in Disease.Biomolecules. 2024 Feb 27;14(3):282. doi: 10.3390/biom14030282. Biomolecules. 2024. PMID: 38540703 Free PMC article. Review.
-
Development and application of GlycanDIA workflow for glycomic analysis.bioRxiv [Preprint]. 2024 Mar 13:2024.03.12.584702. doi: 10.1101/2024.03.12.584702. bioRxiv. 2024. Update in: Nat Commun. 2025 Aug 1;16(1):7075. doi: 10.1038/s41467-025-61473-y. PMID: 38559279 Free PMC article. Updated. Preprint.
References
-
- Varki A, Cummings RD, Esko JD, Freeze HH, Stanley P, Bertozzi CR, Hart GW, Etzler ME. Essentials of Glycobiology. 2. Cold Spring Harbor Laboratory Press; 2008. - PubMed
Publication types
MeSH terms
Substances
LinkOut - more resources
Full Text Sources
